
Abstract
Triple-negative breast cancer is a heterogeneous disease with different molecular and histological subtypes. The Androgen receptor is expressed in a portion of triple-negative breast cancer cases and the activation of the androgen receptor pathway is thought to be a molecular subtyping signature as well as a therapeutic target for triple-negative breast cancer. Thus, identification of the androgen receptor pathway status is important for both molecular characterization andclinical management. In this study, we investigate the expression of the androgen receptor pathway in metaplastic breast cancer and luminal androgen receptor subtypes of triple-negative breast cancer and found that the androgen receptor pathway was downregulated in metaplastic breast cancer compared to luminal androgen receptor subtype. Using random forest, we found that the two subtypes of breast cancer can be molecularly classified with the gene expression of the androgen receptor pathway.
Introduction
Breast cancer is a heterogeneous disease with different molecular features and prognoses. Among them, triple-negative breast cancer (TNBC) which is defined by the lack of expression in estrogen receptor (ER), progesterone receptor (PR) and human epidermal receptor 2 (HER2) by immunohistochemical staining has the most limited therapy choice and worst clinical outcome. TNBC can be further classified into subtypes according to histological morphology as well as molecular features. The histological subtypes of TNBC are composed of the commonest invasive ductal carcinoma of no special type (IDC-NST) and other special subtypes including metaplastic breast cancer, adenoid cystic carcinoma, medullary carcinoma and secretory carcinoma. Studies have shown that TNBC of special types as a single group has a worse prognosis than TNBC-NST, 1 indicating the prognostic value of histological subtyping. Metaplastic breast cancer (MBC) was a special subtype of breast cancer accounting for less than 1% of all invasive breast cancer, characterized by the presence of metaplastic components in cancer tissue which is most commonly squamous carcinoma, followed by chondroid and sarcoma components. Most MBC were triple-negative, 2 and study has shown that MBC has a worse prognosis in all clinical stages after treatment compared to other TNBC. 3 Due to the limited cases of MBC, our understanding of their molecular characteristics remains largely unrevealed.
Molecularly, TNBC can also be classified into various subtypes by different algorithms using gene expression data. 4 -7 Though all of the currently applied subtyping algorithms could distinguish a consistent molecular subtype in TNBC which was the luminal androgen receptor (LAR) subtype. LAR accounted for 15%-20% of all TNBC and was characterized by the high expression of the AR gene and enrichment in hormonally regulated pathways. LAR subtype had a relatively low proliferation rate, decreased relapse-free survival and similar distant metastasis-free survival compared with other subtypes 4,5 and can potentially benefit from anti-AR molecule enzalutamide. 8 Since immunohistochemical stain for AR in TNBC showed that 38%-55% of TNBC has positive AR expression, 8,9 using AR as a surrogate marker of LAR subtype would reveal low specificity.
Recent studies reported the percentage of AR-positive expression cases in MBC to be 0%, 10 8.7% 11 and 11% 12 respectively which was significantly lower than that in TNBC-NST, indicating the lack of luminal differentiation in MBC. Genomic mutation characterization of MBC revealed that it harbored a mutation rate of 57% in PI3K/AKT/mTOR pathway 13 which was much higher than the 4% in AR-negative TNBC but closer to 40% in AR-positive TNBC. 14 Thus, whether the low expression of AR in MBC also indicated the downregulation of the AR pathway and the exact molecular difference between the MBC and LAR group remains unknown.
In this study, we analyzed and compared the expression of AR pathway genes in MBC and LAR using data from TCGA. A machine learning approach was used to differentiate MBC and LAR with AR pathway genes.
Results
Clinicopathological Characteristics of the Studied Cohort
A total of 38 cases of LAR and 14 cases of MBC were selected in the TCGA database. The clinicopathological characteristics including age at diagnosis, ethnicity, tumor stage, tumor size and lymph node status were analyzed with no significant difference detected between the two groups (Table 1).
Clinical Features of Selected Patients.

Androgen Receptor Pathway Genes Were Differentially Expressed in MBC and LAR
A total of 166 genes were identified as the representative genes in the androgen receptor pathway using the Pathway Commons database (Version 12). 15 In addition, recent research has identified another hormonal receptor gene G-protein coupled estrogen receptor (GPER), which was encoded by GPER1. GPER can be activated by hormonal estradiol. Unlike ERalpha and ERbeta which are mostly known to be nuclear receptors, GPER has a seven-transmembrane domain and many studies have confirmed its membrane localization. It was found to be expressed strongly in triple-negative breast cancer and patients younger than 49-years-old. 16 The expression of GPER has reversely correlated with the expression of androgen receptor in TNBC and at the molecular level AR has a repressed regulation on GPER by binding to the promoter of AR genomic region. 17,18 Thus, GPER1 was also included in our analysis as one of the AR pathway genes. The mRNA expression of genes in the AR pathway was analyzed and compared in the 2 groups. Differentially expressed genes were identified and summarized in Table 2. In total, 32 out of the 167 genes have been found to be differentially expressed between MBC and LAR, including RUNX2, AR and GPER1 (Figure 1). The top 5 genes with the highest significance were RUNX2, SPDEF, FOXA1, DDC and AR. Except for DDC which was a metabolic enzyme, the other 4 genes were all transcription factors that have previously been shown to act intimately with one another. 19,20 Among them, RUNX2 was the only upregulated gene in MBC and it was reported to inhibit the effect of AR as a transcription factor by promoting the dissociation of AR from the targeted genes. 21 The SPDEF was downstream of AR, whose expression was induced by AR. 22 FOXA1 was the pioneer gene in the AR pathway and acted by loosening the AR-binding DNA region to facilitate the binding of AR. 23

AR pathway genes were differentially expressed in MBC and LAR. AR was highly expressed in the LAR group while its expression in MBC was low (left panel). The membrane-bound estrogen receptor, GPER1 showed a higher expression in MBC than in LAR (middle panel). As the gene with most significant expression difference, RUNX2 was upregulated in MBC while downregulated in LAR (right panel).
Differentially Expressed AR Pathway Genes Between MBC and LAR Cancers.a
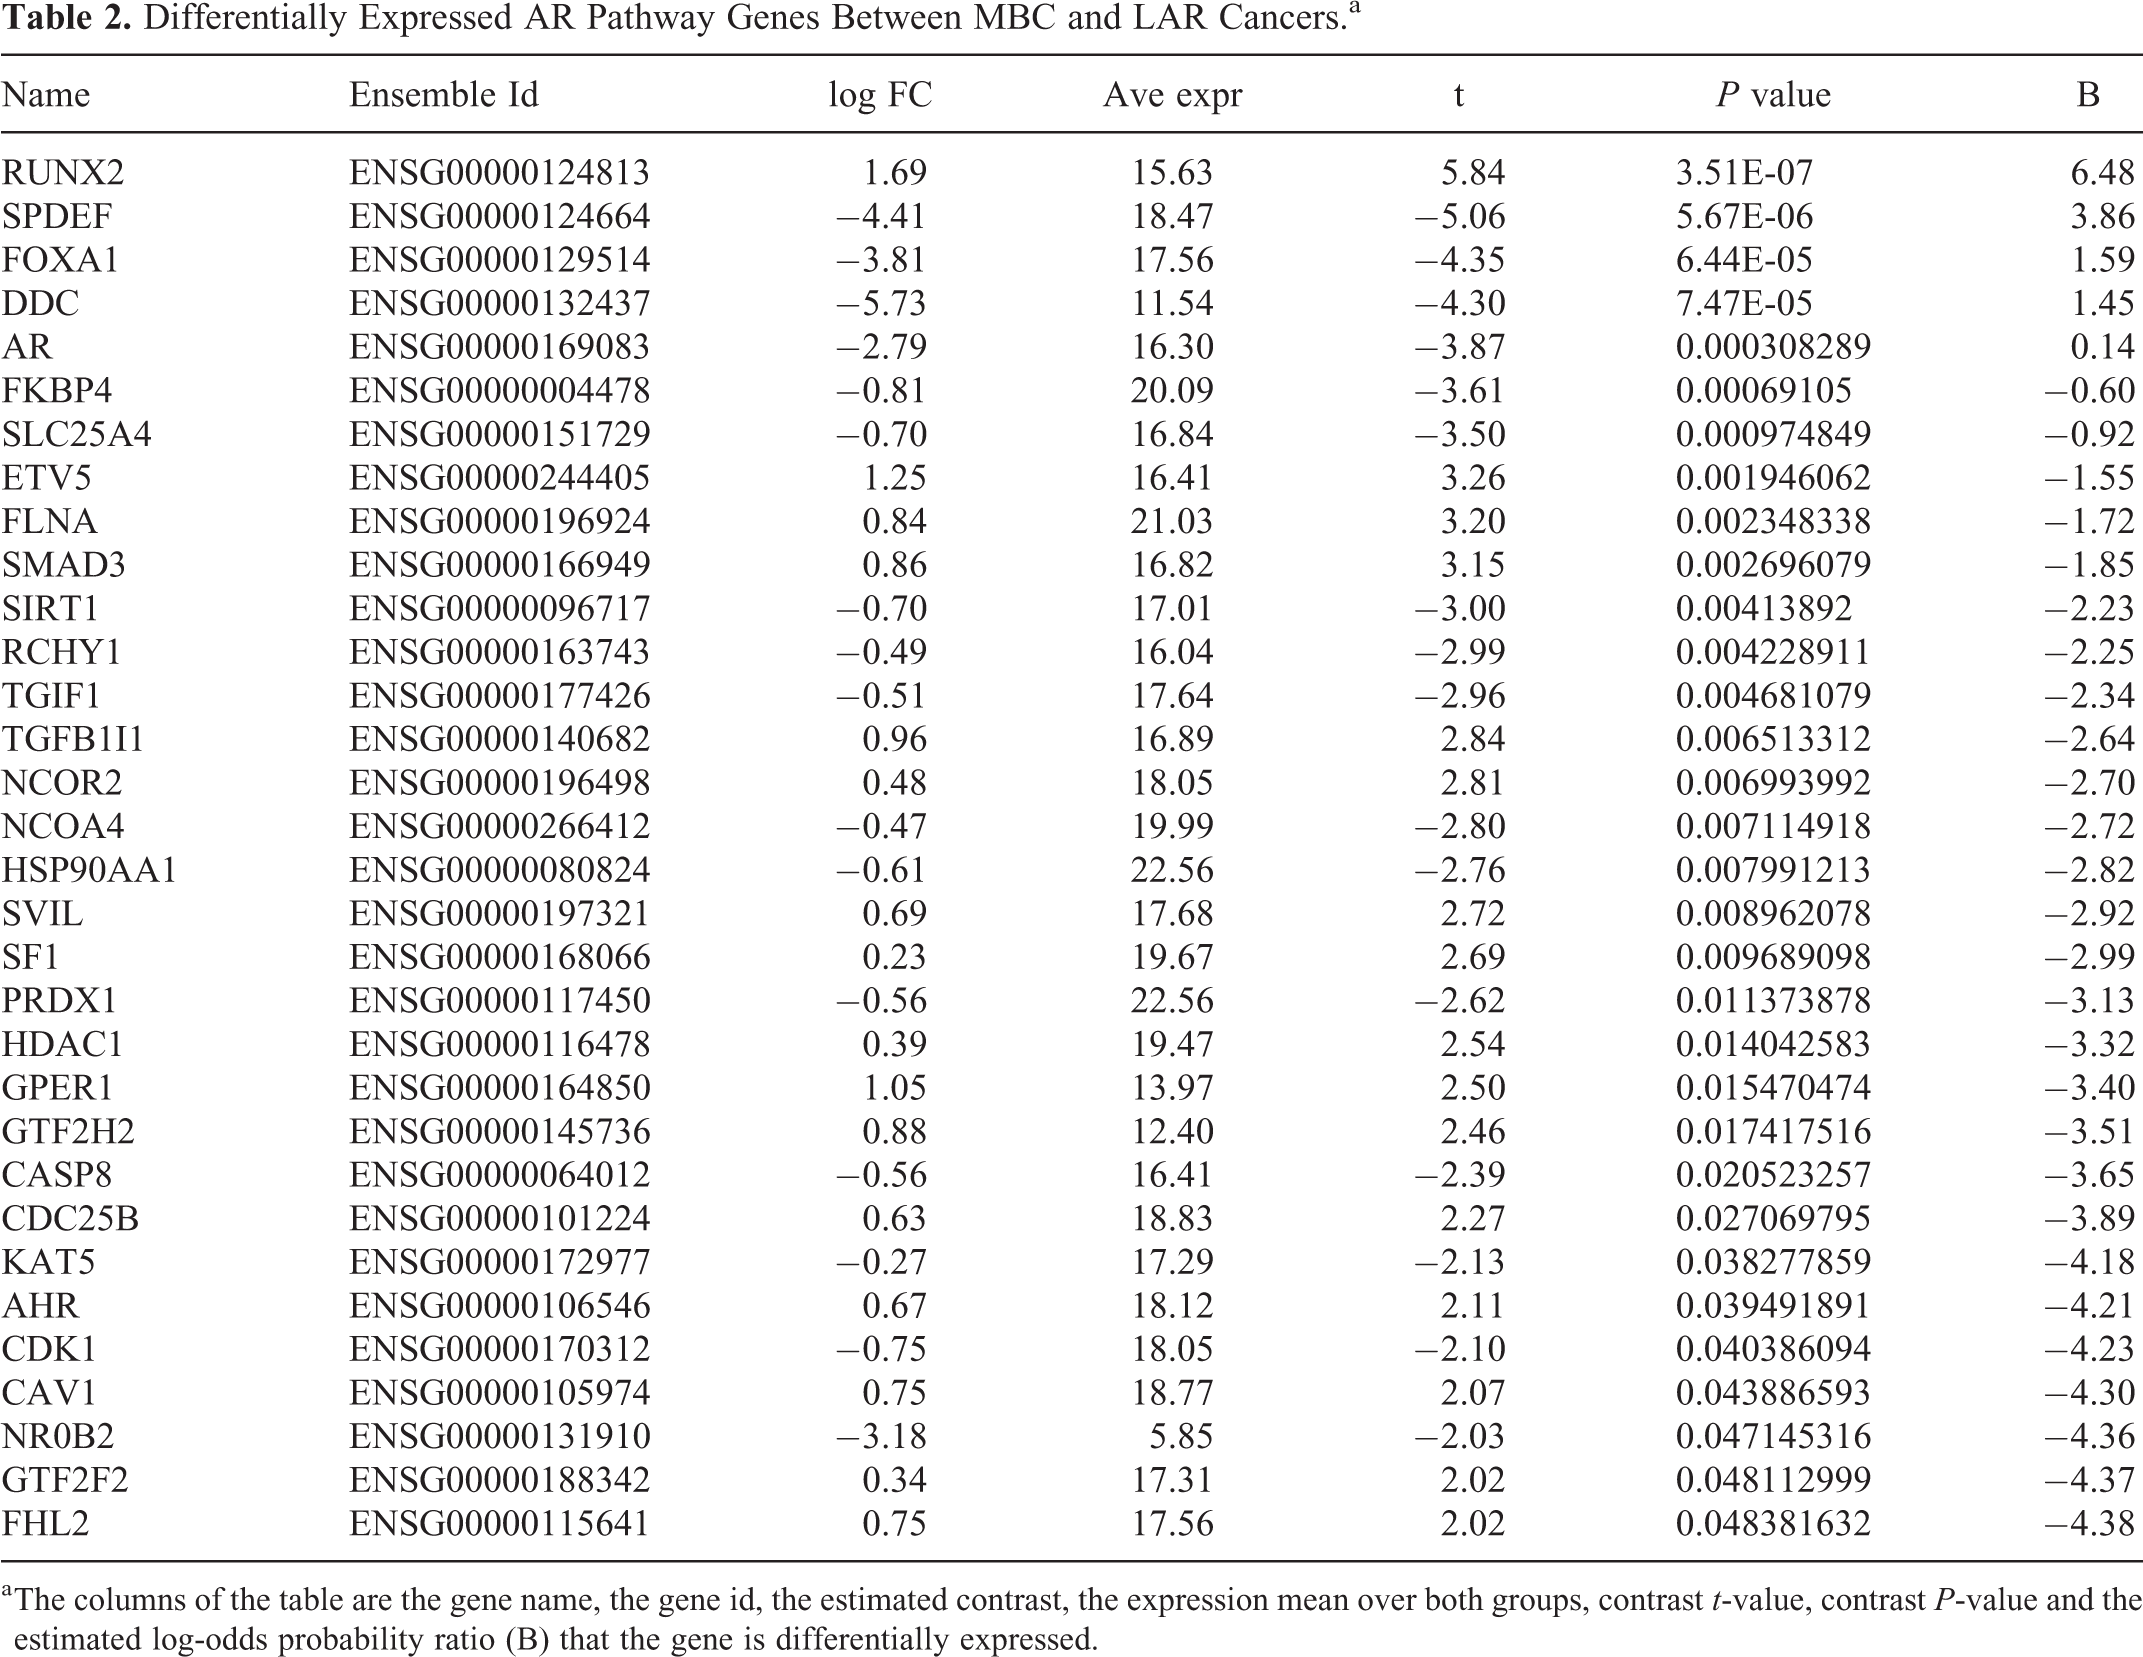
a The columns of the table are the gene name, the gene id, the estimated contrast, the expression mean over both groups, contrast t-value, contrast P-value and the estimated log-odds probability ratio (B) that the gene is differentially expressed.
Classification of MBC and LAR Using Random Forest
The above results suggested that MBC and LAR were differently regulated in the AR pathway. Next, we try to directly differentiate the two groups using gene expression data of the AR pathway. Whereas, using the expression data of a single gene was unable to classify the two groups at 100% efficacy as shown in Figure 1. The machine learning approach was reported to be able to achieve good predictive performance for sample classification using gene expression data. 24 Thus, we further tried to look at the effect of androgen receptor pathway genes on classifying the MBC and LAR groups via the random forest algorithm. Random forest is an algorithm for classification developed in 2001 that uses an ensemble of classification trees 25 and it was widely used in the classification using microarray data. In this task, the expression of the 167 AR pathway genes was used as continuous variables to classify the sample as either MBC or LAR (Figure 2A). The prediction accuracy using the random forest algorithm was 100% (Table 3). Genes that contributed to the classification most were listed in Figure 2B and C. The contribution was measured by Mean Decrease Accuracy or Mean Decrease Gini. RUNX2, FKBP4 and UXT were ranked as the top 3 genes by both Mean Decrease Accuracy or Mean Decrease Gini. Interestingly, the UXT gene was not listed in the DEGs between MBC and LAR, Model visualization was performed by displaying decision tree with the most and least nodes (Figure 3). In the simplest decision tree generated by the random forest algorithm which has three nodes, RUNX2 which has the most significant differential expression between MBC and LAR was used as the root node and no other internal node was used.

Classifying MBC and LAR using random forest algorithm. Clustering of MBC samples (blue) and LAR sample (red) using 167 AR pathway genes (A). Genes that contributed most to the classification were listed using 2 different parameters (B and C).

Visualization of 2 representative trees with the maximum and minimum nodes generated by random forest. The tree with maximum nodes used SPDEF gene expression value as the root node and the expression of other 9 genes as internal nodes, making the total nodes number to be 21. It was a 2-class split for each root and internal node which was determined by the gene expression value of the specific gene in the node. The cutoff value for the binary split in each node was calculated automatically (A). The tree with minimum nodes used the expression of the RUNX2 gene as the single root and internal node, generating 2 leaf nodes.
Classification Accuracy of the Random Forest Model.

In the model construction, a 5-fold cross-validation was also performed for 100 times to avoid overfitting. Average cross-validation error and standard deviation were plotted in Figure 4. It was found that when the number of variables was in the range of 5 to 21, the error of cross-validation reached the minimum value.

Cross-validation of the random forest algorithm for classification of MBC and LAR. A 5-fold cross-validation was performed for 100 times with the number of variables ranging from 1 to 166. The average value and standard deviation for cross-validation were plotted.
Discussion
AR was expressed in a proportion of TNBC and the activation of AR was thought to be a signature for the LAR subtype of TNBC which can be used as a therapeutic target. Thus, identification of the AR pathway status in TNBC cases was important for both molecular characterization and clinical management. In this study, we showed that the AR pathway was differently regulated in MBC and LAR of TNBC. Moreover, through the random forest, the 2 groups of TNBC can be classified using the expression of AR pathway genes with an accuracy rate of 100%. Although currently, MBC shared the same therapeutic choice with TNBC-NST, The obvious downregulation of the AR pathway in MBC compared to LAR may contribute to its histologic differentiation and aggressive behavior. Also, our research suggests that another hormonal receptor GPER was upregulated in MBC compared with LAR, possibly due to the suppression of the AR pathway. Meanwhile, it also indicated that MBC can possibly be activated by estrogen even though it lacks the expression of ER, PR and AR. Recent studies revealed that MBC has more tumor-infiltrating lymphocytes and showed higher PD-L1 expression in both tumor cells and stromal lymphocytes. 26 Thus, whether MBC has similarity with the immunomodulatory subtype still need to be elucidated. The more sophisticated classification of TNBC would enable us to have a better understanding of its molecular mechanism and promote the development of precision medicine.
This study was limited by the small sample size used due to the rarity of MBC. Moreover, MBC was considered as a single group in our study although the included MBC cases had different metaplastic components.
Materials and Methods
TCGA Data Acquisition and Cohort Selection
TCGA RNA sequencing level 3 normalized data were downloaded from TCGA Data Portal and imported into R (Version 4.0.3) using TCGAbiolinks (Version 2.16.4) functions GDCquery, GDCdownload and GDCprepare for further analysis. 27 Among cases having immunostaining data of ER, PR and HER2, 122 TNBC cases have been selected, among them, there were 14 cases of MBC. Samples that are molecularly classified as LAR was identified in a previous article using Lehmann classifier and were used in this study. 28 In total, there are 38 cases of the LAR subtype of TNBC.
Analysis of Differentially Expressed Genes
The gene list selected in the analysis of the AR pathway was searched in Pathway Commons database. The Fragments Per Kilobase of transcript per Million mapped reads Upper Quartile (FPKM-UQ) RNA-seq data were log2-transformed before further process. The FPKM-UQ was implemented at the GDC on gene-level read counts that were produced by HTSeq and based on a modified version of the FPKM normalization method. 29 The log2-transformed FPKM-UQ data were analyzed using limma 30 (Version 3.44.3) functions lmFit, eBayes and top Table to identify DEGs between MBC samples and LAR samples. Student t-test was utilized to calculate the P values of genes. Genes with P < 0.05 were considered as DEGs.
Random Forest Analysis
The log2-transformed FPKM-UQ data of DEGs in the MBC and LAR samples were imported into the randomForest function of the randomForest package (Version 4.6-14). 31 The randomForest function implements Breiman’s random forest algorithm for classification, the algorithm yields an ensemble that can achieve both low bias and low variance and effectively avoid overfitting. The MDSplot function was implemented for the multi-dimensional scaling plot of the proximity matrix from randomForest. The number of trees (ntree) was set to be 500 by default. Each tree was grown independently, and the final prediction was yielded by the mean value. 70% of the dataset was taken for training and the rest for testing by default.
Footnotes
Authors’ Note
Taobo Hu and Guiyang Zhao contributed equally to this article. Our study did not require an ethical board approval because all data used in the manuscript were public accessible and were download from public database.
Declaration of Conflicting Interests
The author(s) declared no potential conflicts of interest with respect to the research, authorship, and/or publication of this article.
Funding
The authors disclosed receipt of the following financial support for the research, authorship, and/or publication of this article: This work was supported by the National Natural Science Foundation of China (Grant No. 82002979), the Scientific Research and Development Funds of Peking University People’s Hospital (Grant No. RDY2020-16), and Peking University Medicine Fund of Fostering Young Scholars’ Scientific & Technological Innovation supported by “the Fundamental Research Funds for the Central Universities” (Grant No. BMU2020PYB022 and BMU2021PYB013).