
Abstract
Background:
This study aimed to evaluate T staging system for non-small cell lung cancer (NSCLC) using tumor volume (TV) and other prognostic factors.
Methods:
This study included 1309 cases. The TV and greatest tumor diameter (GTD) were semi-automatically measured. The receiver operating characteristic (ROC) curves of TV and GTD were used to predict survival. The regression analysis was used to describe the correlation between GTD and TV. Overall survival (OS) was analyzed using the Kaplan-Meier method. Cox’s proportional hazards regression model was applied for multivariate analysis.
Results:
Using the OS in pN0M0 patients (997 cases), we obtained 4 optimal cutoff values and divided all cases into 5 TV groups (V1: TV ≤ 2.80 cm3; V2: TV > 2.80–6.40 cm3; V3: TV > 6.40–12.9 cm3; V4: TV > 12.9–55.01 cm3; V5: TV > 55.01 cm3) with significant OS (P < 0.001). Multivariate analysis showed that age, visceral pleural invasion (VPI), and all TV cutoff points were independent factors of OS (P < 0.05). For V3 and V4 groups, the OS in patients without VPI was better than that in patients with VPI. Using the values of TV, VPI, and N stages, we classified all cases into 5 stages from I to V depending on the OS. The OS in I, II, III, IV, and V stages were 71.3%, 65.5%, 59.8%, 47.7%, and 35.1% respectively (P < 0.001).
Conclusions:
We proposed a new T staging system using TV as the main prognostic descriptor in NSCLC patients, which may provide a better comprehensive clinical value than GTD in clinical applications.
Keywords
Introduction
Currently, with approximately 1.61 million new cases diagnosed each year all over the world, lung cancer is still the most common cancer. 1 Among all lung cancer cases, non-small cell lung cancer (NSCLC) comprises more than 80%. 2 Although advanced surgical and adjuvant treatment clinical methods are being applied, the prognosis for patients with NSCLC remains poor. 3,4
Currently, the tumor, node, and metastasis (TNM) staging system, issued by the Union for International Cancer Control (UICC) and American Joint Committee on Cancer (AJCC), is the most significant clinical reference for physicians to make treatment decisions and predict prognosis. 5 -8 The latest 8th edition of the TNM staging system that was published in 2017, used more comprehensive data with the purpose of increasing prognostic accuracy for each stage in NSCLC patients. 9 Nevertheless, substantial variations in survival were observed among patients even within the same stage, suggesting that TNM stage alone was not sufficient to be a satisfactory prognostic indicator. 10
Since the 1970s, the greatest tumor diameter (GTD) has always been one of the most important prognostic factors in TNM staging for lung cancer patients. 11 Admittedly, GTD has its distinct characteristics: it can reflect tumor progression, it is associated with prognosis in patients, and it is convenient to measure. Accordingly, as a cancer descriptor, GTD has held a prominent position for over 50 years. 9 However, many previous studies have proven that GTD may not reflect a real burden of tumor mass accurately, especially in case of irregular tumors. 12 -15
Computed tomography (CT) has been used as one of the standard and non-invasive processes for preoperative staging, treatment evaluation, and prognosis prediction for NSCLC for many years. 16 With the development of imaging technology, the dimensions of tumor volume (TV) can be conveniently acquired and measured using advanced CT software. 17,18 Several previous studies demonstrated that TV was an independent significant prognostic factor in NSCLC patients who underwent curative resection. 19 -23 Furthermore, since TV has been proven to have an advantage in reflecting the true tumor burden, previous researchers has suggested that TV influenced the prognosis in NSCLC patients to a greater extent than GTD did. 24,25 However, considering the small sample size or a number of specific stages used in previous studies, the systematic research on the relationship between TV and patient prognosis in the context of the latest staging system has not been well established.
This study aimed to evaluate the prognostic impact of TV as the main index for prognosis in NSCLC patients with stage I to stage III after a complete surgical resection. Furthermore, we aimed to develop a new T staging system that is mainly based on TV.
Materials and Methods
Patients
This research was officially approved by the ethics committee of our center and all patients declared no consents of participating in this study (IRB reference no: B2019-116-01). We retrospectively reviewed 2827 patients with pathologically documented NSCLC at our center from January 1, 2010 to December 31, 2012. Patients were excluded from our data if they didn’t undergo curative surgical resection, had other types of cancer, received neo-adjuvant chemotherapy, did not have CT records at our center or had an unmeasurable tumor on CT due to atelectasis, obstructive pneumonia and ground-glass opacity (GGO) in CT images, were lost of follow-up, or other problems. Finally, we included 1309 patients in this study. The process of cases collection and screening is summarized in Figure 1. The clinical characteristics of patients were collected using a standardized medical data collection form. The initial staging of cases was based on the eighth edition of the TNM Classification for Lung Cancer. 9
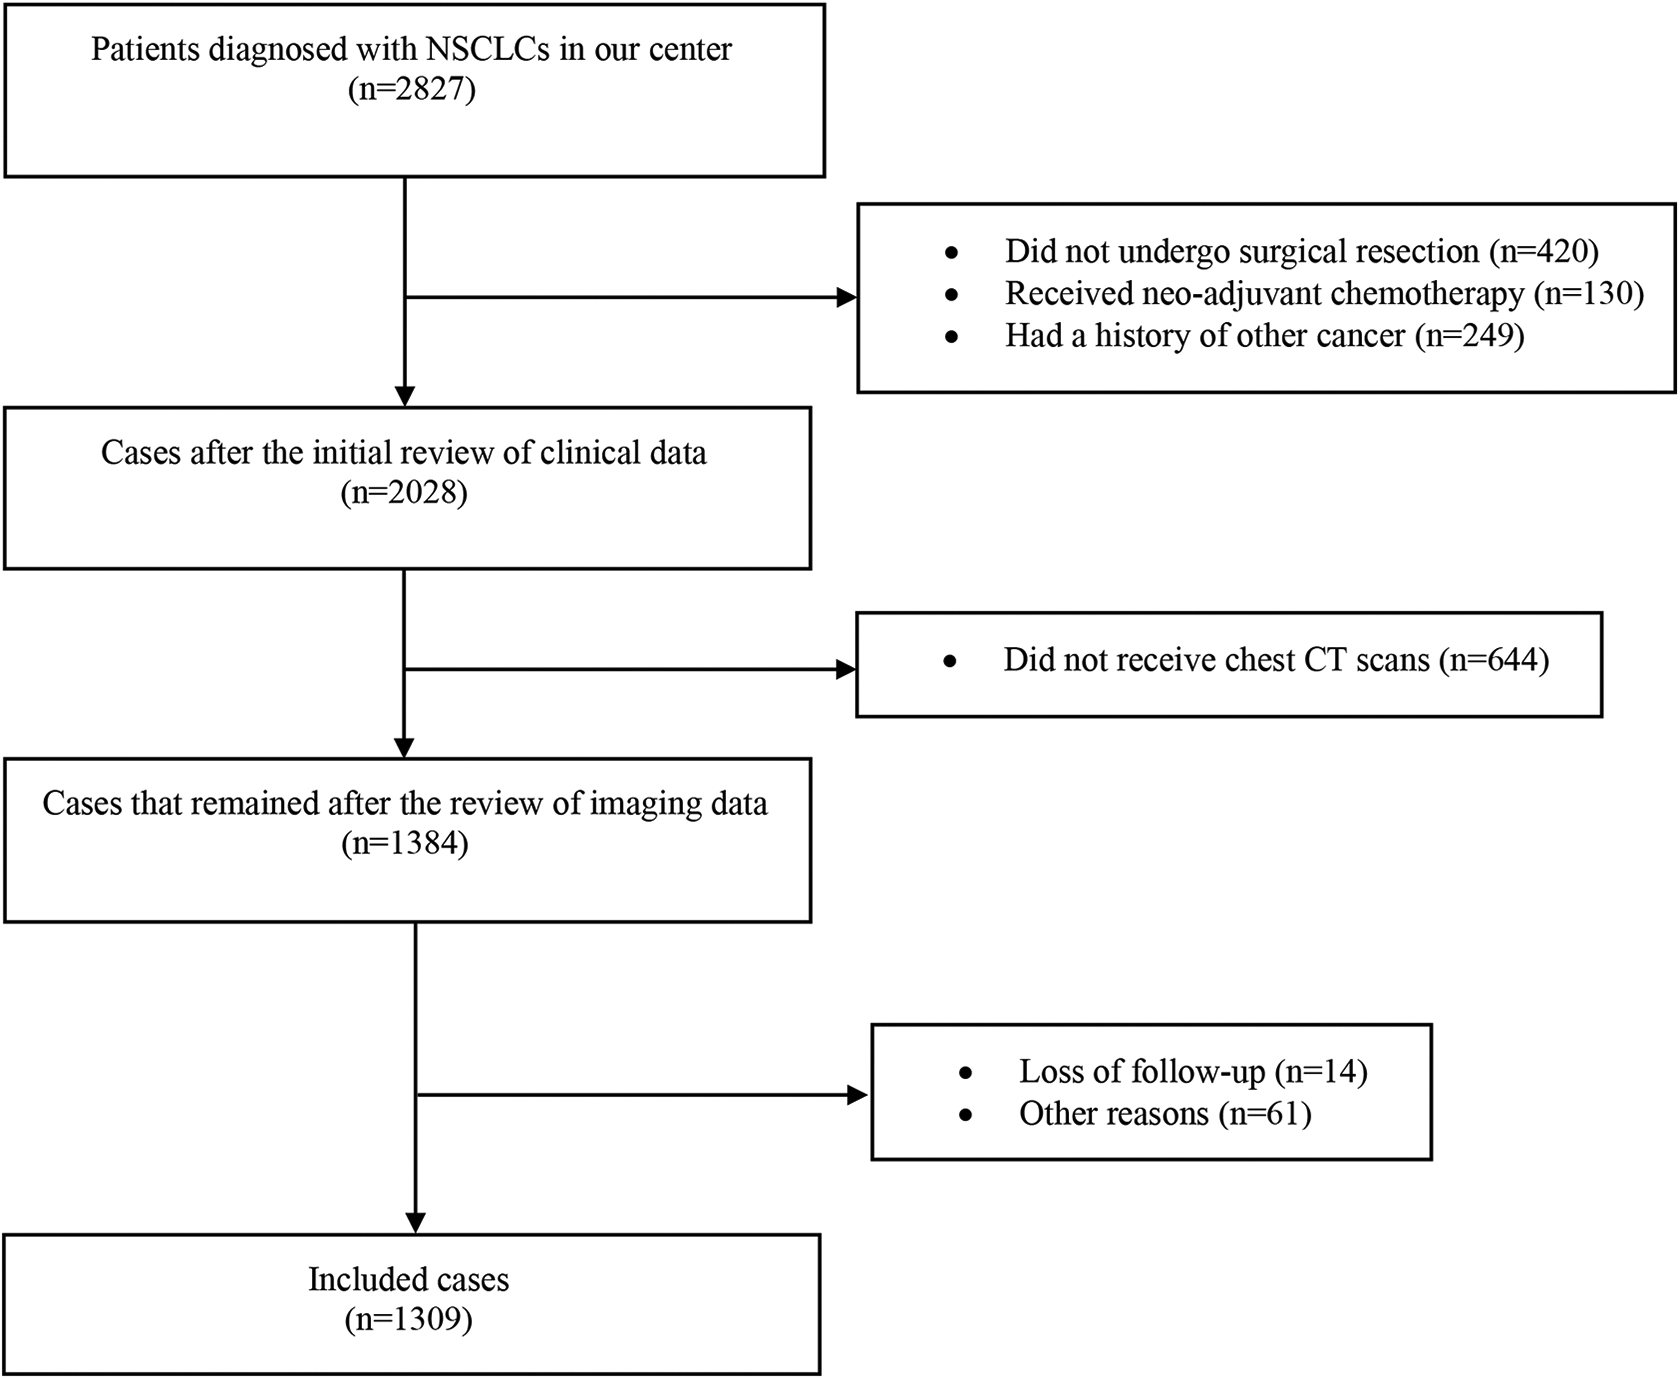
The flow chart of cases collection and screening. Abbreviations: NSCLC, non-small cell lung cancer; CT, computed tomography.
The standard preoperative examinations of NSCLC patients included physical examination, blood test, chest X-rays, chest and abdomen CT, brain magnetic resonance imaging (MRI), bronchoscopy, pulmonary function tests, and electrocardiography.
Lung resection was performed through thoracotomy (Open) or video-assisted thoracoscopic surgery (VATS). The extent of resection included lobectomy, bio-lobectomy, and pneumonectomy. Mediastinal lymph node dissection was performed by surgeons after the lung resection routinely.
TV and GTD Measurement
The contrast enhanced CT images (PHILIP Ict) with section thickness of 1 mm were reviewed by a radiologist blindly using standard lung windows (level −500 HU; width 1500 HU) without knowing the background information of patients. The dimensions for TV and GTD were measured semi-automatically using PHILIPS IntelliSpace Portal v5.0.2.40009 software (Philips Healthcare, Eindhoven, The Netherlands). The software could calculate the TV value automatically after the radiologist outlined the boundary of tumor mass in different imaging dimensions manually (Supplemental Figure).
TV Optimal Cutoff Values
The optimal cutoff TV values were determined using X-tile version 3.6.1 software (Yale University School of Medicine, New Haven, CT, USA) according to the OS of pN0M0 patients. 26
Follow-Up
All patients accepted follow-up in our out-patient department for at least 5 years after surgery. The standard follow-up process included physical examination, blood test, tumor markers, chest X-ray, chest, and abdominal CT scan. The Overall Survival (OS) was calculated from the date of surgery to the event of death or the date of the last contact.
Statistical Analysis
The receiver operating characteristic (ROC) curves of TV and GTD were used to predict survival, and the values of the area under curves (AUC) were compared using Z test. OS was analyzed using the Kaplan-Meier method and tested using the log-rank test. Cox’s proportional hazards regression model was applied for multivariate analysis. The Pearson correlation coefficient was used to analyze the correlation between GTD and TV. The regression analysis was used to describe the company relationship between GTD and TV. The linear and non-linear models were tested using F-test, and the coefficients and constants of these models were tested using t-test. Statistical analysis was performed using SPSS 23.0.0.0 for Mac system (SPSS Inc., Chicago, IL, USA). If the P value (2-tailed test) was less than 0.05, a significant difference was identified in our study.
Results
Clinical Characteristics of Patients
The clinical characteristics of our included 1309 patients are summarized in Table 1. This study included 926 cases of male and 383 cases of female. The cases of N0, N1 and N2 were 998 (76.2%), 121 (9.2%) and190 (14.6%) respectively.
The Summary of Patient Clinical Characteristics in the Included Cases.

VATS, video-assisted thoracoscopic surgery
ROC Curve Analysis
ROC curves showed that values for both AUC of TV and GTD were 0.586 (95% confidence interval [CI]: 0.555–0.617, P < 0.001) (Figure 2). This result indicated that survival was correlated significantly with both TV and GTD.
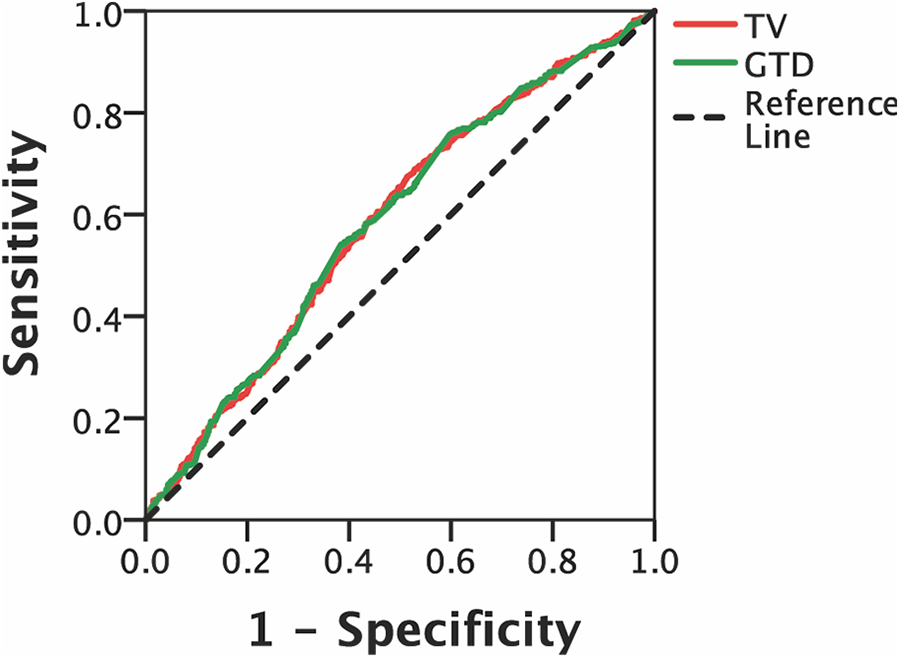
The area under the ROC curves for OS determined using TV and GTD. Abbreviations: ROC, receiver operating characteristic; OS, overall survival; TV, GTD.
Correlation Analysis of GTD and TV
Our results suggested that the correlation between GTD and TV were in accordance with growth model. The equation for growth model was as follows:

where
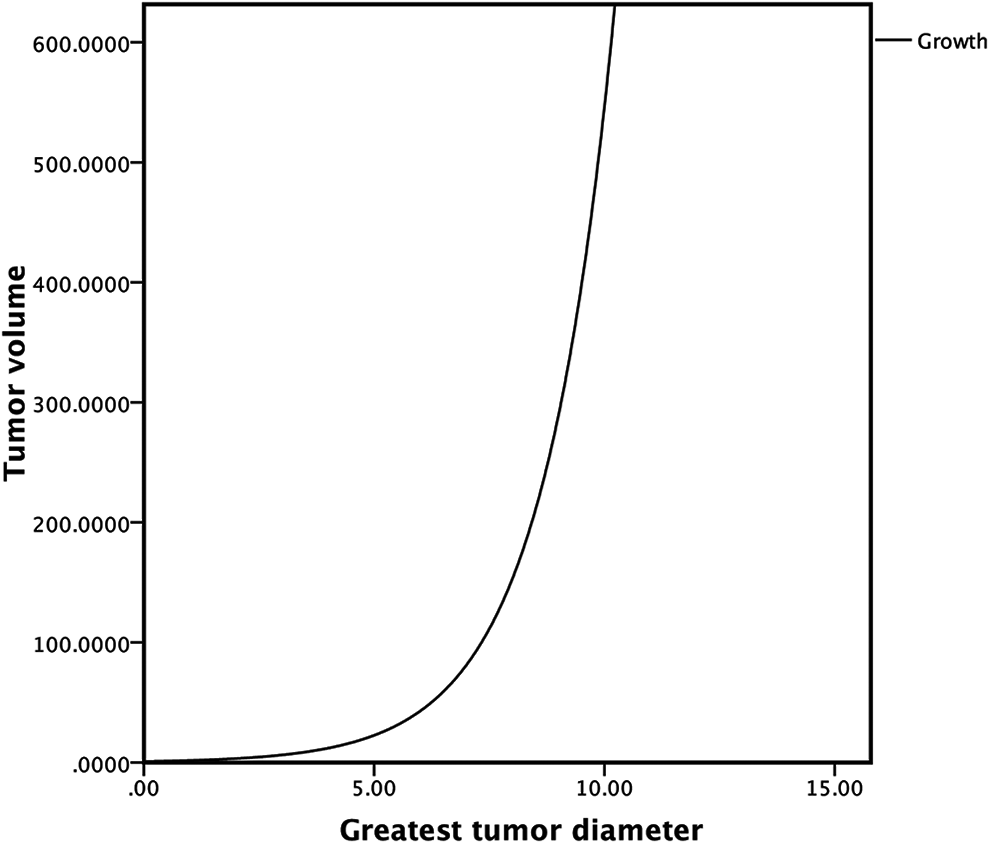
The estimated curve for the correlation between TV and GTD. Abbreviations: TV, tumor volume; GTD, greatest tumor diameter.
Optimal Cutoff Values for TV
We used the data of OS in patients to obtain 4 optimal cutoff values based on the pathologically staged pN0M0 tumors (997 cases): 2.80 cm3, 6.40 cm3, 12.9 cm3, and 55.01 cm3. These cutoff values corresponded to GTD of 1.71 cm, 3.01 cm, 4.11 cm, and 6.39 cm, respectively. Then we divided all patients into 2 subgroups using 2.80 cm3 as a cutoff value. The OS in patients with TV smaller than 2.80 cm3 (71.3%) was significantly better than that in patients with TV larger than 2.8 cm3 (55.0%) (P < 0.001). Similarly, the OS in patients with TV smaller than 6.40 cm3 (67.8%), 12.9 cm3 (64.8%) and 55.01 cm3 (59.8%) were obviously better than those with TV larger than 6.40 cm3 (51.9%), 12.9 cm3 (50.2%) and 55.01 cm3 (48.2%) respectively. (P < 0.001) (Figure 4).

The comparison of OS in pN0M0 patients using the cutoff points of 2.80 cm3, 6.40 cm3, 12.90 cm3 and 55.01 cm3, respectively. Abbreviations: OS, overall survival.
Group Analysis of OS by TV Cutoff Values
Using 2.80 cm3, 6.40 cm3, 12.9 cm3, and 55.01 cm3 as cutoff points, we divided pathologically staged pN0M0 patients into 5 groups (V1: TV ≤ 2.80 cm3; V2: TV > 2.80–6.40 cm3; V3: TV > 6.40–12.9 cm3; V4: TV > 12.9–55.01 cm3; V5 > 55.01 cm3). The survival rate in each subgroup for pN0M0 patients was 71.3%, 64.8%, 57.2%, 51.3%, and 48.2%, respectively (P < 0.001) (Table 2).
The Analysis of OS by TV Groups With or Without VPI in pN0M0 Cases.

OS, overall survival; TV, tumor volume; VPI, visceral pleural invasion
Univariate and Multivariate Analyses of Prognostic Factors for OS
Our results revealed that the prognostic factors in univariate analyses included sex, age, smoking, type of surgery, tumor location, histology, visceral pleural invasion (VPI), all TV cutoff points, and GTD cutoff points (3.0 cm, 4.0 cm, and 5.0 cm). Accordingly, we included these factors into multivariate analysis and results showed that age (Hazard ratio [HR]: 1.482, 95%CI: 1.056–2.081), VPI (HR: 1.632, 95%CI: 1.171–2.274) and all TV cutoff points (2.80 cm3: HR: 1.692, 95%CI: 0.853–2.358; 6.40 cm3: HR: 1.615, 95%CI: 0.838–3.111; 12.9 cm3: HR: 0.810 CI: 0.4281.533; 55.01 cm3: HR: 1.634, 95%CI: 0.886–3.013) were independent factors of OS (Table 3).
The Univariate and Multivariate Analyses of OS in pN0M0 Cases.
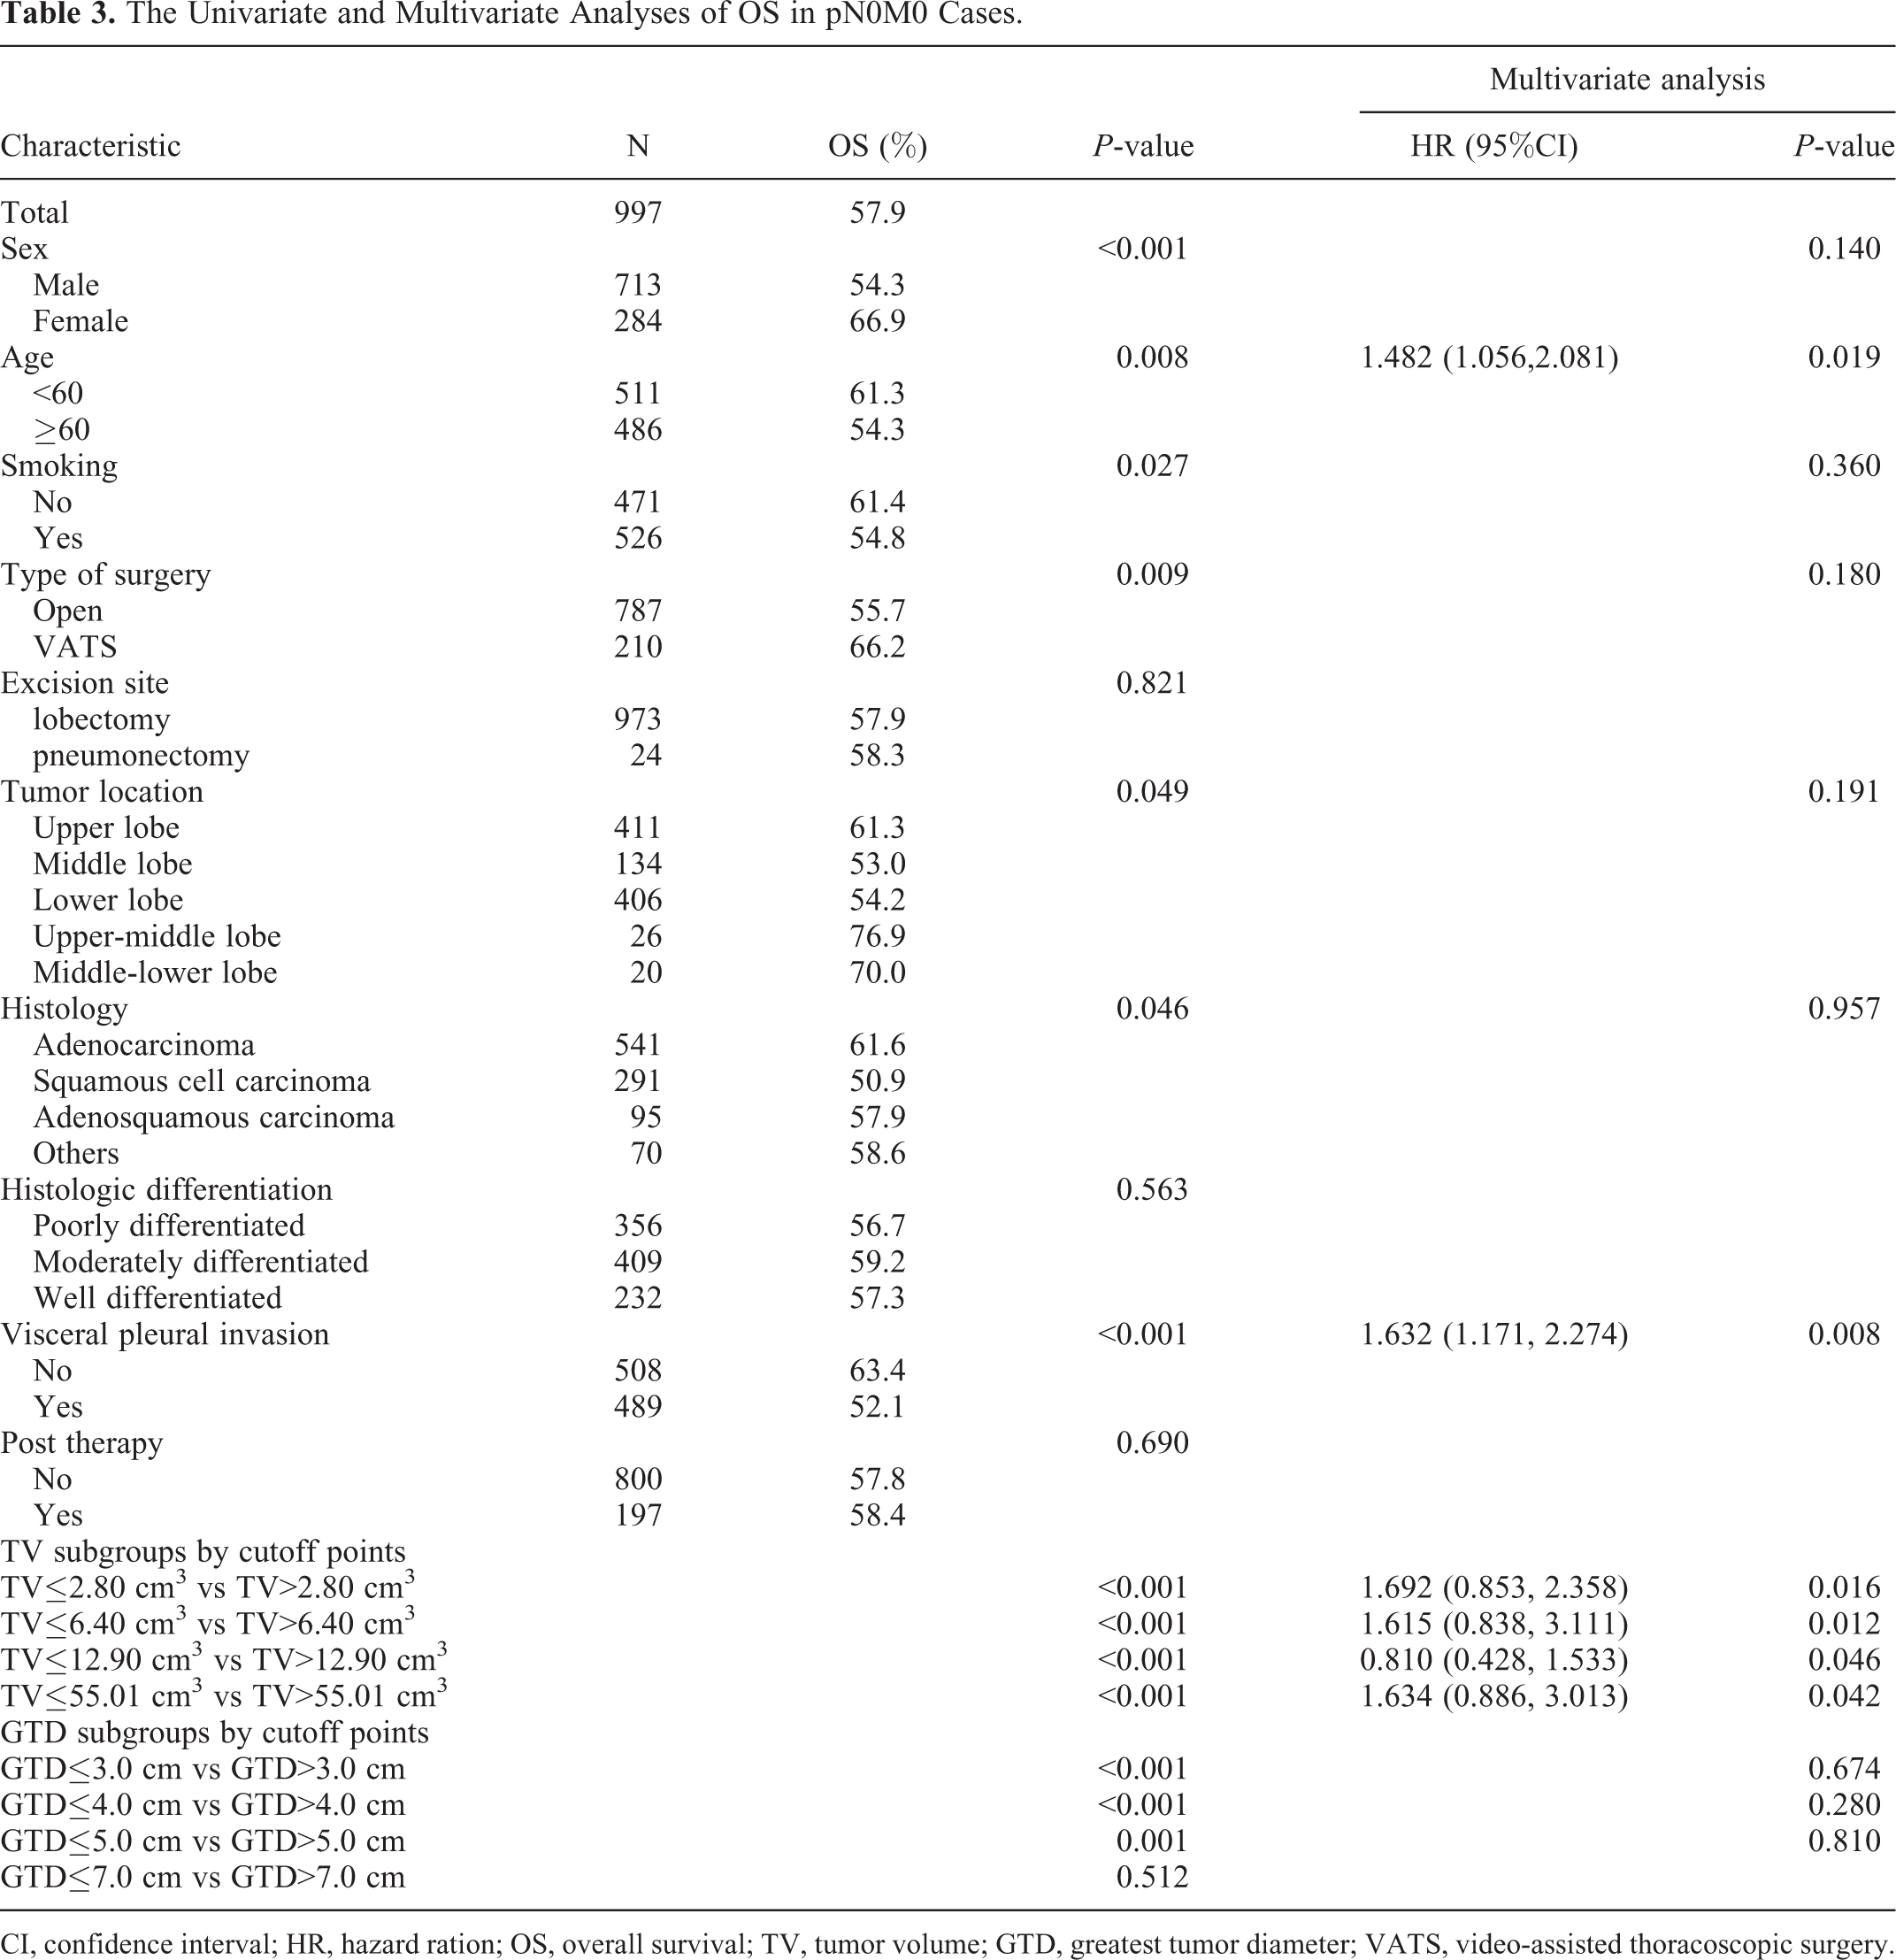
CI, confidence interval; HR, hazard ration; OS, overall survival; TV, tumor volume; GTD, greatest tumor diameter; VATS, video-assisted thoracoscopic surgery.
The Analyses of OS by Presence or Absence of VPI
According to the presence or absence of VPI, we further divided patients in each TV group into 2 subgroups and compared their OS. The results revealed that for V3 group (TV > 6.40–12.90 cm3), the OS in patients without VPI (66.2%) was significantly better than that in patients with VPI (50.0%) (P = 0.038). Similarly, for V4 group (TV > 12.90–55.01 cm3), the OS in patients without VPI (59.6%) was significantly better than that in patients with VPI (47.3%) (P = 0.002). However, we did not observe similar results in other groups (P > 0.05). (Table 2)
The Analyses of OS by the Groups Combining TV, VPI and N Stages
In order to further compare the OS using the combined impact of TV and N stages, we divided all patients into 15 subgroups by the different combinations of TV and N stages. In addition, according to the results of VPI mentioned above, we also took VPI as a prognosis factor into consideration for V3N0M0 and V4N0M0 stages. Finally, we had 17 subgroups in total. The survival analysis revealed that there was a similar survival rate in several different subgroups (P > 0.05). Therefore, we classified these subgroups into 5 different stages from I to V based on the OS results. The OS of I, II, III, IV, and V stages are 71.3%, 65.5%, 59.8%, 47.7%, and 35.1% respectively (P < 0.001). These results are summarized in Table 4 and Figure 5.
The Summary of OS Analysis Combining the Obtained From Groups TV, VPI and N Stages.

OS, overall survival; TV, tumor volume; VPI, visceral pleural invasion

The comparison of OS in total patients based on the new TV staging system of I, II, III, IV and V. Abbreviations: OS, overall survival.
The Proposed Staging System According by TV
According to the results shown above, we developed a new T staging system, which is based on TV as summarized in Table 5.
The Proposed Staging System Incorporating TV Values.

TV, tumor volume; VPI, visceral pleural invasion
Discussion
In this study, we used TV as the main index to evaluate the prognosis of NSCLC patients with stage I to stage III after a complete surgical resection. Furthermore, we proposed a new T staging system mainly based on TV. Traditionally, when a tumor was supposed to be a spheroid, pathologic specimen TV was approximately calculated using the formula:
However, this conventional method cannot be applied to all types of tumors, especially in the cases of tumors with irregular mass. In this study, using imaging software, we could describe the boundaries of tumor mass more accurately. Therefore, we can acquire the real value of TV to reflect the true tumor burden.
During the past several years, with advances made in imaging technologies, many studies have suggested that TV was a more reliable prognostic predictor than GTD. For stage Ia NSCLC, Takenaka et al found that the volume of the tumor solid part was strongly associated with outcome. 21 In addition, Tsai et al analyzed 236 NSCLCs with stage Ia and proposed that tumor volume may evaluate tumor size and prognosis more accurately. 27 Our previous study also demonstrated that TV was an independent prognostic factor for stage I NSCLC. 22 For stage II NSCLC, Dai et al suggested that tumor volume >20 cm3 was related to poor outcome in patients. Nevertheless, to the best of our knowledge, most of related studies are limited to one specific stage, and the systemic T staging based on TV has not been well established.
The prognostic significance of tumor volume in nonsurgical therapies have also been confirmed in many previous studies. For adjuvant therapy, Dehing-Oberije et al concluded that in NSCLC patients, tumor volume combined with positive lymph nodes had more prognostic significance than TNM stage. 28 Furthermore, Alexander et al also suggested that current staging systems may not provide a complete information on prognosis in NSCLC patients who underwent chemoradiotherapy; and tumor volume was a better factor to predict outcome for these patients. 29 Furthermore, metabolic tumor volume (MTV), measured by PET-CT, also has been evaluated for its value in the tumor burden as shown by predicting OS and DFS in NSCLC patients. 23,30 Overall, a systematic research on the prognostic value of TV in NSCLC patients is necessary for making clinical treatment projects. Therefore, in the present study, we aimed to evaluate T staging system using TV rather than GTD in stage I-III NSCLC patients after surgical resection.
According to our results, 4 optimal cutoff TV values were obtained using x-tile software. Then, we divided all patients into 5 TV groups based on the significant differences in OS. For pN0M0 cases, both univariate and multivariate analyses of OS in our study revealed that VPI was an independent prognosis factor in pN0M0 patients besides the age and TV cutoff points. VPI, defined as tumor invasion into the visceral pleura elastic layer but not the parietal pleura, has been included in the TNM staging system as one of the T2 descriptors for its significant adverse impact on the prognosis in NSCLC patients. 9
Therefore, in order to reduce the bias caused by the impact of VPI, for a more accurate evaluation of the prognostic value of TV, we compared the OS in each of the TV groups among patients with or without VPI. We found that the OS in patients without VPI was significantly better than that in patients with VPI when TV > 6.40-12.90 cm3 and TV > 55.01 cm3. According to the growth equation we mentioned before, these TV cutoff points were corresponding to 3.01 cm, 4.11 cm, and 6.39 cm respectively, which we estimated as T2 stage. Similarly, tumors sized between 3.0 and 7.0 cm with VPI were found to be associated with worse prognoses than those without VPI in previous studies. 31,32 Accordingly, in this study we used VPI as an independent upstaging factor in addition to TV and N stages. However, according to the latest edition of the TNM staging system, VPI should not be used to upstage tumors. 33 Considering there are still controversy for the staging value of VPI in NSCLC patients, we believe that our research may provide additional reference in this field.
An accurate prediction of NSCLC patient prognosis preoperatively plays important role for physicians when they decide on appropriate treatment methods. TNM staging system was first published in 1968 and has undergone several modifications during the last 50 years with the advances in understanding in cancer prognosis. GTD, as the main prognostic factor of TNM staging, is still the most recognized indicator to measure tumor mass worldwide. 9 However, there are still many controversial findings related to the latest eighth edition of the staging system. 34 -37 Therefore, in this study, we aimed to propose an exploratory T staging system based mainly on TV rather than on GTD. Likewise, our results revealed that different groups defined by the combined impact of TV, VPI, and N stages, can be classified into several stages based on the OS. In our study, all cases can be classified into 5 stages in total. Similar to the relationship between GTD and survival, our results revealed that larger TV is also associated with poorer prognosis. The main reason for this phenomenon may be that tumors with larger TV accompanied with greater tumor burden, which have more risk of lymphatic metastasis and distant metastasis for NSCLC patients. 38,39 Nevertheless, compared with the latest TNM staging system, our staging system based on TV, provided different classification depending on different OS. The most important reason for this difference is that we used TV as a main descriptor for OS with its natural differences with GTD.
Currently, with more and more pulmonary nodules that are being detected using imaging technologies, the need for lymph nodes dissection is still under a debate for this group of cases. 40 -42 The main reason for this lack of consensus is the discrepancy between the irregular shapes of different tumor masses, even among those with the same sizes. 22 In the other words, GTD is not sufficient to reflect tumor burden. According to our TV staging system, the survival of patients with N0-N2 in V1-V3 groups, respectively, was different, which indicates that the lymph nodes dissection should be applied routinely for the cases of small tumor after lobectomy. Accordingly, our findings may have clinical value for surgeons to choose proper operative methods based on lymphatic status.
With the wide use of CT and 3D reconstruction technology, the precise and convenient TV measurements will be more and more available for clinical physicians. Comparing with traditional T staging system, we believe that a new T staging system based on TV may provide more valuable reference for surgeons to choose treatment projects and predict survival in NSCLC patients preoperatively, and our research can contribute to the prevalence and application of TV as the main clinical prognosis factor in the future.
Several limitations should be mentioned in this study. Firstly, it was a retrospective study with its respective potential biases. Secondly, we used OS as the indicator of prognosis, and patients received various postoperative adjuvant treatments such as chemotherapy and radiotherapy. Therefore, the outcomes of OS analysis may have been affected by these factors. Thirdly, considering the limited data available in our medical records, we did not include other factors such as metastasis and N3 stage as staging descriptors in this study. Therefore, this is an exploratory T staging system based on TV and more comprehensive data from multiple centers are needed for further research to verify our findings.
In summary, we proposed a T staging system using TV as a main prognostic descriptor for NSCLC patients. Since TV can reflect tumor burden more accurately than GTD, this exploratory staging system may provide a more comprehensive clinical value than GTD for making optimal treatment decisions and predicting survival. Besides, as a new systematic T staging system based on TV, our findings may provide valuable references for further study of this field.
Supplemental Material
Supplemental Material, Supplemental_Figure_1 - The Study of Tumor Volume as a Prognostic Factor in T Staging System for Non-Small Cell Lung Cancer: An Exploratory Study
Supplemental Material, Supplemental_Figure_1 for The Study of Tumor Volume as a Prognostic Factor in T Staging System for Non-Small Cell Lung Cancer: An Exploratory Study by Bei Jia, Xu Zhang, Yunxian Mo, Biao Chen, Hao Long, Tiehua Rong and Xiaodong Su in Technology in Cancer Research & Treatment
Footnotes
Abbreviations
Authors’ Note
Co-first author: Bei Jia, Xu Zhang, Yunxian Mo. This research was officially approved by the ethics committee of Sun Yat sen University Cancer Center and all patients declared no consents of participating in this study (IRB reference no: B2019-116-01).
Acknowledgments
We would like to thank Editage (www.editage.cn) for English language editing.
Declaration of Conflicting Interests
The author(s) declared no potential conflicts of interest with respect to the research, authorship, and/or publication of this article.
Funding
The author(s) disclosed receipt of the following financial support for the research, authorship, and/or publication of this article: This study was supported by the grant from Science and Technology Planning Projects of Guangdong Province (No: 01578040171810021).
Supplemental Material
Supplemental material for this article is available online.
References
Supplementary Material
Please find the following supplemental material available below.
For Open Access articles published under a Creative Commons License, all supplemental material carries the same license as the article it is associated with.
For non-Open Access articles published, all supplemental material carries a non-exclusive license, and permission requests for re-use of supplemental material or any part of supplemental material shall be sent directly to the copyright owner as specified in the copyright notice associated with the article.