
Abstract
Objective:
Nasopharyngeal carcinoma is highly endemic in Southeast China. Circulating tumor cell is an important biomarker in the prognosis of variety kinds of cancers. Overexpression of fibronectin 1 was observed in variety kinds of malignancies and may contribute to progress and metastasis of the cancers. The current study was aimed to investigate phenotypes of circulating tumor cell in nasopharyngeal carcinoma blood and fibronectin 1 expression in the circulating tumor cell, and their clinical application in predicting nasopharyngeal carcinoma prognosis.
Methods:
Blood samples were obtained from nasopharyngeal carcinoma patients before and after treatment. CanPatrol circulating tumor cell enrichment and RNA in situ hybridization were applied to identify circulating tumor cell and its phenotypes. Fibronectin 1 messenger RNA expression in the cells of circulating tumors was examined by messenger RNA-in situ hybridization.
Results:
Circulating tumor cell was not associated with tumor characteristics or lymph node metastasis. Patients with >9 circulating tumor cells or >5 mesenchymal phenotype circulating tumor cell per 5-mL blood had poorer progression-free survival (P < .05). Multivariable analysis demonstrated that 2 or more mesenchymal phenotype circulating tumor cells with high fibronectin 1 messenger RNA expression predicted shorter progression-free survival (P < .05).
Conclusions:
Circulating tumor cells with high-level fibronectin 1 expression was associated with poor survival in patients with nasopharyngeal carcinoma and could be an independent prognostic factor for nasopharyngeal carcinoma.
Keywords
Introduction
Nasopharyngeal carcinoma (NPC) is a neck and head cancer. While the incidence rate is very low worldwide, it is high in the Southeast Asia including Guangdong, Taiwan, and Hong Kong, 1 with 2 to 3 cases per 10 000 people, accounting for approximately 18% of all cancers in this area. 2 Even though the cure of some patients with NPC can be achieved by radiotherapy at early stages, there is still a risk of local recurrence and distant metastasis. 3 In this content, a most recently reported multicenter clinical trial found that 3-year recurrence-free survival was 76.5% and overall survival at 3 years was 94.6% in the patients with NPC who received standard chemotherapy. 4
Although much technological progress has been made in cancer biology, the current diagnostic methods for NPC usually are incapable of detecting early stage NPC in many cases and prognosis of NPC is poor. To improve the treatment efficacy and patient survival, precision treatment through different treatment regiments for different individuals based on the molecular characteristics. 5 Notably, as a part of tumor precision treatment programs, circulating tumor cell (CTC)–based liquid biopsies could be used for evaluating the feature of patients with NPC timely. Circulating tumor cells detection in a patient may be a complement biomarker for monitoring the response to treatment, and even guide to select or adjust of the treatment options. Circulating tumor cells are believed to shed from a primary tumor into the vascular or lymphatic vessels and circulating around the body, 6,7 and CTCs are considered as a biomarker for predicting tumor progress and prognosis of various types of malignancies including prostate, lung, breast, as well as esophageal and colorectal cancers. 8,9 During preparation of this article, Qian et al has most recently reported that decrease in CTCs was correlated with therapeutic efficacy in patients with locally advanced NPC. 10
Fibronectin 1 (FN1) belongs to the ligand glycoprotein family, expressed in variety types of cells, and related to cell adhesion and migration. 11,12 Recent studies have found that FN1 overexpression is poor prognostic biomarker for the patients with head and neck cancer. 13 Moreover, FN1 could be a biomarker of resistance to radiotherapy in the patients with head and neck carcinoma of squamous cell, and FN1 is differentially expressed in the patients with ovarian cancer that was resistant to platinum chemotherapy drugs. 14 In addition, it has been reported that FN1-induced alterations in gene expression involve in the molecular mechanisms of cancer progression and that FN1 can upregulate the expression of matrix metalloproteinases, which play important role in promoting cancer cell local invasion and distant metastasis. 15 In colorectal cancer, FN1 downregulated P53 and suppressed apoptosis. 16 Importantly, overexpressed fibronectin in tissues obtained from patients with NPC were associated with advanced stage and shorter survival. 17 However, the prognostic value of FN1 expressed in CTCs derived from patients with NPC has not been investigated. In addition, CTCs, proposed as a driver in cancer spread and metastasis, have been demonstrated to have clinical prognostic value in variety kinds of cancers. However, the predictive value of CTCs in NPC remains to be determined. Aim of the current study was, therefore, to investigate whether the expression of FN1 in CTCs has prognostic value in NPC.
Here, we evaluated the prognostic as well as predictive value of 3 different phenotypes of CTC (epithelial, mesenchymal, and biphenotypic) and the expression level of FN1 in CTCs (non, low, high) isolated from the patients with NPC. To accomplish this, CanPatrol CTC enrichment technique 18 was used to characterize CTC phenotypes in the peripheral blood samples obtained from patients with NPC, and messenger RNA (mRNA) in situ hybridization (ISH) was carried out to detect FN1 expression in the CTCs. Correlation between the number and types of CTCs, as well as the FN1 expression levels and progression-free survival (PFS) of NPC, was also analyzed.
Materials and Methods
Patients, Blood Collection, and CTC Isolation
The current study was approved by the Ethical Committee of Affiliated Hospital of Guangdong Medical College (approval no. YJ2019-063-01). All experiments were performed following the guidelines and regulations of the institutional review boards of Affiliated Hospital of Guangdong Medical College. All patients provided written informed consent prior to enrollment in the study. A total of 179 patients with NPC, who were in stage I to IV and hospitalized in the Affiliated Hospital of Guangdong Medical College from July 2015 to December 2018, were enrolled into this study.
A total of 280 peripheral blood samples were collected from the patients with NPC. Specifically, to avoid potential skin cell contamination from the venipuncture, the first 2-mL blood was discarded and followed by collecting 5-mL blood, which was anticoagulated with EDTA. All blood samples were collected before (75 blood samples from 75 patients) or during chemotherapy or radiotherapy treatment (179 blood samples from 179 patients) and processed within 4 hours after collection.
Isolation of CTCs by Size Through a Filtration
A calibrated membrane with 8-µm diameter pores (Millipore, Billerica, Massachusetts) was used for filtration. Briefly, a filtration tube containing the membrane (SurExam, Guangzhou, China), a manifold vacuum plate with valve settings (SurExam), an E-Z 96 vacuum manifold (Omega, Norcross, Georgia), and a vacuum pump (Auto Science, Tianjin, China) were used to setup the filtration system. Blood sample (5 mL) was collected with EDTA followed by mixing with a red blood cell lysis buffer (154 mM NH4Cl, 10 mM KHCO3, and 0.1 mM EDTA [all from Sigma, St. Louis, Missouri] in deionized water) for 30 minutes at room temperature. The remaining cells were then harvested by centrifuge at 500g for 5 minutes followed by suspending with phosphate-buffered saline (PBS; Sigma) containing 4% formaldehyde (Sigma) and fixing for 8 minutes at room temperature. The cell suspension was filtered by vacuuming at 0.08 MPa. The CTCs were caught at the filtering membrane, which were further fixed with 4% formaldehyde for 1 hour at room temperature.
Definition and Identification of MCTC
Based on the epithelial–mesenchymal transition mRNA markers, the detected CTCs were classified into 3 phenotypes: epithelial, biphenotypic, and mesenchymal CTCs (MCTCs).
Tricolor RNA ISH Assay
Sequences of the probes used in the current study are listed in the Table 1 (capture probe sequences) and Table 2 (sequences of branched DNA [bDNA] signal amplification probes). All of the probes were synthesized by Invitrogen (Invitrogen, Shanghai, China).
Capture Probe Sequences of EPCAM, CK8/18/19, Vimentin, Twist, and CD45 Genes.

Sequences of the Branched Deoxyribonucleic Acid (bDNA) Signal Amplification Probes.a

a Function (copies) sequence (5′-3′) complement.
The RNA-ISH was performed with modification of the bDNA signal amplification technology. 19 Briefly, the CTCs on the filtration membrane were washed 3 times with PBS and treated with proteinase K (0.1 mg/mL) for 1 hour at room temperature. After washing 3 times, probes for epithelial biomarkers (EPACM, CK7/18/10, labeled with Alexa Fluor 594), mesenchymal biomarkers (vimentin and twist, labeled with Alexa Fluor 488), and white blood cell biomarker (CD45, labeled with Alexa Fluor 750) were applied and allowed to hybrid for 3 hours at 40°C. After washing 3 times with 0.1× SSC buffer (Sigma), CTCs were incubated with 0.5 fmol preamplification probes (sequences of the probes are shown in Table 2) in the preamplification buffer (30% horse serum, 1.5% sodium dodecyl sulfate, 3-mM Tris-HCl, pH 8.0) for 30 minutes at 40°C. After washing with 0.1× SSC buffer, CTCs were incubated with 1 fmol preamplification probes (sequences of the probes are shown in Table 2). After washing, nuclei were stained with 4′,6′-diamidino-2-phenylindole for 5 minutes. Cells were then observed and photographed under fluorescence microscope at ×100 magnifications.
Analysis of FN1 Expression
Fibronectin 1 expression in the CTC was evaluated with a multiplex mRNA-ISH. Briefly, in addition to the probes for EpCAM (Alexa Fluor 594, red color) and CD45 (Alexa Fluor 750, white color), a probe for FN1 labeled with Alexa Fluor 647 (purple color) were added in the process of hybridization. A purple fluorescent signal (Alexa fluor 647, purple dots ≥7) from the CTCs indicated FN1 expression. Patients with positive CTCs (≥1 CTCs in 5-mL blood) was considered to be eligible for FN1 expression analysis. Expression of FN1 mRNA was defined as following: (1) CTC without purple signal was defined as no FN1-expression; (2) 1-2 purple color CTCs were defined as low FN1-expression; (3) 3-9 purple color CTCs were defined as moderate FN1-expression; (4) ≥10 purple color CTC were defined as high FN1-expression. The FN1 expression results were assessed and analyzed by qualified pathologists using an automated imaging fluorescence microscope.
Clinical Follow-Up
Patients of the current study were followed up every 15 days for 1 year by reviewing the regular chart. Disease progression was assessed by the physicians, and the patient cohort was divided into 2 groups according to the Response Evaluation Criteria in Solid Tumors (RECIST): (1) nonprogressive disease (including complete responses, 20 partial response, 21 and stable disease categories) and (2) progressive disease. Progression-free survival was defined as the elapsed time from diagnosis to progression or censoring at last follow-up.
Statistical Analysis
The main end point of this study was to evaluate expression of the selected mRNAs in CTCs as prognostic biomarkers for PFS. Statistical analysis was carried out with SPSS version 22.0 software and GraphPad prism version 5 software. Independent correlations between 2 variables after adjustment for other variables were assessed using partial correlation analysis. Correlations between 2 variables were assessed by Spearman rank correlation test. Optimal CTC cutoff values for patients into favorable and unfavorable prognostic groups based on CTC counts were determined using receiver operating characteristic (ROC) curve analysis. Progression-free survival rates were calculated with Kaplan-Meier method, and survival rates were compared to the log rank test. Univariate and multivariate Cox regression intervals were used to evaluate associations between potential prognostic factors and PFS. Two-tailed statistical analysis was used, and P < .05 was considered as significant.
Results
Characteristics of the Participants and CTC
A total of 179 patients with NPC were enrolled into the current study. Characteristics of the patients and their CTC or MCTC positivity are listed in Tables 3 and 4. As shown in Table 3, total 75 blood samples were harvested from the patients with NPC before they were treated with chemotherapy or radiotherapy. Circulating tumor cells were positively found in 68 (91%) of the 75 patients with a median count of 5.00 CTCs (range 0-62 per 5-mL blood). After treatment (Table 4), the CTCs were detected in 156 (87.1%) of the 179 patients with a median count of 4.00 CTCs (range 0-51 per 5-mL blood). Similarly, MCTCs were positively found in 64 (85%) of the 75 patients with a median count of 4.00 CTCs (range 0-61 per 5-mL blood) before treatment (Table 3); the MCTCs were detected in 139 (77.7%) of the 179 patients with a median count of 3.00 CTCs (range 0-44 per 5-mL blood) after treatment (Table 4). The number of CTCs and MCTCs detected in the patients with NPC before treatment were significantly higher than that after treatment (Figure 1A and B, P < .01).
Baseline of the 75 Blood Samples Collected Before Treatments.a

Abbreviations: CTC, circulating tumor cells; MCTC, the CTC that were positive for mesenchymal biomarkers including biphenotypic CTC and mesenchymal CTC.
a Fisher exact test and Pearson χ2 test.
Features of the 179 Blood Samples Collected After Treatments.a

Abbreviations: CTCs, circulating tumor cells; MCTC, the CTC that were positive for mesenchymal biomarkers including bi-phenotypic CTC and mesenchymal CTC.
a Fisher exact test and Pearson χ2 test.

Comparison of CTC and MCTC number before and after treatment. Panel A: CTC number. Panel B: MCTC number. Vertical axes: positive CTC or MCTC number; horizontal axes: samples collected before and after treatment. CTC indicates circulating tumor cells; MCTC, the CTC that were positive for mesenchymal biomarkers including biphenotypic CTC and mesenchymal CTC.
Association of CTC Number, Phenotype, and Patient Characteristics
Univariate analysis on the CTC phenotype and characteristics of the patients are also listed in Tables 3 and 4. The results showed that CTC positivity was not significantly associated with any of the patients’ characteristics before the treatment (P > .05 in all cases; Table 3) or after the treatment (Table 4). However, the total number of CTCs and MCTCs (mesenchymal and biphenotypical CTCs) were significantly higher in the late TNM stage (IV) compared to that in early TNM stage (I+II+III, P < .05, Figure 2). The median CTC number in patients with advanced stage NPC (stage IV) was 4.0, which was higher than that in patients with stages I, II and III (3.5). In addition, the median MCTC number was 3 in patients with stage IV, whereas, the median MCTC number was 2 in patients with stages I, II, and III.
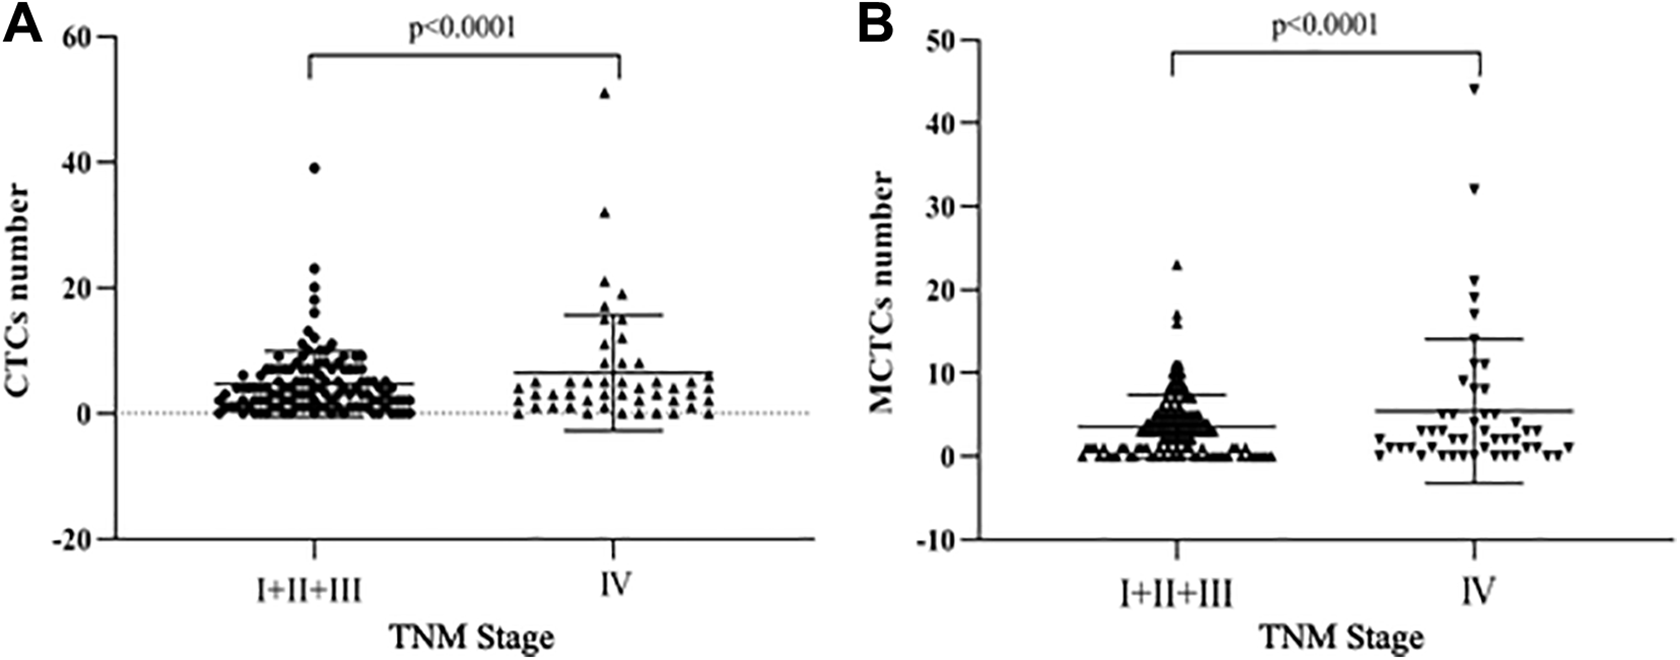
Comparison of CTC and MCTC number in early and late TNM stages. Panel A: CTC number. Panel B: MCTC number. Vertical axes: positive CTC or MCTC number; horizontal axes: TNM stages. CTC indicates circulating tumor cells; MCTC, the CTC that were positive for mesenchymal biomarkers including bi-phenotypic CTC and mesenchymal CTC.
Associations of FN1 Expression in CTCs and Patients’ Characteristics
Blood samples (5 mL) were collected from 68 patients with positive CTC before treatment and 156 patients with positive CTCs after treatments. Of them, 68 pretreatment samples (Table 5) and 149 posttreatment samples (Table 6) were eligible for FN1 analysis. Of the tested samples, 62 (91.2%) of pretreatment samples and 128 (86%) of posttreatment samples positively expressed FN1. Furthermore, FN1 expressed in all 3 CTC phenotypic groups with 66.6% (572/859) positivity. Of them, 47.4% (92/194) were expressed in the epithelial CTCs and 72.2% (480/665) were in the both biphenotypic and MCTCs. The associations between FN1 expression status and patients’ characteristics are listed in Table 5 (pretreatment) and Table 6 (posttreatment). Fibronectin 1 expression status was not significantly associated with age, gender, smoking, or metastasis status (P > .05 in all cases; Tables 5 and 6). However, the number of CTC expressing FN1 gene was higher in patients with stage IV compared to that of patients with stages I, II, and III, although the difference was not statistically significant (Figure 3, P = .09).
Fibronectin 1 Expression Analysis in the Patients with NPC With Positive CTCs in the 75 Blood Samples of Pretreatment.

Abbreviations: CTC, circulating tumor cells; NPC, nasopharyngeal carcinoma.
Fibronectin 1 Expression Analysis in the NPC Patients With Positive CTCs in the 149 Blood Samples of Posttreatment.

Abbreviations: CTCs, circulating tumor cells; NPC, nasopharyngeal carcinoma.
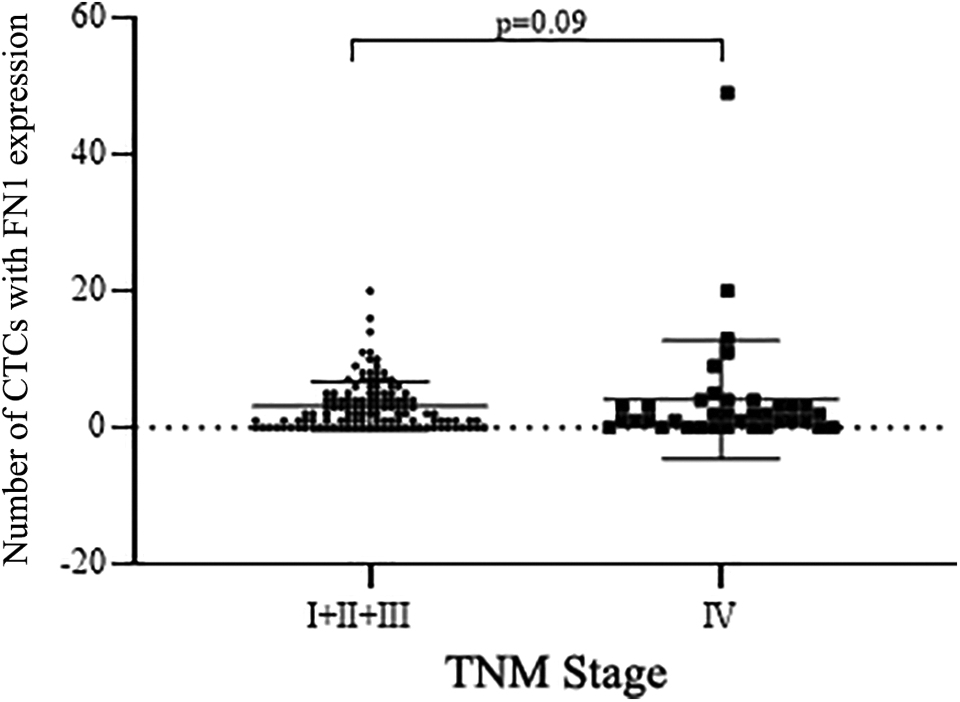
Comparison of FN1-positive CTC number in early and late TNM stage. Vertical axis: Number of CTC with positive FN1 expression; horizontal axis: TNM stages. CTC indicates circulating tumor cells; FN1, fibronectin 1.
Association of Therapy, CTC Number, FN1 Expression Status, and Survival
A total of 104 patients were followed up 1 to 12 months (median, 4.5 months) using RECIST disease assessment. Of them, 84 (80.8%) were progressive cancer and 20 (19.2%) were nonprogressive cancer. We also assessed associations between 3 different therapies (chemotherapy, radiotherapy, chemoradiotherapy), CTC phenotype, or FN1 expression and disease progress status during follow-up. An optimal threshold cutoff of 9 CTCs per 5 mL was determined using ROC curve analysis (data not shown) and the survival analysis was performed with Kaplan-Meier curves. As expected, the presence of >9 CTCs or >5 MCTCs per 5-mL blood exhibited a poorer PFS than those with ≤9 CTCs or ≤5 MCTCs (P = .020 and .023, respectively, Figure 4A and B). Prognostic potential of FN1 for PFS was analyzed by Kaplan–Meier survival analysis. As shown in Figure 4C, patients with ≥2 MCTCs and high-level FN1 expression had poorer PFS than those with <2 MCTCs and high-level FN1 expression (P = .007, Figure 4C). Moreover, patients treated with chemoradiotherapy had better PFS than those treated with radiotherapy alone (P = .006, Figure 4D) or chemotherapy alone (P = .00003, Figure 4D), and PFS of radiotherapy alone was better than that of chemotherapy alone (P = .040, Figure 4D). Furthermore, multivariate Cox regression analysis showed that only the number of MCTC with highly expressed FN1 could be an independent prognostic factor for PFS (P = .006, Table 7). In addition, patients treated with chemoradiotherapy had better PFS compared to those treated with chemotherapy alone (P = .0001, Table 7).
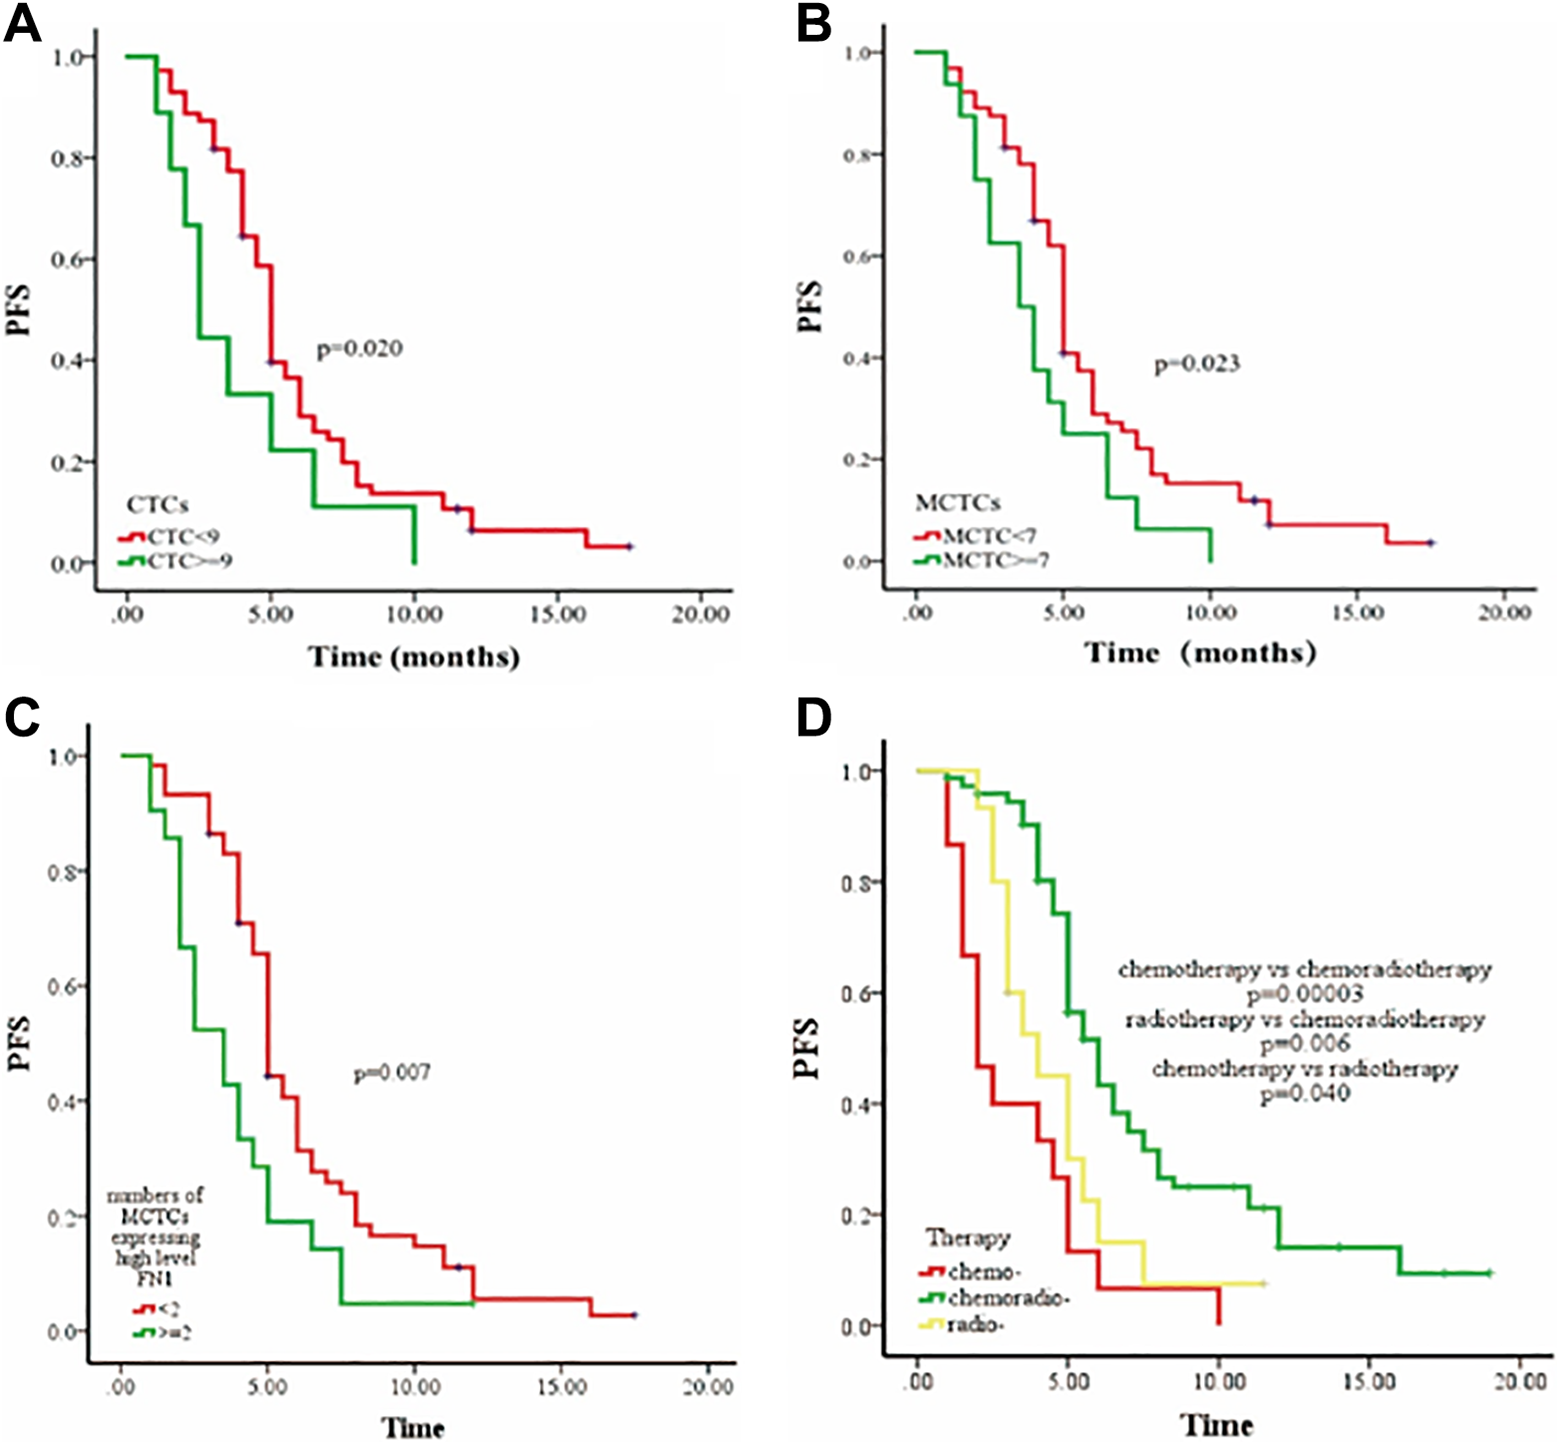
Kaplan-Meier curves for progression-free survival (PFS) in patients with NPC. Panel A: PFS rate in the group of patients with CTC <9 versus ≥9. Panel B: PFS rate in the group of patients with MCTC <7 versus ≥7. Panel C: PFS rate in the group of patients with positive MCTC expressing FN1 <2 versus ≥2. Panel D: PFS rate in the group of patients with chemotherapy alone or radiotherapy alone versus chemoradiotherapy. Vertical axes: progress-free survival (PFS); horizontal axes: time (months).
Multivariate Cox Regression Analysis of CTCs, FN1 Expression, and Patient Survival.

Abbreviations: CI, confidence interval; CTC, circulating tumor cell; FN1, fibronectin 1; HR, hazard radio; MCTC, mesenchymal CTCs; PFS, progression-free survival.
Discussion
Recently, new techniques such as CanPatrol CTC enrichment have attracted increasing attention on the CTC phenotypes in blood samples, which appears to contribute to the progress of disease. 22,23 In the current study, CanPatrol CTC-enrichment technique was applied to isolate and analyze CTCs in patients with NPC and CTC was detected in majority of the patients with NPC. Furthermore, analysis on the phenotypes of CTC and their association with NPC patients’ survival and prognosis was found that patients with >9 CTC or >5 mesenchymal-type CTC showed poor survival rate and that high expression of FN1 in the CTC indicated poor prognosis.
Several studies have indicated that CTC counts were intimately associated with characteristics of various types of cancers. 20,24,25 In this regard, CTC has been defined as a cancer hallmark by American Society of Clinical Oncology in 2007, which can be used to detect lesions in early stage in patients without cancer symptoms. 26,27 Here, we explored the clinical significance of CTC number and phenotypes of CTCs in NPC. We found that the number of CTC and mesenchymal phenotype of CTC (MCTC) were significantly reduced after treatment in the patients with NPC compared to that before treatment group. In addition, the number of CTC and MCTC were higher in patients with stage IV than those with stages I, II, and III. Patients with the presence of >9 CTCs or >5 MCTCs per 5-mL blood revealed a poorer PFS than those with ≤9 CTCs or ≤5 MCTCs.
Fibronectin 1 is known as a differentially unregulated gene in NPC that plays an important role in the development of NPC. Thus, FN1 is potentially considered as a therapeutic target of NPC. It has been reported that expression of fibronectin in the renal cell carcinoma was predictive for early systemic progression. 28 Expression of fibronectin in the invasive breast cancer was also correlated with adverse clinical outcomes of the patients. 29 Given the roles of fibronectin in risk stratification, using bDNA signal amplification technology, we explored fibronectin expression status in CTCs obtained from blood samples and its associations with clinical and pathological variables and survival in patients with NPC.
The bDNA signal amplification technology is different from the conventional PCR assay in that it does not rely on the sequence of amplified target as PCR does. Specifically, after direct binding of capture probes to the target sequences, signal on a bDNA probe was amplified and detected. 19 This bDNA signal amplification technique includes capture of target sequences by multiple specific probes (known as capture probes) followed by conjugation of the target to the bDNA signal amplification probes. The bDNA signal amplification probes consist of 3 types of probes, that is, the preamplifier sequence, the amplifier sequence, and the label probe. The preamplifier sequence is designed to bind to contiguous regions on the capture probes, and the other regions on the preamplifier sequence are designed to hybridize to multiple bDNA amplifier sequences so that a branched structure is created. In the current study, using this bDNA signal amplification technology, expression of FN1 in the CTCs was examined. It was found that the fibronectin expression in CTCs correlated with advanced stage and shorter survival and that the numbers of the total CTC and MCTC with high expression of FN1 were higher in patients with stage IV compared to the patients with stages I, II, and III. Furthermore, we found that the patients with ≥2 MCTCs and expression of high-level FN1 had a poorer PFS than those with <2 MCTCs and expression of high-level FN1. These findings suggested that the FN1 expression increased with the development of disease and that fibronectin might be a prognostic biomarker in NPC.
Patients with NPC were usually at late stages when they were diagnosed, and radiotherapy was a recommended treatment for these patients. 30 However, only 30% to 50% of these patients treated with radiotherapy could survive for 5 years. 31 While the immune checkpoint inhibitor such as the anti-PD-1 antibody (nivolumab) could be a novel treatment for recurrent or metastatic NPC, 21,32 the combination of chemotherapy and radiotherapy was proposed to be an effective therapy to improve the survival status of patients with NPC. 33 Consistently, the current study demonstrated that patients treated with chemoradiotherapy were found to exhibit a better PFS than those treated with radiotherapy alone, and these 2 groups both better than those treated with chemotherapy alone.
Conclusions
The current study demonstrated that higher numbers of total CTC or MCTC, or MCTC with high-level FN1 expression were correlated with advanced stages of NPC and a poor survival in patients with NPC. Multivariate analysis revealed a significant correlation between the number of MCTC with high-level FN1 expression and patients’ survival. In addition, the number of MCTC with high-level FN1 expression (>2) might be an independent prognostic factor for patients with NPC having poor PFS. Findings of the current study also indicated that combined chemoradiotherapy was better than either chemotherapy or radiotherapy alone for the NPC treatment.
Footnotes
Authors’ Note
Ying Yu, Zhi-Xiu Lin, and Hai-Wen Li contributed equally to this article. This study was approved by the ethical committee of Affiliated Hospital of Guangdong Medical College.
Declaration of Conflicting Interests
The author(s) declared no potential conflicts of interest with respect to the research, authorship, and/or publication of this article.
Funding
The author(s) received no financial support for the research, authorship, and/or publication of this article.