
Abstract
Purpose:
To evaluate the magnitude of interobserver variability in pretreatment image registration for lung stereotactic body radiation therapy patients in aggregate and within 3 clinical subgroups and to determine methods to identify patients expected to demonstrate larger variability.
Methods and Materials:
Retrospective image registration was performed for the first and last treatment fraction for 10 lung stereotactic body radiation therapy patients by 16 individual observers (5 physicians, 6 physicists, and 5 therapists). Registration translation values were compared within and between subgroups overall and between the first and the last fractions. Four metrics were evaluated as possible predictors for large interobserver variability.
Results:
The mean 3-dimensional displacement vector for all patients over all comparisons was 2.4 ± 1.8 mm. Three patients had mean 3-dimensional vector differences >3 mm. This cohort of patients showed a significant interfraction difference in variance (P value = .01), increasing from first fraction to last. A significant difference in interobserver variability was observed between physicians and physicists (P value < .01) and therapists and physicists (P value < .01) but not between physicians and therapists (P value = .07). Three of the 4 quantities evaluated as potential predictive metrics showed statistical correlation with increased interobserver variation, including target excursion and local target/lung contrast.
Conclusion:
Variability in pretreatment image guidance represents an important treatment consideration, particularly for stereotactic body radiation therapy, which employs small margins and a small number of treatment fractions. As a result of the data presented here, we have initiated weekly “registration rounds” to familiarize all staff physicians with the target and normal anatomy for each stereotactic body radiation therapy patient and minimize interobserver variations in image registration prior to treatment. The metrics shown here are capable of identifying patients for which large interobserver variations would be anticipated. These metrics may be used in the future to develop thresholds for additional interventions to mitigate registration variations.
Introduction
Stereotactic body radiation therapy (SBRT), also known as stereotactic ablative radiotherapy, is a radiotherapy technique that leverages image guidance and precision radiation delivery systems to achieve highly conformal ablative doses of radiation in target volumes, most commonly tumors in the lung and liver. This technique requires precise target delineation, mapping of the target during respiration, and small planning target volume (PTV) margins. Pretreatment image guidance immediately prior to delivery is a critical step in this process.
Our institutional policy requires physician and physicist presence at the treatment unit to perform registration and image guidance. In a busy department, it may not be the same physician/physicist team present for each of the typically 3 to 5 treatment sessions. Variation in image registration based on technique and target interpretation bias could in theory lead to inconsistent registration. It has been shown that for lung cancer, significant interobserver variability can occur in delineation of target, 1 -5 and the process of target identification in image registration may be prone to similar variations. In addition, changes in regional lung density may also occur over the course of therapy leading to differences in target and nontarget electron densities not present on the original planning scan, 6 further confounding this process.
As part of a quality assurance initiative for our institution, we sought to evaluate interobserver consistency in image registration to quantify any differences that might exist and to identify patient factors that might predict suboptimal consistency in pretreatment image registration. Although Sweeney et al have evaluated accuracy and interobserver variability of 3-dimensional (3D) versus 4-dimensional (4D) cone beam computed tomography (CBCT) based image guided radiotherapy (IGRT) for lung SBRT, 7 our study includes additional clinical subgroups, identifies characteristics of the patient’s tumor and normal anatomy that may be predictive of larger interobserver variations, and describes an intervention designed to mitigate the potential uncertainties in treatment resulting from large interobserver variations in image registration.
Methods and Materials
A retrospective image registration study was conducted on 10 patients with early-stage primary nonsmall cell lung cancer treated with image-guided SBRT on tomotherapy (Accuray, Sunnyvale, California). The location and GTV0 volume, corresponding to the size of the gross tumor volume (GTV) on the reconstructed 4-dimensional computed tomography (4DCT) 0% inhalation phase image, for each patient are provided in Table 1.
Patient Target Characteristics.a
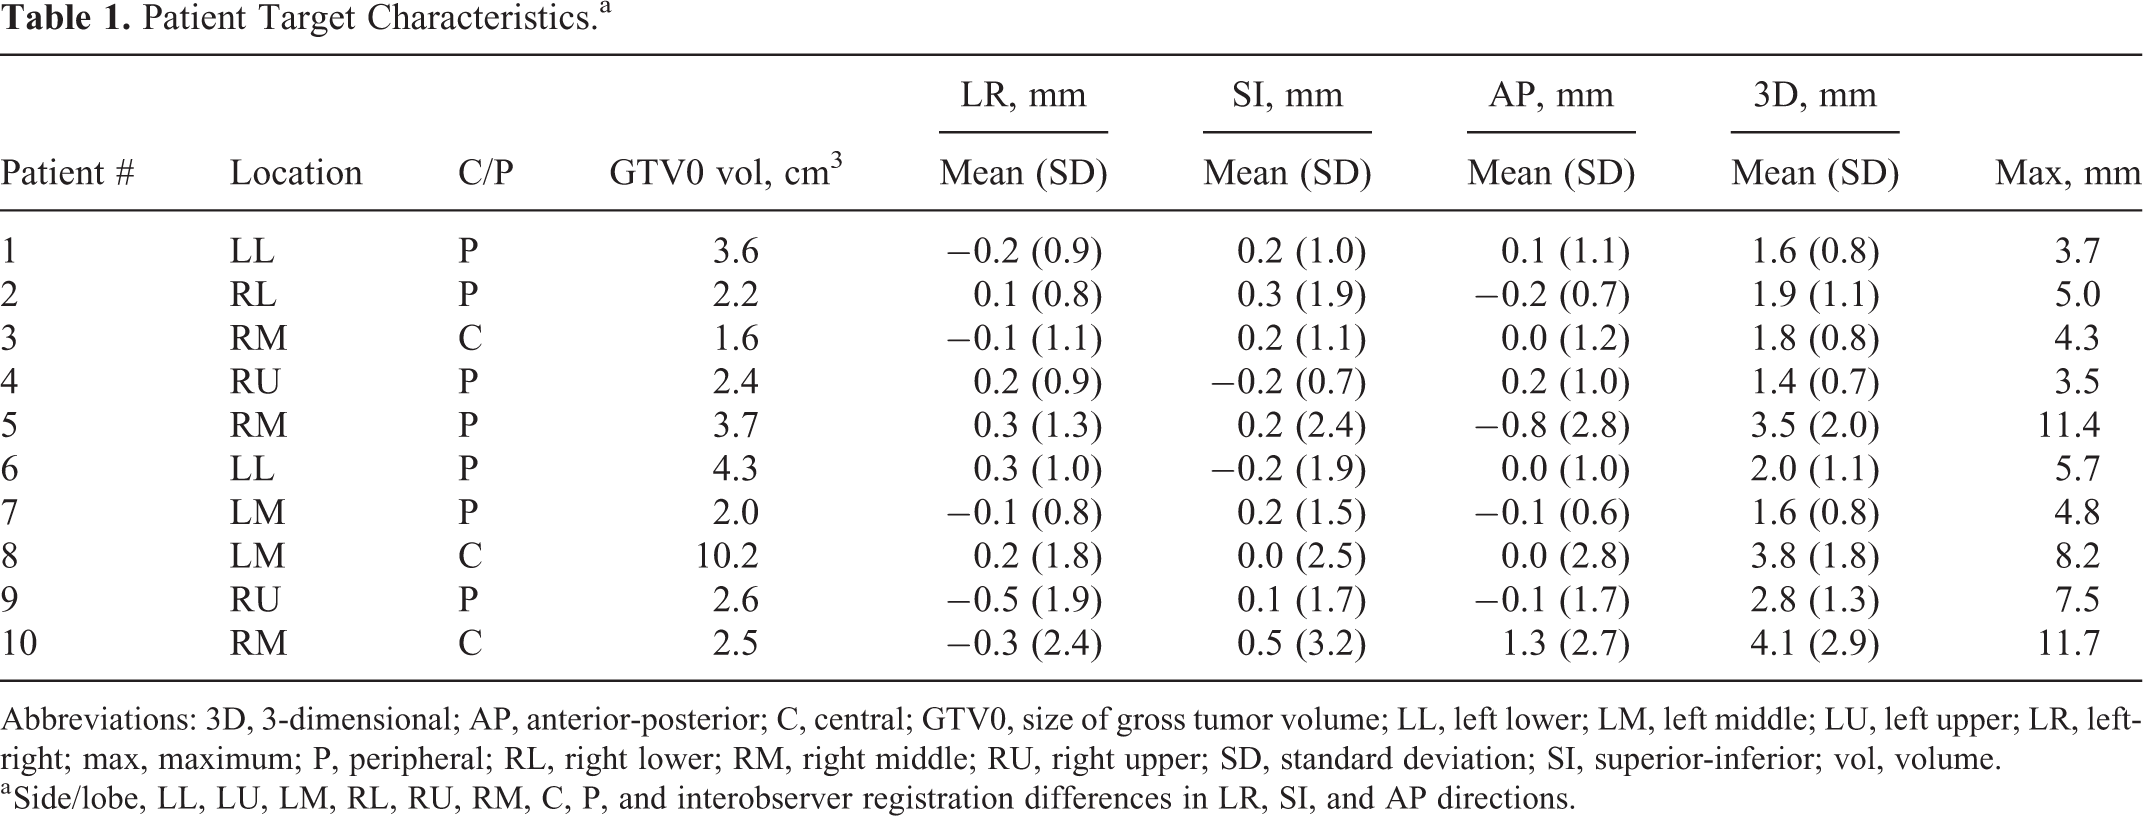
Abbreviations: 3D, 3-dimensional; AP, anterior-posterior; C, central; GTV0, size of gross tumor volume; LL, left lower; LM, left middle; LU, left upper; LR, left-right; max, maximum; P, peripheral; RL, right lower; RM, right middle; RU, right upper; SD, standard deviation; SI, superior-inferior; vol, volume.
a Side/lobe, LL, LU, LM, RL, RU, RM, C, P, and interobserver registration differences in LR, SI, and AP directions.
Clinical Simulation, Planning, and Delivery
Free-breathing (FB; kVp = 120 kV, mA·s = 275, slice thickness = 1.5 mm) and respiration-correlated 4DCT (kVp = 120 kV, mA·s = 1000, slice thickness = 1.5 mm) scans were acquired for each patient with a Somatom Sensation Open helical computed tomography (CT) scanner (Siemens Medical Solutions, Germany), using an Anzai belt for respiratory signal acquisition. All 4DCT acquisitions were reconstructed into 10 phases (0% inhalation to 100% inhalation in 20% increments along the inhale and exhale directions) with image quality evaluated by a physicist. Patients were immobilized using a dedicated SBRT immobilization system (Body Pro-Lok, Civco Radiotherapy, Orange City, Iowa), and abdominal compression was used for all patients with a tumor excursion of >5 mm appreciated on 4DCT. The 4DCT acquisitions were exported to the Eclipse v11 treatment planning system (Varian Medical Systems, Palo Alto, California) to aid the physician in the creation of an internal target volume (ITV) based on the union of the GTV delineated on all 10 phases. A PTV was created by expanding the ITV uniformly by a 5-mm margin. Required organs at risk (OAR) were contoured, and the structure set and FB-CT, used for dose calculation, were exported to tomotherapy (Accuray) for creation of the treatment plan. Prior to each treatment, a megavoltage CT (MVCT) was acquired using tomotherapy’s on-board imaging system (3.5 MV, slice thickness = 2 mm). To minimize image acquisition time, the field of view was selected to include the superior–inferior length of the PTV plus an additional 2 to 5 slice margin at each end.
Image Registration and Comparison
Using the daily MVCT acquisitions, a total of 16 observers made up of 5 physicians, 5 therapists, and 6 physicists, independently registered the 10 patient cases retrospectively for first and last fractions. All observers had substantial prior clinical experience with IGRT registration on the tomotherapy treatment unit. For all registrations, the observer started at shift positions determined by an automatic bone-to-bone match algorithm between the acquired MVCT and the planning CT. Manual adjustments in the lateral, longitudinal, and vertical directions were made if necessary using the MVCT image and ITV and PTV contours. Roll corrections identified by the automatic match algorithm were applied and were not changed during the manual registration process in order to allow direct comparison of all translational shifts. These shifts were performed retrospectively and therefore not subject to typical clinical time pressures; however, observers were asked to register them in a manner similar to clinical practice. Observers were allowed to choose their own Hounsfield unit (HU) window and leveling.
Shift values for each observer’s registration was compared to any other observer giving a total of 120 distinct intercomparisons per patient per fraction (as identified in the equation below). For example, observer 1 was compared to 15 other observers, leaving observer 2 with 14 new distinct comparisons, observer 3 with 13 new distinct comparisons, and so forth.

Lateral, longitudinal, and vertical standard deviation of the difference comparisons were used as a measure of interobserver variability for a single direction, while mean 3D vector difference and the 95% confidence width of 3D vector difference were used as quantitative measures of overall variation. The 3D vector difference was calculated based on the following, for a given observer i compared to observer j.
The aforementioned quantities were evaluated for first fraction, last fraction, and both fraction comparisons per patient.
Identification of Predictive Metrics
Four metrics were evaluated as possible predictors of higher interobserver variability based on the CT simulation data and were named and defined as follows: (1) “Target excursion” was defined as the ITV volume − GTV0 volume. The GTV0 corresponds to the contour of GTV identified on the end-of-exhalation 4DCT phase where breathing motion is smallest. Consequently, ITV volume − GTV0 volume represents the available excursion space for the target. (2) “Local target contrast 1” was defined by the overlap of the HU distributions for target and surrounding normal lung and provides a measure of local contrast within the vicinity of the target. (3) “Local target contrast 2” was defined as the difference in the HU distributions for target and surrounding normal lung. (4) “Target density variability” was defined by the GTV HU standard deviation, which provides a method to evaluate the diffusive appearance of a target. For metrics (2) and (3), the target characteristics were defined within the GTV0 contour, and the surrounding lung characteristics were defined within a modified PTV. The modified PTV, named PTV* here, was defined as the original PTV contour − the GTV0 contour and any surrounding solid normal tissue, such as chest wall and great vessels easily discernable on MVCT. The GTV0 contour and PTV* contour were exported to 3DSlicer (https://www.slicer.org/) along with the 4DCT image associated with GTV0. Mean HU and the standard deviation of HU within each contour’s mesh were then determined. Under the assumption that each structure’s HU distribution closely resembles a normal distribution, the area of overlap between the 2 distributions is determined using the statistical programming language R (https://www.r-project.org/). Therefore, metric (2) quantifies the overlap area in these distributions, and metric (3) is defined as mean GTV0 HU − mean PTV* HU and provides a similar contrast evaluation metric.
Statistical Analysis
Fisher F test was performed for the comparison of interfraction differences in interobserver variability, as determined by testing for equivalence of variance, for each patient and overall registrations. In addition, the test was repeated to check for differences in interobserver variability between the subgroups. For cases that statistically verified true differences in variance, Welch t test was used to test for mean equivalency, while for cases where difference in variance was not verified, the Student t test was used. All tests were considered significant for P < .05.
Results
Interobserver Variability in the Patient Registrations
Interobserver variability was quantified by evaluating the standard deviation of the 240 interobserver comparisons per patient for each displacement direction (left-right [LR], superior-inferior [SI], anterior-posterior [AP]) and by the mean difference for the 3D displacement vector. The mean differences averaged over all comparisons (n = 2400) were 0.0 ± 1.4 mm, 0.1 ± 1.9 mm, 0.0 ± 1.8 mm, and 2.4 ± 1.8 mm for the lateral, longitudinal, vertical, and 3D displacement vector, respectively. Of the 2400 interobserver differences, only 0.2%, 1.4%, and 1.3% were greater than 5 mm in the lateral, longitudinal, or vertical directions, respectively. If considering an outlier as a data point more than 1.5 interquartile ranges below the first quartile or above the third quartile, a total of 77 outliers of the 2400 interobserver differences exist. Of these 77 outliers, 13, 16, and 39 (88.3% total) belong to patient’s 5, 8 and 10, respectively. Individual patient results for each displacement direction, mean 3D displacement vector, and maximum 3D vector difference are summarized in Table 1.The largest registration variation occurred most frequently in the AP direction (5/10), followed by the SI direction (4/10), and lastly LR direction (1/10). Interobserver registration uncertainty for each patient is illustrated in Figure 1. In agreement with the outliers seen when considering all interobserver differences, patients 5, 8, and 10 clearly display the greatest observable variation. As identified in Table 1, these 3 patients also are the only patients to have mean 3D vector variability larger than 3 mm. Conversely, patient 4 has the smallest average 3D vector and standard deviation. To visually illustrate differences in interobserver variability, Figure 2 shows a histogram of observed 3D vector differences for patients 4 and 10.

Box and whisker plot identifying the first and third quartiles (box) and minimum and maximum differences (whiskers) for each patient.

Differential histogram of interobserver 3D vector differences for patients 4 and 10. 3D indicates 3-dimensional.
Interobserver Variability of the Patient Registrations between Fractions
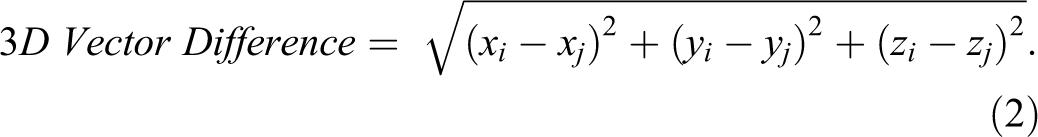
First fraction to last fraction interobserver variability was compared for all interobserver differences for all patients. The cohort was found to show a significant interfraction difference in variance based on Fisher F test (P value = .012). Mean 3D vector differences averaged over all patients were 2.3 ± 1.7 mm and 2.6 ± 1.8 mm for the first and last fractions, respectively, and the mean difference in mean values was found to be significant (P < .01). For first fraction registrations, 16.0% and 8.4% of 3D vector interobserver differences were between 3 and 5 mm and greater than 5 mm, respectively. In comparison, 20.0% and 9.1% of differences were within these ranges for last fraction registrations. Of the 7 patients who showed a statistically significant difference in variance between first and last fractions, all but 1 showed an increase in variability from beginning to end of treatment. Mean differences in interfraction 3D vector difference across all observers are presented in Table 2 along with their standard deviations for all patients. Figure 3 provides an illustrative example of the interfraction change in the interobserver difference distribution for 1 patient.
Mean Interobserver, Interfraction Differences (Δ) and Lower (LCL) and Upper (UCL) 95% Confidence Limits For Each Observer Subgroup.

Abbreviation: SD, standard deviation.
Interobserver differences for first and last fractions for patient 2 measured in mm.
Interobserver Variability of the Patient Registrations between subgroups
Patient registrations were performed by 5 physicians, 6 physicists, and 5 therapists. Each member of each subgroup were compared to all other members within a given subgroup to arrive at 10, 15, and 10 distinct intercomparisons, respectively. The upper and lower boundaries of the 95% confidence interval for each patient and subgroup are shown in Table 2. Only 3 patients, 5, 8 and 10, had a single upper confidence limit greater than 5 mm for any single subgroup. These same patients had a 95% confidence width greater than 3.7 mm for all groups combined. When all patients are grouped together, a significant difference in interobserver variability is observed between subgroups, specifically between physicians and physicists (P value < .01) and therapists and physicists (P value < .01). No significant difference was found between physicians and therapists (P value = .07).
Metrics for Prediction of Interobserver Variability
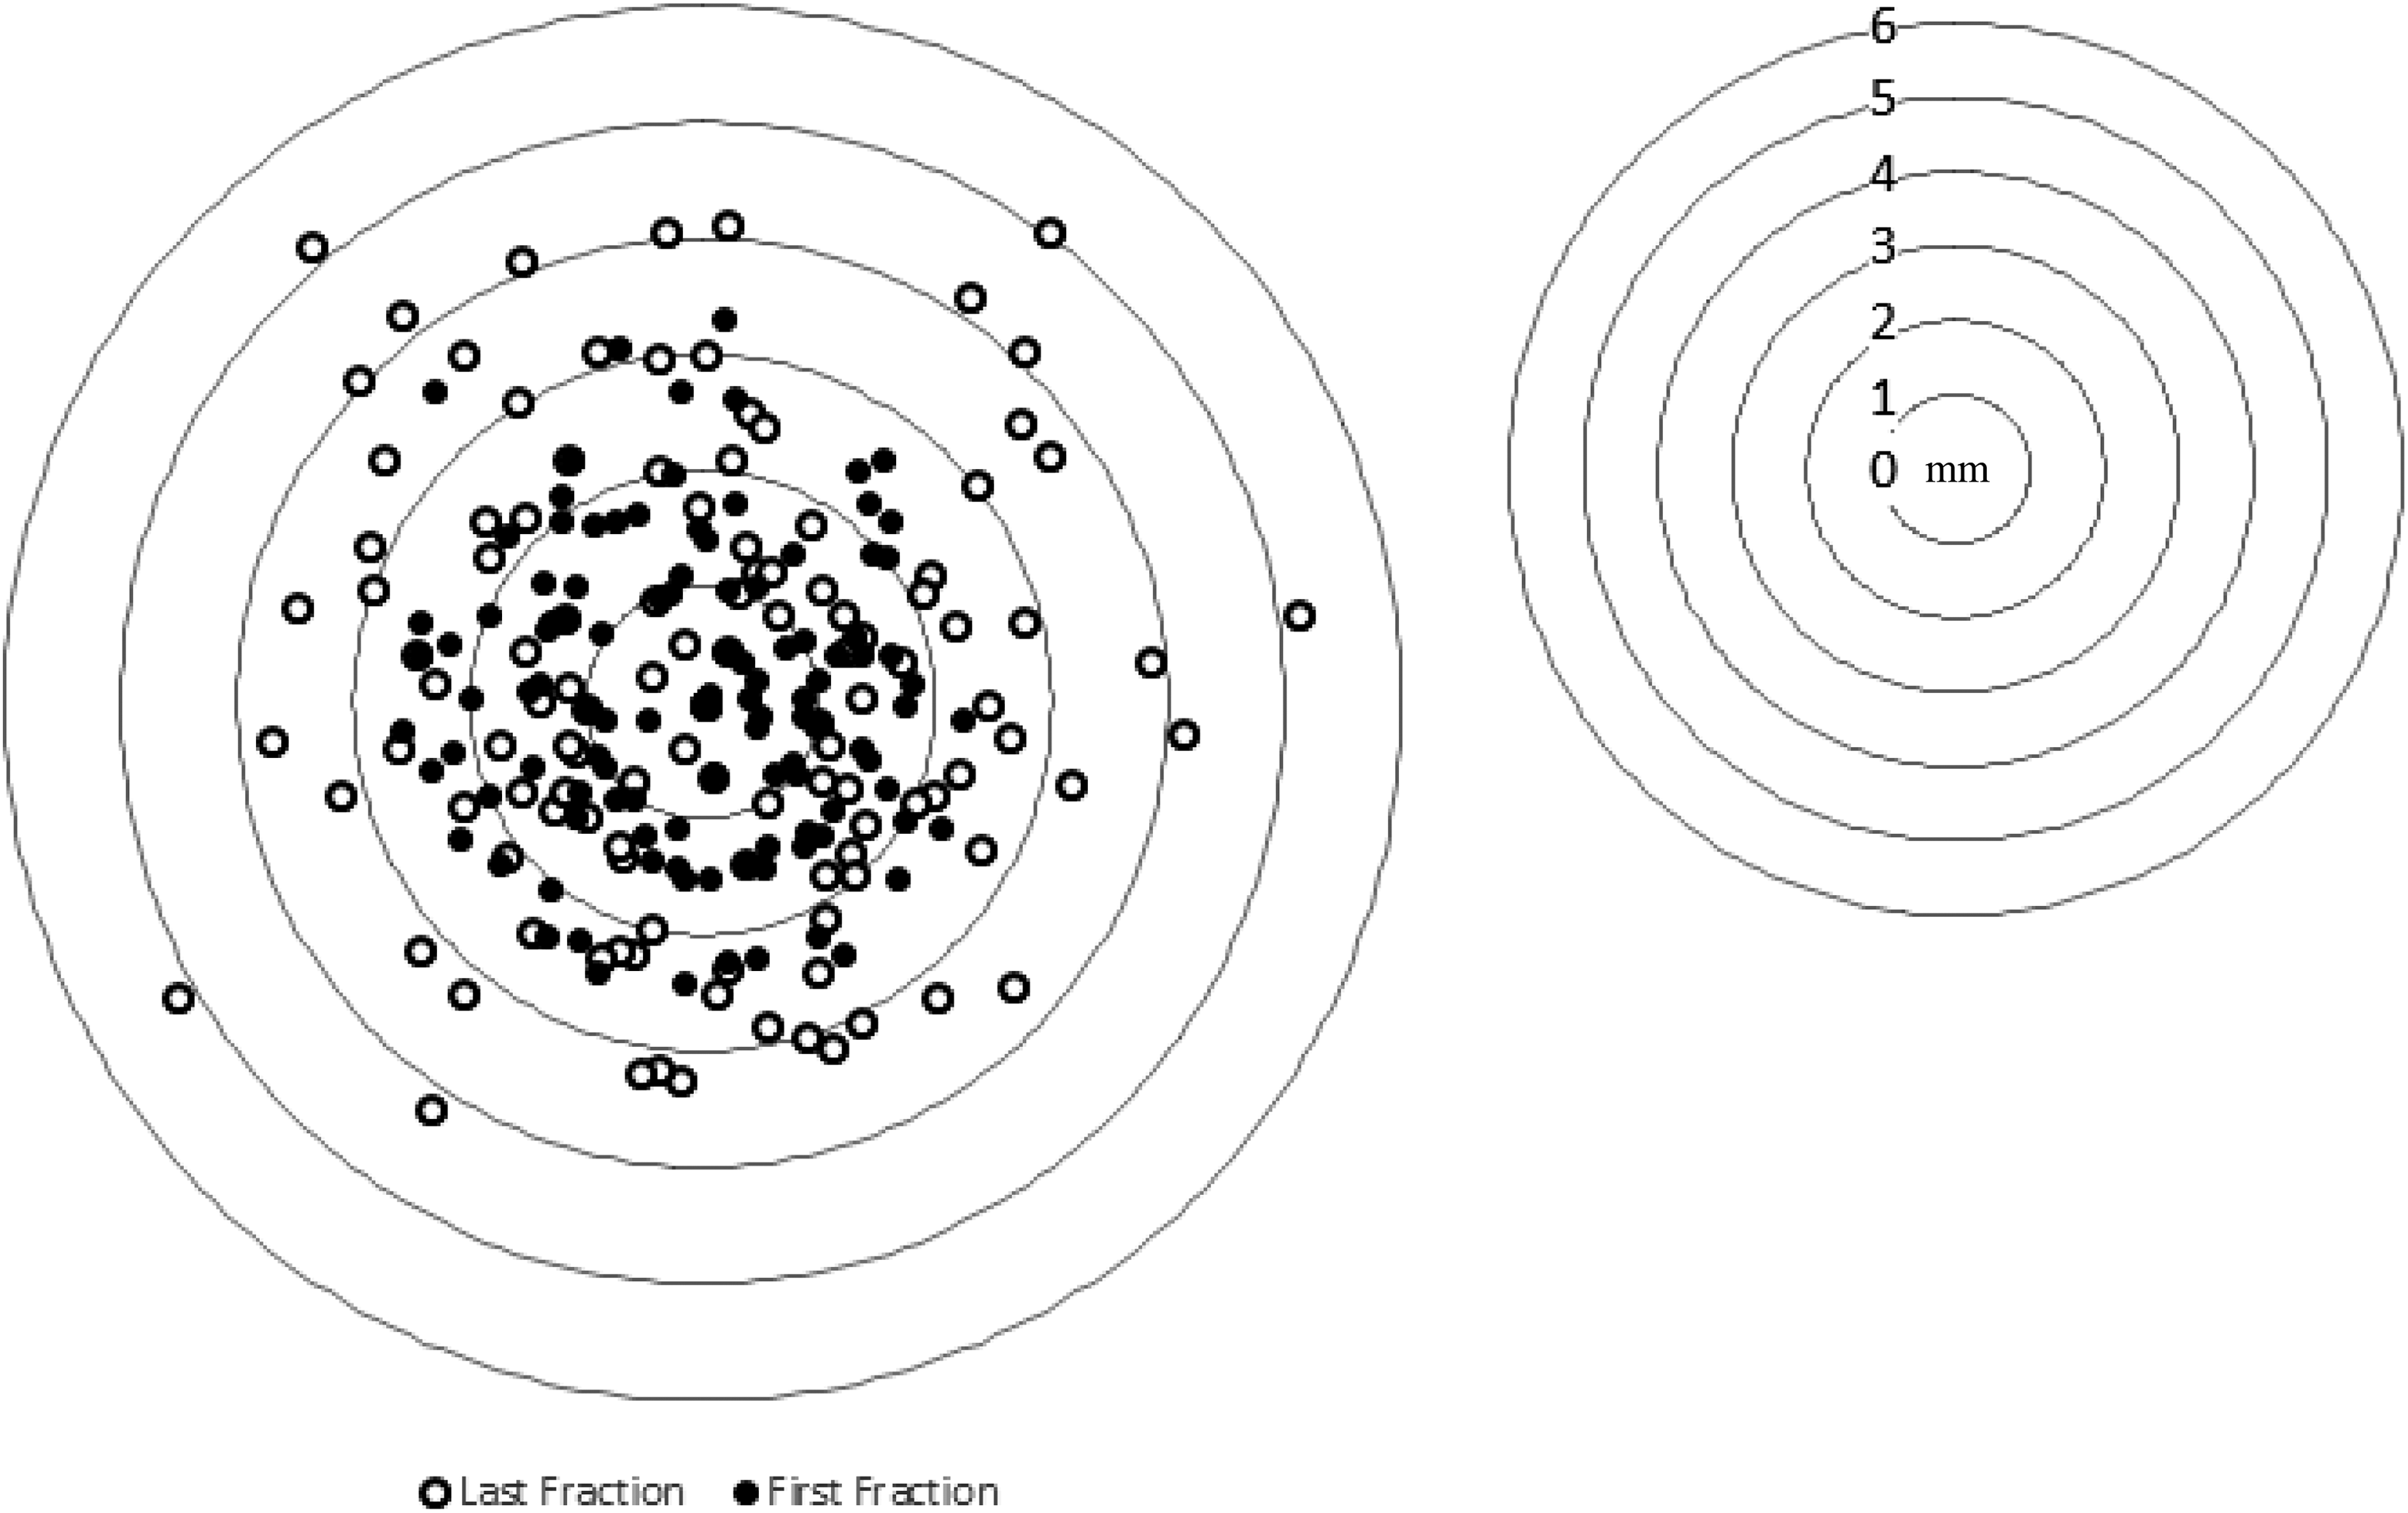
Results from the investigation of metrics to identify characteristics of patients susceptible to larger interobserver registration variability are summarized in Table 3. For “target excursion” (metric [1]), a correlation in linear regression analysis between ITV − GTV0 volume and mean 3D vector difference was observed for both first fraction (r 2 = .51) and last fraction (r 2 = .39). For “local target contrast” (metrics [2] and [3]), one significant outlier was identified with respect to local contrast HU distribution. Compared to all other patients, this outlier has a mean PTV* − GTV0 HU value beyond 2 standard deviations from the mean of all patients. Further investigation revealed this was primarily due to a very large HU value for normal lung. Upon removal of this outlier, mean HU difference between PTV* − GTV0 and GTV0 (r 2 = .56 − first fraction and r 2 = .56 − last fraction) and area overlap (r 2 = 0.48 − first fraction and r 2 = 0.40 − last fraction) were correlated with mean 3D vector difference. The HU histograms were normalized to be normal distributions with density such that the area under the curve is 1 using the function “dnorm” is R (https://www.r-project.org/). Area of overlap ranges from 0 to 1 with 1 referring to equivalent mean and standard deviation and 0 representing the situation of the 2 distributions not having a single similar HU value. Larger area of overlap means worse local contrast. For “target density variability” (metric [4], mean 3D vector difference did not show a significant correlation with GTV HU standard deviation. To visually illustrate relative differences in target and normal tissue characteristics and one of the statistically correlated metrics, we show coronal slices of patients 4 and 8 along with the respective target and surrounding normal lung HU distributions (metric [2)]) in Figure 4.
Target and Local Surrounding Patient Anatomy Characteristics.

Abbreviations: GTV0, size of gross tumor volume; HU, Hounsfield unit; ITV, internal target volume; PTV*, modified planning target volume.
4DCT of 0% IN phase and MVCT of patient’s 4 and 8 with GTV0 (red) and ITV (green) along with respective HU distribution for target (black) and local contrast (red). The overlapped region between the 2 HU histograms is shaded blue. 4DCT indicates 4-dimensional computed tomography; GTV indicates gross tumor volume; GTV0, size of the GTV; HU, IN, inhalation; ITV, internal target volume; HU, Hounsfield unit; MVCT, megavoltage computed tomography.
Discussion
Significant interobserver variability in image registration for this cohort of lung SBRT patients was observed, and the magnitudes of the mean and maximum 3D displacement vectors shown in Table 1 highlight this variability. The PTV is intended to account for all geometric variations and inaccuracies to assure that the CTV receives the prescription dose. Our data suggest that differences in image registration between individual clinicians should be considered within such evaluations of treatment uncertainties. The potential magnitude of these variations in image registration reinforces the importance of the presence of the physician during the image guidance process as recommended by the American College of Radiology- and the American Society for Radiation Oncology (ACR-ASTRO) guidelines for SBRT. 8 One might also anticipate that the presence of multiple individuals observing the registration (physician, physicist, and therapist) could result in a more reproducible registration with less variation. Guckenberger et al evaluated interobserver variability in the registration of lung SBRT patients using CBCT and found a similar 3D vector displacement of 2.3 ± 1.1 mm. However, this study included only 2 observers. 9 Similarly, Oechsner et al evaluated interobserver variability among 4 observers in the registration of lung SBRT patients using 4 different reference CT data sets. They found a mean 3D difference of 1.5 ± 0.7 mm. 10 However, both of these studies included only physician observers.
It is interesting to note that there was no statistically significant difference in interobserver variability between the therapists and the physicians in this study. A similar observation was noted in the work by Sweeney et al. 7 Thus, one might not expect any difference in registration between a physician accepting or modifying an initial registration attempt by the therapist and the physician performing the entire registration from image acquisition. Interobserver variability among the group of physicists was very small, and this was an important contributing factor to the statistical significance of the differences between physicists and other groups. Significant differences may have existed between subgroups in the amount of time spent on each registration, and this could also have contributed to these intergroup differences. Although we did not record and report registration times, our group anecdotally noted that physicists spent more time on average per registration. This could in part explain the smaller standard deviation among the physicists.
Prior to this study, our departmental policy required the treating attending physician to perform image registration for their own patients whenever possible to avoid any interobserver differences. In instances requiring cross-coverage, however, an alternative, designated physician would be required to perform the registration. Since it is not possible to eliminate instances of cross-coverage in the future, our group recommended and implemented weekly “registration rounds” within which patient history, image data, and treatment planning contours are presented. This takes place directly after our weekly chart rounds and serves as an opportunity for all physicians and physicists who might potentially participate in image registration for these patients to familiarize themselves with the targets and surrounding anatomy. Our departmental policy requires that therapists, physicians, and physicists all participate in the IGRT registration process for each SBRT patient. Results from this study emphasize the value of the participation of all groups. One additional potential solution to account for these registration uncertainties would be to increase the setup margin included in the PTV. We intend to reevaluate our data again following this intervention and consider increases in setup margin depending on the magnitude of the remaining registration uncertainties. If one were to increase the setup margin to account for registration uncertainties, a non-ITV encompassing method such as gating, tracking, or deep-inhalation breath hold might alternatively be used to reduce the effects of irradiating more normal lung when increasing such margin. Depending on the pretreatment verification method used to align the patient to the treatment isocenter, such aforementioned techniques may result in an improvement in registration uncertainty. As determined by Sweeney et al, the use of 4D-CBCT for registration is likely to provide the largest improvement in decreasing registration uncertainty. 7
Three metrics presented here are predictive of increased interobserver variability and identify the cases with largest variability—patients 5, 8, and 10—in this cohort. Although these metrics appear to be successful in identifying patients at risk for high interobserver variability in image registration, we are currently presenting and reviewing all lung and liver SBRT cases during our weekly registration rounds. In the future, we intend to further evaluate one or more of these metrics to identify a threshold to select those patients at risk for larger registration uncertainties and implement additional mechanisms to reduce the potential variability. This may include rescheduling the patient to avoid cross-coverage when clinically feasible and oncologically reasonable. When an inappropriate clinical delay would result from rescheduling, off-line 1:1 “practice” registration using image data from previous fractions could be used to acclimate a physician to the patient’s anatomical and imaging characteristics in preparation for required cross-coverage.
Aside from differences in local contrast (metrics [2] and [3]) and tumor excursion (metric [1]), MVCT image quality may influence interobserver variability for a given patient registration. Specifically, motion-induced artifacts, especially if the target is moving in the lateral direction or at a breathing period of 5.0 seconds, may degrade the ability to perform automatic registration and in addition potentially increase interobserver variability. 11 -13 Consequently, not only does the magnitude of the tumor motion influence registration but so does the direction and period of such motion.
Shirai et al and Oechsner et al have demonstrated that the smallest registration differences when registering to an FB-CBCT are realized when using an average intensity projection (AIP) as the reference CT. 14,15 We believe this to be true for MVCT also if one is performing a true soft-tissue tumor to tumor match. It should be noted that, due to technical limitations, all registrations for this cohort of patients were performed using an FB-CT scan as the reference CT. Our clinical protocol first requires alignment to bone and carina of the trachea followed by the minimal shift to achieve complete containment of the target, as appreciated on MVCT, within the ITV. Potential improvements in the registration data presented here are possible through the use of an AIP as the reference image.
The significant interfraction difference in variance is intriguing and suggests that patients may become more difficult to accurately register as the treatment course progresses. This could be due to changes in tumor size or electron density in and around the tumor. Examples of radiographic changes resulting from lung SBRT have been previously demonstrated months after completion of treatment; however, 6,16,17 our data suggest that some changes may be evident even before the completion of treatment. Changes in breathing patterns over the course of therapy, such as those presented by Bissonnette et al, may also contribute to this observation. 18
Conclusion
Interobserver variability evaluated among 16 volunteers representing 3 clinical groups—physicians, physicists, and therapists—revealed 95% confidence widths in 3D vector variation greater than 3 mm for some patients. Variability in pretreatment image guidance represents an important treatment consideration, particularly for SBRT which employs small margins and a small number of treatment fractions. In response, we have initiated weekly “registration rounds” where patient history, image data, and treatment planning contours are presented for all SBRT cases. This provides an opportunity to familiarize all staff physicians with the target and normal anatomy for these patients and to minimize potential interobserver variations in image registration at time of treatment. Three metrics were shown here to be capable of identifying patients for which large interobserver variations would be anticipated. Such metrics may be used in the future to develop thresholds for additional interventions to mitigate these registration variations.
Footnotes
Declaration of Conflicting Interests
The author(s) declared no potential conflicts of interest with respect to the research, authorship, and/or publication of this article.
Funding
The author(s) received no financial support for the research, authorship, and/or publication of this article.