
Abstract
Purpose:
The aim of the in vivo dosimetry, during the fractionated radiation therapy, is the verification of the correct dose delivery to patient. Nowadays, in vivo dosimetry procedures for photon beams are based on the use of the electronic portal imaging device and dedicated software to elaborate electronic portal imaging device images.
Methods:
In total, 8474 in vivo dosimetry tests were carried out for 386 patients treated with 3-dimensional conformal radiotherapy, intensity-modulated radiotherapy, and volumetric modulated arc therapy techniques, using the SOFTDISO. SOFTDISO is a dedicated software that uses electronic portal imaging device images in order to (1) calculate the R index, that is, the ratio between daily reconstructed dose and the planned one at isocenter and (2) perform a γ-like analysis between the signals, S, of a reference electronic portal imaging device image and that obtained in a daily fraction. It supplies 2 indexes, the percentage γ% of points with γ < 1 and the mean γ value, γmean. In γ-like analysis, the pass criteria for the signals agreement ΔS% and distance to agreement Δd have been selected based on the clinical experience and technology used. The adopted tolerance levels for the 3 indexes were fixed in 0.95 ≤ R ≤ 1.05, γ% ≥ 90%, and γmean ≤ 0.5.
Results:
The results of R ratio, γ-like, and a visual inspection of these data reported on a monitor screen permitted to individuate 2 classes of errors (1) class 1 that included errors due to inadequate standard quality controls and (2) class 2, due to patient morphological changes. Depending on the technique and anatomical site, a maximum of 18% of tests had at least 1 index out of tolerance; once removed the causes of class-1 errors, almost all patients (except patients with 4 lung and 2 breast cancer treated with 3-dimensional conformal radiotherapy) presented mean indexes values (
Conclusions:
The in vivo dosimetry procedure with SOFTDISO resulted easily implementable, able to individuate errors with a limited workload.
Introduction
During radiotherapy treatment, dosimetric differences between planned and delivered doses can cause treatment failure. Generally an adequate quality control (QC) procedure, adopted in the radiotherapy centres, is able to alleviate dosimetric errors. However, during the fractionated dose delivery, the planned dose can be different from the prescribed one 1 generally due to inadequate QC. In extreme cases, an inadequate QC program has led to major incidents with severe complications for patients, as largely reported in the literature. 2 –6 The in vivo dosimetry (IVD) is strongly recommended by various organizations 7 -10 so that in some countries, IVD tests are required as a routine check to detect the causes of dosimetric errors. 11,12 Several researchers 13 -35 have implemented IVD systems to reconstruct the delivered dose to the patients using the amorphous silicon electronic portal imaging device (aSi-EPID) associated with the linear accelerator (LINAC). The results showed that aSi-EPIDs can be used to reconstruct the dose in single points, 2 dimensional (2D), and entire 3-dimensional (3-D) dose distribution.
One of the major issues for the application of an IVD procedure in clinical practice is high workload. A practical IVD procedure should (1) assure an acceptable workload, (2) examine an adequate number of patients tested every day, (3) provide a new IVD acquisition in the subsequent day to verify the efficacy of the adopted corrections.
The aim of the study was to test the feasibility of the IVD procedure, carried out with a practical software, to intercept and eventually correct the errors during the delivery in order to improve treatment reproducibility.
Materials and Methods
Linear Accelerator and Treatment Planning System
An Elekta Synergy Agility LINAC (Crawley, United Kingdom) with a 160 Multileaf Collimators (MLC) is operative at the University of Chieti, SS. Annunziata Hospital, to carry out 3-dimensional conformal radiotherapy (3-DCRT), intensity-modulated radiotherapy (IMRT), and volumetric modulated arc therapy (VMAT) radiotherapy (RT) treatments using 6 MV and 10 MV beams. The LINAC is equipped with a cone beam computed tomography (CBCT) scanner (version 5.18.0) and an Elekta IviewGT EPID, based on aSi panels XRD 1640 AL5 (PerkinElmer Optoelectronics, Fremont, California) operating as a 2-D photodiode array at the fixed Source-EPID of 159 cm. The sensitive layer of EPID consists of 1024 × 1024 pixels with a pitch of 400 μm, resulting in an active area of 409.6 × 409.6 mm2. The treatments were performed using a robotic couch (iBEAMevo, Elekta, Crawley, United Kingdom) for the automatic patient repositioning considering only translational displacements. All radiotherapy plans were carried out using Oncentra External Beam treatment planning system (TPS) v.4.3 (Nucletron BV, Veenendaal, the Netherlands). Dose calculation was performed using the collapsed cone convolution algorithm with inhomogeneity correction, using a cubic grid resolution of 2 mm.
Enrolled Patients
Table 1 reports the baseline characteristics of 386 patients treated with 3-DCRT, IMRT, and VMAT techniques for various anatomical treatment sites. For the 3 techniques, optimized patient setups were obtained by the CBCT images to correct eventual out-of-tolerance patient position. This setup was carried at first 3 treatment fractions and then once a week; exception for breast treatments with 3-DCRT, for which optimized patient setups were obtained by the comparison between 2 orthogonal megavoltage images (medial and lateral) and the digitally reconstructed radiographs (DRRs) images, at the first 3 treatment fractions and then once a week. In all other treatment sessions, daily patient setup was obtained by a current setup based on the laser beam alignment on the patient tattoos. For head neck (H&N) and brain treatments, thermoplastic masks were used to immobilize the patient during treatment.
Baseline Characteristics of 386 Patients Examined in Terms of Number of Anatomical Sites (n%) and Techniques Number N.
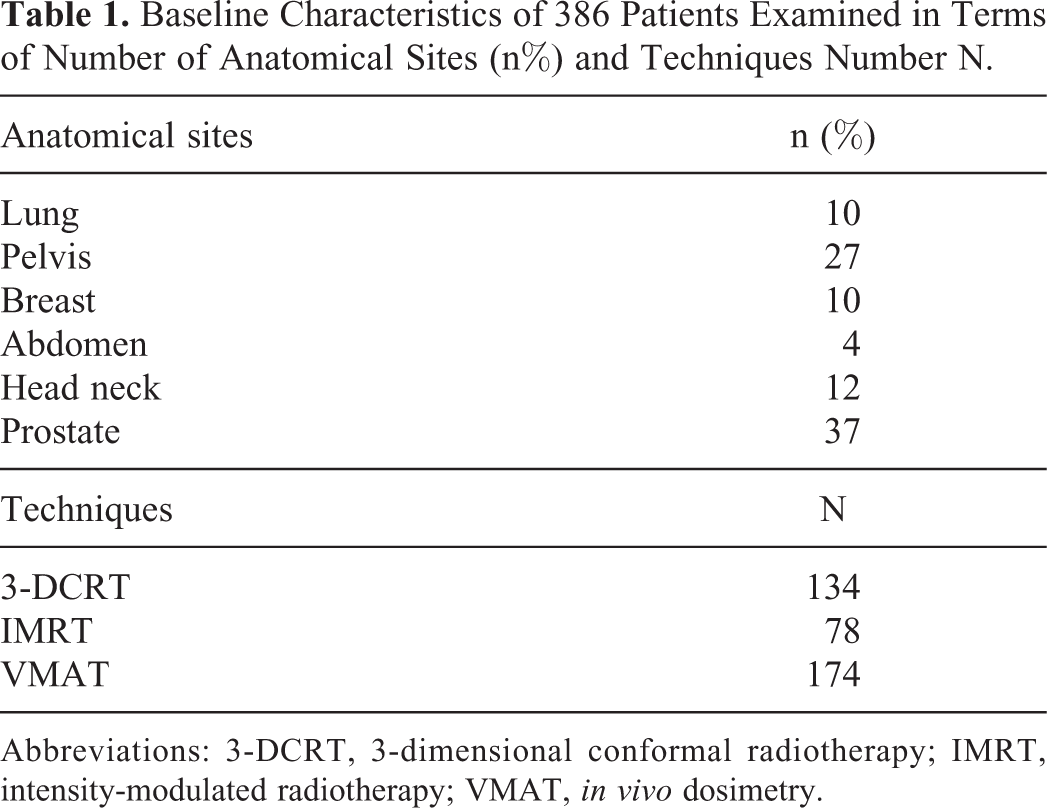
Abbreviations: 3-DCRT, 3-dimensional conformal radiotherapy; IMRT, intensity-modulated radiotherapy; VMAT, in vivo dosimetry.
Table 2 reports the maximum accepted variations in x, y, and z coordinates for all the techniques, indicated by a unique symbol ▵r. They are based on the optimized patient setup verification system (CBCT or EPID) and the complexity of the technique delivery and immobilization systems. In particular, the data reported in Table 2 take into account situations where the patient current setup reproducibility was difficult to reach.
Maximum Accepted Variations (Δr) for the Set-Up Reproducibility in All Techniques for Each Anatomical Site.a

Abbreviations: 3-DCRT, 3-dimensional conformal radiotherapy; IMRT, intensity-modulated radiotherapy; VMAT, in vivo dosimetry.
a The dashes stand for the techniques not used for each tumor site.
This study was carried out after informed consent had been given by the patients.
SOFTDISO Commissioning and Application
SOFTDISO is a dedicated software for IVD first developed by a National Italian Project 27 and then delivered by Best Medical Italy, Chianciano, Italy. It can be applied at 3-DCRT, IMRT, and VMAT techniques for different anatomical treatment sites. Its commissioning for LINAC equipped with aSi-EPID requires the following measurements for each beam quality:
The F and
SOFTDISO is interfaced with Oncentra TPS via Digital Imaging and COmmunications in Medicine. It uses computed tomography (CT) scans and the RTPlan to generate the patient radiological thicknesses, the beam geometry, and the isocenter dose by TPS (Diso, TPS), for each beam. The software is also directly interfaced with the IVIEWGT portal imaging system, and data are recorded in DICOM-RT files and stored in SOFTDISO.
The integral EPID image, referred to each single static or dynamic beam of the treatment fraction, is elaborated to determine: the R ratio between the reconstructed isocenter dose (Diso, EPID) by EPID image and that planned by TPS, Diso, TPS. In particular, Diso, EPID was determined as the average reconstructed dose values obtained from the points in ▵r side square area (around the beam central axis).The dose reconstruction algorithms for the 3 techniques used are reported in the literature,
27
-35
where the global accuracy for the R ratio is determined considering both the Diso, EPID accuracy (in inhomogeneous tissues estimated in 4%)
13,28–34
and the Diso, TPS accuracy (generally estimated well within 3%). The statistical propagation of the uncertainties supplies for R ratio index the tolerance level 0.95 ≤ R ≤ 1.05; γ-Like analysis which is the comparison between the EPID signal, S, of the reference image (after the optimized patient setup) and that of the EPID image measured with current patient setup. For the γ-like analysis, the methodological approach is the same as the γ-analysis.
38
However, γ-like analysis is based on signal discrepancies, while γ-analysis is carried out on the dosimetric discrepancies. The pass criteria for γ-like analysis were (1) distance to agreement Δd equal to Δr (Table 2), (2) signal agreement ΔS% selected from 3% to 5% depending on the presence of inhomogeneous tissues, technique used, and mobility of the irradiated organs.
35
For example, treatments in the presence of homogeneous tissues and thermoplastic mask in VMAT treatments, Δd = 3 mm and ΔS = 3% and Δd = 5 mm and ΔS = 5%, were used in the presence of inhomogeneous tissues and difficult reproducibility due to patient positioning. Tolerance levels were fixed for (1) the percentage γ% ≥ 90% (ie, the percentage of points with γ < 1 must be greater or equal to 90%) and (2) the mean of the γ values, γmean ≤ 0.5. High γmean index values indicated probably organ shifts that were more pronounced especially in the presence of different media, such as air/muscle (gas pockets in rectum), lung/muscle (presence of lung tumor regression or atelectasys), and bone/muscle (vertebras shift).
All the above reported threshold values were chosen in agreement to previous literature data. 14,28 -35
The cause of discrepancies was summarized in 2 classes: Class 1, that is, errors due to inadequate standard QC, as patient setup, presence of attenuators on the beam not included in TPS calculation (as some parts of the couch that could be intercepted by the beams) and incorrect data transfer; Class 2, that is, errors due to patient morphological changes such as tumor shrinkage, patient weight loss, atelectasis, and gas pockets that required specific controls during the treatment.
For each patient, IVD test supplied the results of R ratio, γ%, and γmean for every static or dynamic beam used in the treatment fraction. These tests were performed in the following 2 days after optimized patient setup in the first week of treatment, and then once a week after the current patient setup. The results of 3 indexes values (R, γ%, and γmean) were automatically stored in the SOFTDISO database. If one index resulted out of tolerance level (OTL; ie, R < 0.95 or R > 1.05, γ% < 90, and γmean > 0.5), it was indicated in red. Subsequently, an accurate analysis of OTL results on the monitor screen, as will be discussed talking about Figure 2 of the “Discussion” section, allowed to individuate 2 class of errors. These errors were analyzed by a medical physicist and successively by the radiation oncologist in order to find the adequate corrections to the discrepancies found; a new IVD test was performed to verify the efficacy of the adopted corrections the day after. For each treatment fraction, SOFTDISO supplies the mean values of R, γ%, and γmean for every patient. These mean values
About the workload, in our institute, 10 patients per day are subjected to IVD tests. Considering that EPID images processing and loading requires about 5 minutes, and the time necessary for visual inspection of OTL tests is of about 4 minutes for patient, and a maximum of 4 patients with OTL tests, the daily workload was observed to be about 20 minutes per day. An extra time could be necessary when the cause of the error is not immediately recognized.
Results
Of all, 8474 IVD tests were carried out for 386 patients. The IVD results obtained for 3-DCRT, IMRT, and VMAT techniques are summarized in Tables 3, 4, and 5, respectively. For each treatment anatomical site in the first column, the pass criteria ΔS% and Δd used are reported; in the second and third column, the numbers of patients, #P, and the IVD tests, #T, are reported; the other columns report for each index the percentages of patients (P) within tolerance
Results of IVD Tests for 3DCRT Techniques Applied to 4 Treatment Sites.a
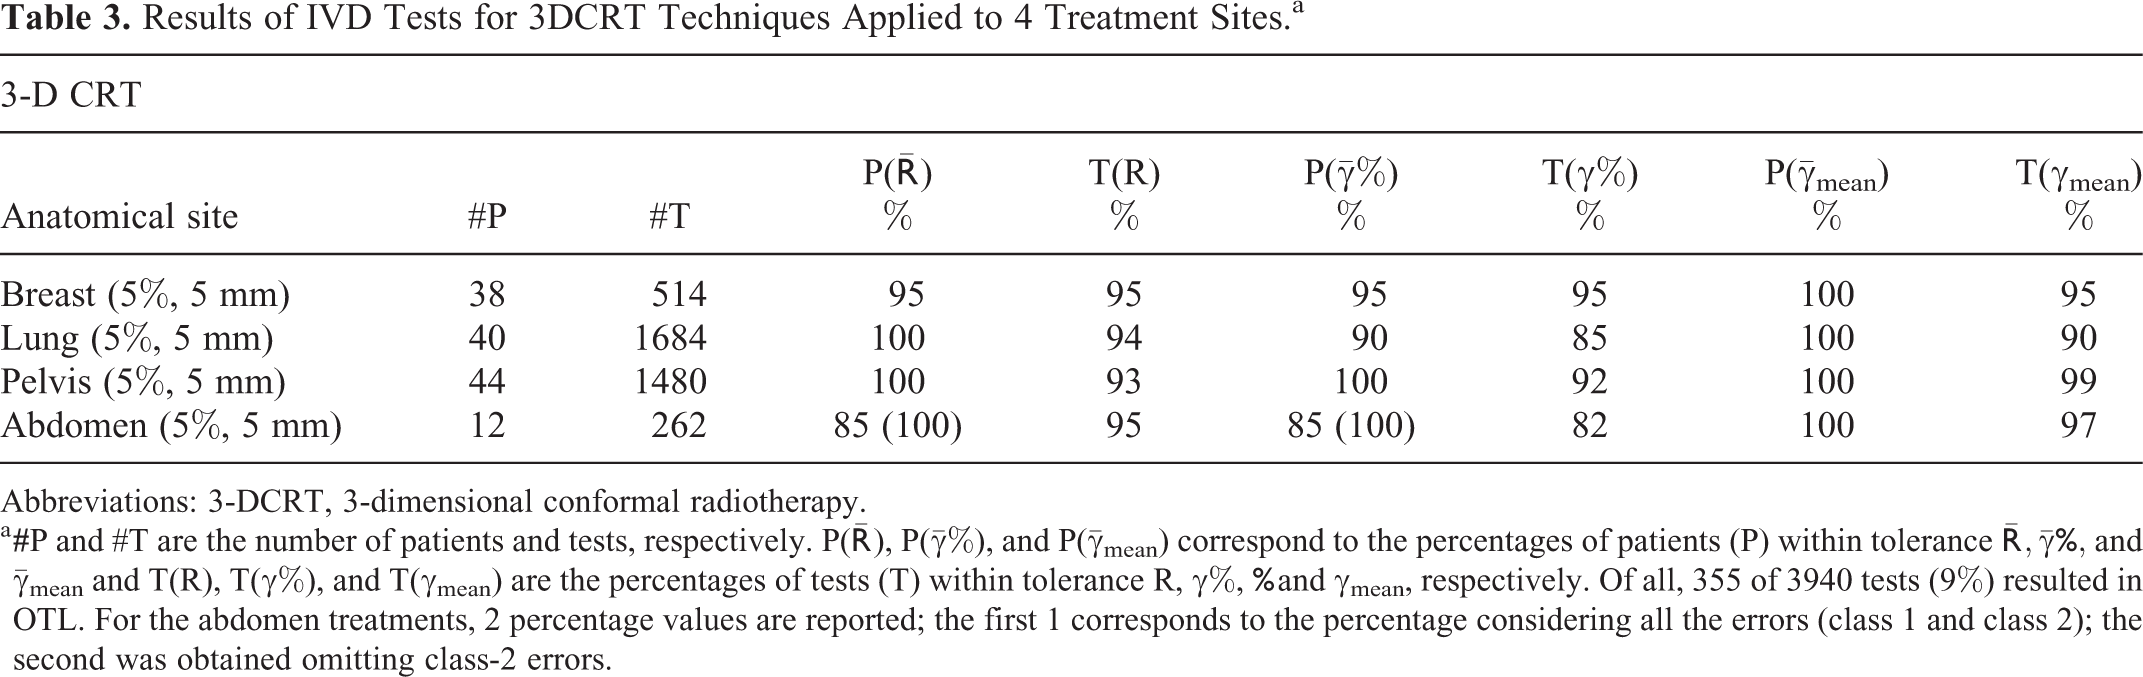
Abbreviations: 3-DCRT, 3-dimensional conformal radiotherapy.
a
Results of IVD Tests for IMRT Techniques Applied to 2 Anatomical Sites.a
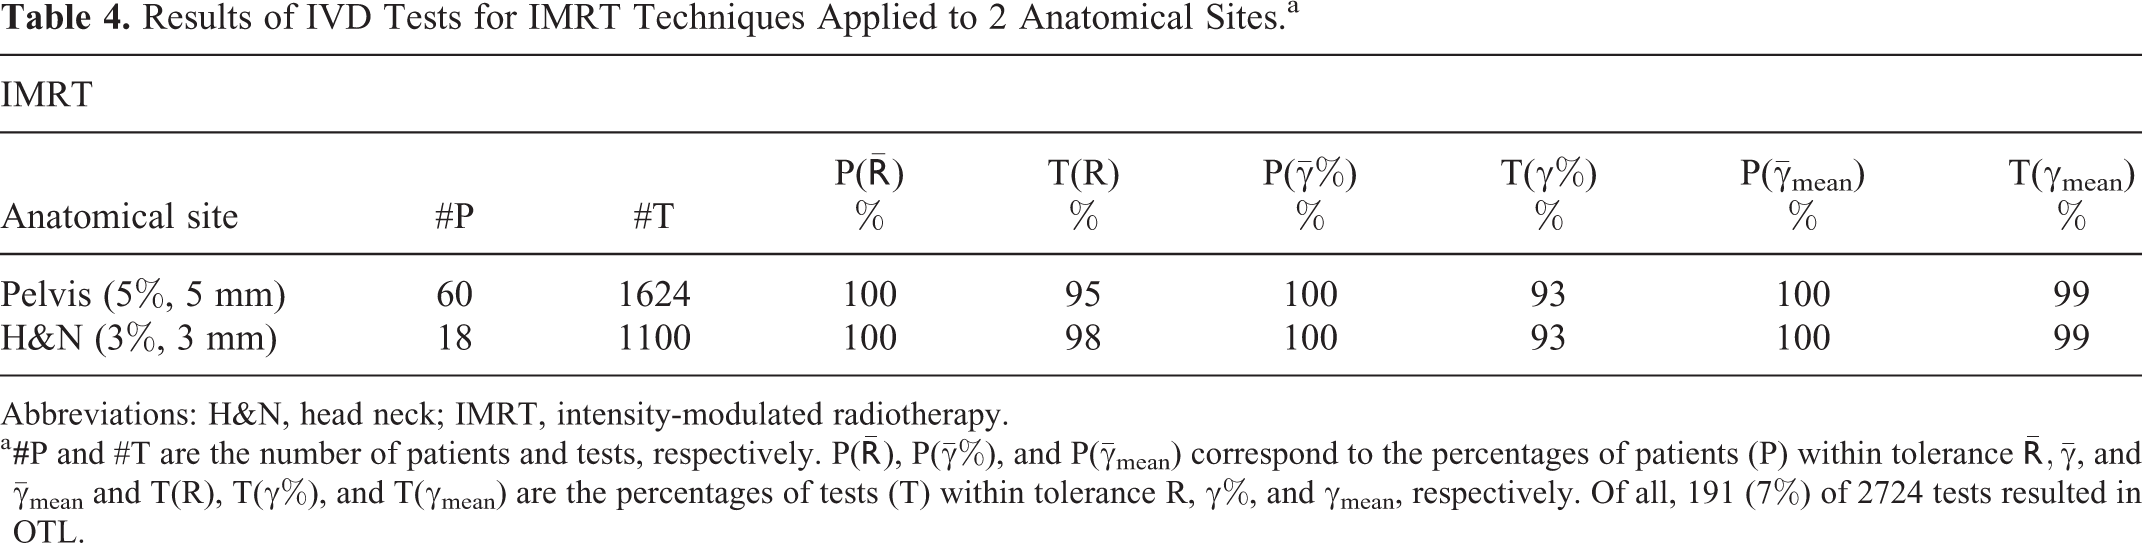
Abbreviations: H&N, head neck; IMRT, intensity-modulated radiotherapy.
a
Results of IVD Tests for VMAT Techniques Applied to 2 Anatomical Sites.a

Abbreviations: H&N, head neck; VMAT, volumetric modulated arc therapy.
a
In total, 444 of 3940 tests for the 3-DCRT techniques (about 11%) were in OTL. Two patients with pancreatic cancer (abdomen) and 2 patients with breast cancer presented
Only 2 lung treatments reported some OTL tests due to the presence of an attenuator (ie, the hooks of the couch extension intercepted some beams). Removing the couch extension, the tests presented values within the tolerances. Four patients with lung cancer showed OTL
Table 4 reports the results of 2724 tests for pelvis and H&N tumors treated with IMRT technique with 191 (7%) OTL tests . All patients showed P(
Table 5 reports the results of 1810 tests for prostate and H&N tumors treated with VMAT technique with 163 (9%) OTL tests. If class-2 errors were excluded, all patients showed P(
One patient with H&N cancer initially received RT delivery for PTV, and subsequently a boost dose of radiation was delivered using the same thermoplastic mask. At the first fraction of boost delivery, OTL test was observed due to weight loss causing an in-plane shift of patient setup. In this case, a new treatment CT simulation was acquired for the new plane using a new thermoplastic mask. The next IVD test showed in-tolerance index values.
Figure 1 shows histogram values of R ratios for all the 8474 tests corresponding to 386 patients studied in this work. The overall mean R ratio was equal to 1.004 (0.03), (1SD), and the dispersion of R ratios is quite symmetrical around 1 (Fisher skewness coefficient = 0.2, P < .0008). 39 The distributions of the 3 indexes (R, γ%, and γmean) resulted in good agreement with the results obtained by other researchers who developed similar software using the same tolerance levels. 16 -18,29–34
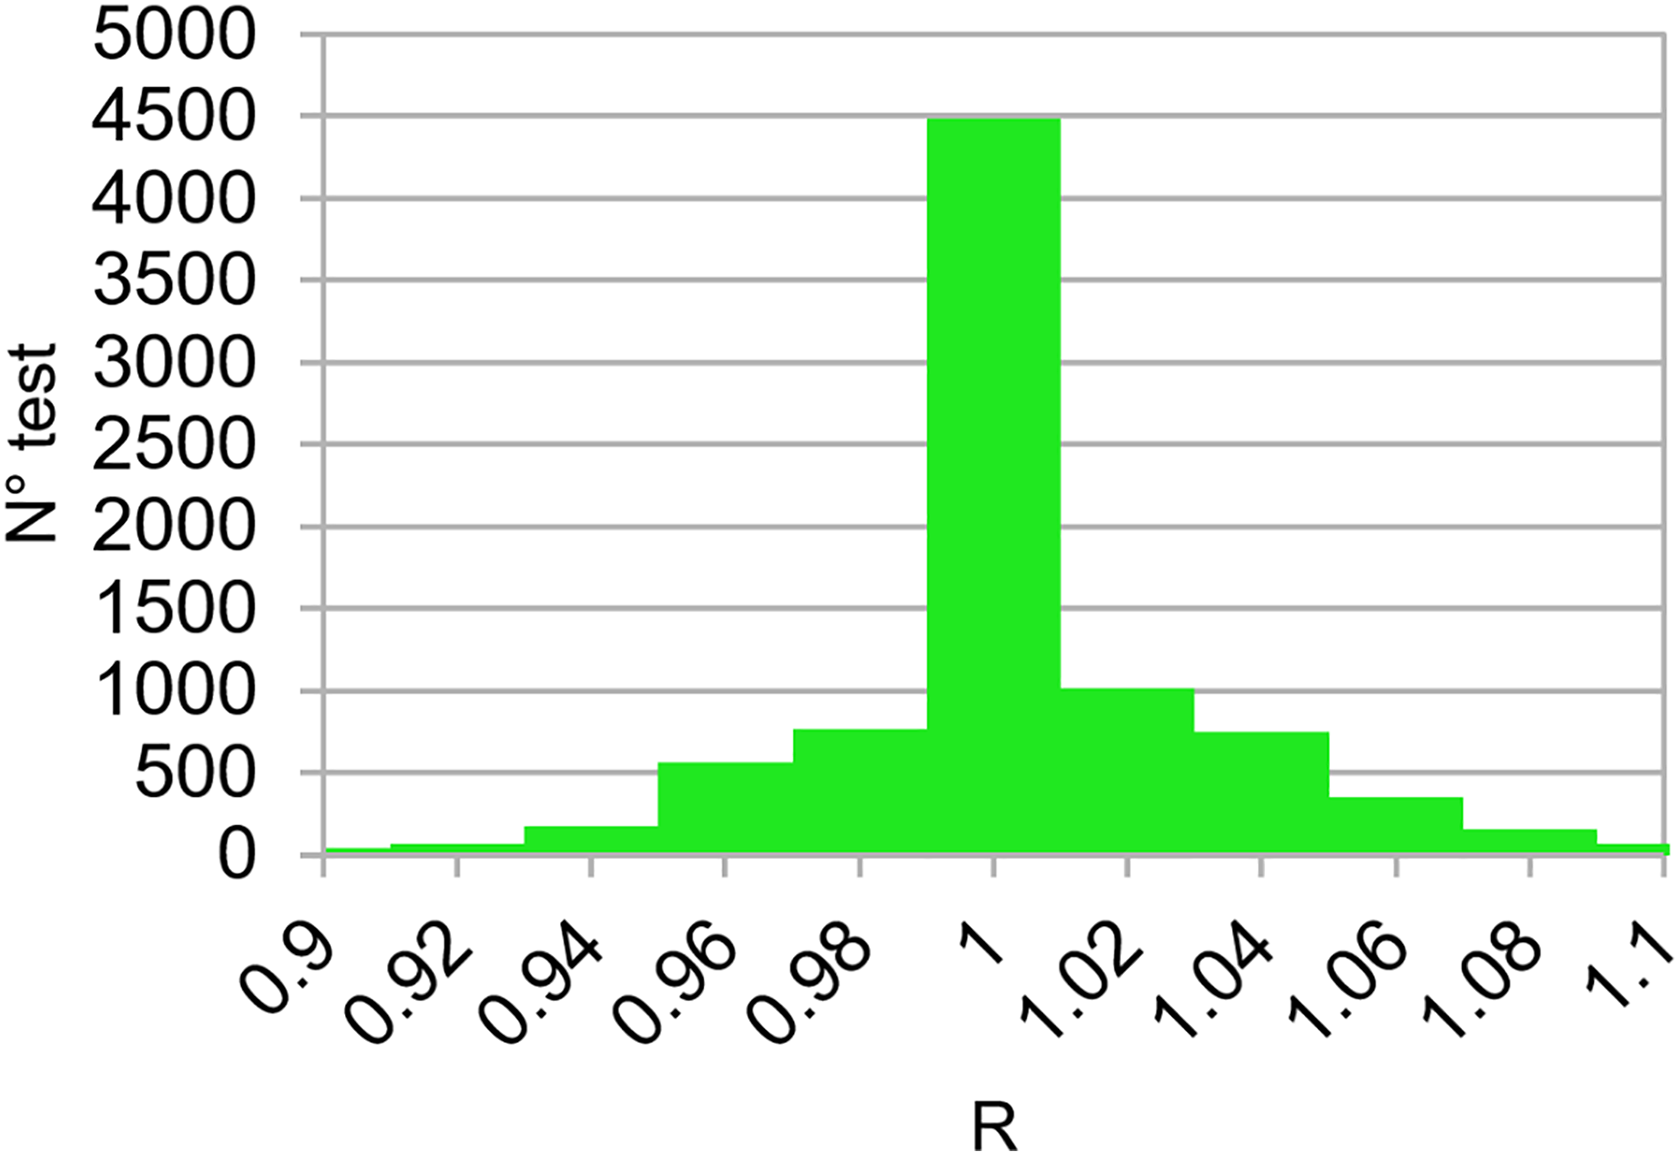
Distribution of R ratios obtained for the 8474 tests carried out for 386 patients treated with 3-DCRT, IMRT, and VMAT techniques. 3-DCRT indicates 3-dimensional conformal radiotherapy; IMRT, intensity-modulated radiotherapy; VMAT, in vivo dosimetry.
Discussion
We reported the results of 8474 IVD tests obtained with SOFTDISO for 3-DCRT, IMRT, and VMAT techniques. Tests presenting class-1 errors were intercepted, and a new IVD test was performed in the subsequent treatment fraction to verify the adopted corrections. When the right corrections were applied, all the 3 indexes (R, γ%, and γmean) went back within tolerance. We have estimated that in absence of the corrections, the percentage of OTL tests (T%) could reach about 37%. In vivo dosimetry procedure was able to identify the errors which were corrected in the subsequent day. Therefore, the percentage of OTL test range values were 1% to 18% for 3-DCRT, 1% to 7% for IMRT, and 2% to 10% for VMAT.
In particular, 2 patients with breast cancer treatments and 4 patients with lung cancer treated with 3-DCRT presented at least 1 mean index (
An example of SOFTDISO interface that shows OTL results for a tangential breast treatment using a wedged beam of 60° is presented in Figure 2 where data of the IVD test are showed. In particular, the software reports in (1) the patient CT scan (containing the isocenter point) with incident beam emerging from the top (red arrow), (2) the comparison between EPID signal profile (in red) of the reference EPID image as reported in section (d), and the profile (in green) obtained in the third IVD test as showed in section (e) along the cross plane axis, (3) the R ratios obtained in 5 different treatment days, (4) and (5) report the reference (contoured in a red square) and current EPID images (contoured in a green square), respectively, (6) a map of points with γ ≥ 1 and (7) the map on the different projections of patient DRR image. Anatomical region presenting the disagreement is clearly identified in the last section (g).The 2 arrows indicate a patient setup error due to breast displacement of about 1 cm causing R = 1.07, γ% = 79%, and γmean = 0.58 as reported in the sections (c) and (f), corresponding to index values of the third treatment fraction for the beam under investigation. Once patient setup was corrected, all the mean indexes returned within tolerance.

In vivo dosimetry results for a breast treatment with 3-DCRT, as displayed by SOFTDISO. 3-DCRT indicates 3-dimensional conformal radiotherapy.
To identify classe-1 or class-2 errors, the dedicated personnel analyzed the results showed on the SOFTDISO interface that are similar to those reported in Figure 2, with particular attention to (1) EPID signal profiles along in plane or cross plane axes (Figure 2B) to verify the presence of patient setup errors or the presence of beam attenuators and (2) the position of the map of points with γ ≥ 1 on the DRR images (Figure 2G) to verify the presence of morphological changes; the later can be random (gas pockets) or the progressive changes in the tissues (H&N tissue variations or lung tumor shrinkages).
Conclusions
The results reported in this article showed that the SOFTDISO practical IVD procedure was able to intercept errors during treatment fractions and to verify the appropriateness of the eventual corrections in the subsequent radiotherapy session. It permits to examine an adequate number of patients tested every day requiring a limited daily workload. Therefore, it can be easily introduced in the clinical routine as a part of the quality assurance program. For further improvement in IVD procedure, the authors intend to (1) use personalized Δd values for each patient. For patients presenting a more reproducible setup, pass criteria should be more restrictive than those reported in Table 2; even though this can increase the workload, it can reveal other kinds of errors, such as class-2 errors; (2) daily use of the CBCT to calculate R ratio. Currently, some IVD procedures perform dose reconstruction using planning CT scan. This means that in case of IVD warnings, for example, due to incorrect patient setup or anatomical changes, the reconstructed photon fluence on planning CT may differ from that used for the dose delivery. Therefore, IVD tests based on single points, 2-D, or 3-D dose recalculation can present some inaccuracies. It is a general opinion 40,41 that the use of CBCT scans for the reconstruction of the dose delivery using EPID images could improve the accuracy of the reconstructed dose, but the CBCT image calibration methods need further optimization.
Footnotes
Abbreviations
Declaration of Conflicting Interests
The author(s) declared no potential conflicts of interest with respect to the research, authorship, and/or publication of this article.
Funding
The author(s) received no financial support for the research, authorship, and/or publication of this article.