
Abstract
Introduction
While radiation therapy (RT) has long been used for the treatment of lung cancer, radiation pneumonitis frequently develops following RT and has negatively affected its applications. 1 It is clinically important to foresee whether radiation pneumonitis will develop or not in the stage of planning therapy. If the chances of development or grade of radiation pneumonitis are predicted to be high, then deintensified RT or alternative cure may be pursued instead of RT. Certain factors are directly or closely related to the intensity of RT and established as predictors for radiation pneumonitis—percent of lung volume which was subjected to a certain level of radiation or less as measured in units of Gray. They are denoted Vx; for example, V20 signifies percent lung volume with 20 Gray or less of radiation.
Several research directions have been pursued: efforts have been spent on identifying factors that could serve as prediction factors.2–6 Another important direction is building models employing relevant prediction factors to predict radiation pneumonitis.7–9 Developments in supportive techniques including automated organ detection, registration, classification, and segmentation10–14 greatly helped the efforts. The employed methods range from traditional machine learning approaches to modern deep learning neural networks and relatively recent architectures including vision transformers.15–20 Marisol Arroyo-Hernández et al 21 suggested that tumor volume is a significant factor in the radiation pneumonitis prognosis, which tends to increase the lung volume subjected to higher intensity of radiation. Kapoor et al 22 used deep neural networks for the task of predicting radiation pneumonitis. Katsuda et al 23 suggested that the combined use of dose-volume histogram (DVH) and dose-function histogram can help produce better prediction performance than using either feature alone. Cui et al 24 used deep learning together with a 1-dimensional DVH feature to predict radiation pneumonitis risk. Zhang et al 25 suggested that blood test results may play an important role in the prediction of radiation pneumonitis. Yakar et al 26 built various prediction models and compared their relative performance levels. They found the light gradient boosting machine (LGBM) to be the best-performing model in terms of area under the curve (AUC) measurements, followed by the random forest model.
Despite suggestions implicating different factors for radiation pneumonitis prognosis, most used very small size datasets with data counts ranging from 10 s to low 100 s, which were small to fully support authors’ claims. In this study, machine-learning and deep-learning models were developed to predict the likelihood of radiation pneumonitis development in patients who underwent thoracic RT using their pretreatment chest computed tomography (CT) data, clinical, dosimetric, and laboratory data.
Materials and Methods
Dataset
Data were collected from medical records of patients who received thoracic RT between 2010 and 2021. This retrospective study was approved by the Institutional Review Board of the Kyungpook National University Chilgok Hospital (KNUCH) (Approval No. 2021-10-009). Owing to its retrospective nature, the institutional review board of the institution provided a waiver of consent. The reporting of this study conforms to STROBE guidelines. 27 All patients’ data were anonymized before the analysis. Patients who were newly diagnosed with lung cancer, aged ≥18 years and received ≥50 Gy thoracic RT (with or without chemotherapy) were included. Patients were excluded from the analysis if they underwent hypofractionated or stereotactic ablative radiotherapy, had <6 months of follow-up time, or were not evaluated by pretreatment and posttreatment chest CT. A total of 548 consecutive patients were enrolled. The baseline characteristics of all patients including clinical, dosimetric, and blood test results are summarized in Table 1. The histologic type was one of the following: squamous cell carcinoma, adenocarcinoma, small cell carcinoma, combined small cell carcinoma and large cell carcinoma. For 6 patients, cancer-type information was not available and multiple imputations were applied. 28 Of the total dataset, 3-quarters were randomly drawn to form the training dataset and the remaining quarter formed the test dataset. A total of 4 rounds of such random drawings produced 4 sets, each comprised of train and test sets.
Comparison of Baseline Characteristics Between Patients With and Without Radiation Pneumonitis.

Abbreviations: RP, radiation pneumonitis; ECOG, Eastern Cooperative Oncology Group; COPD, chronic obstructive pulmonary disease; PTV, planning target volume; Vx, volume percentage receiving radiation dose more than x Gy; WBC, white blood cell; ANC, absolute neutrophil count; ALC, absolute lymphocyte count; NLR, neutrophil–lymphocyte ratio; CRP, C-reactive protein; FEV1, forced expiratory volume in 1 s; FVC, forced vital capacity; DLCO, diffusing capacity for carbon monoxide.
Treatment
Before 2015, when intensity-modulated RT (IMRT) and volumetric-modulated arc therapy (VMAT) started to be covered by the national health insurance system in South Korea, thoracic RT was mostly delivered by 3-dimensional conformal RT. Since 2015, the use of IMRT and VMAT in thoracic RT has gradually increased. A total dose of 60 to 70 Gy for curative intent and 50 to 66 Gy for postoperative intent, at 1.8 to 2.2 Gy per fraction, for 5 days per week, was delivered. For curative intent RT, concurrent chemoradiotherapy was first considered. In patients who could not tolerate concurrent chemoradiotherapy because of poor performance, poor kidney function, or patient denial, sequential chemoradiotherapy or RT was considered. The chemotherapy regimens consisted of paclitaxel, gemcitabine, and etoposide combined with cisplatin. The dose–volume constraints for normal tissues were set as follows: to the spinal cord, <45 Gy; esophagus, V50 <30%; heart, V40 <40%; and whole lung, V5 <60%, V20 <25%, V30 <20%, and mean lung dose of <15 Gy. All plans were generated in our treatment plan system (Eclipse, Varian Medical Systems, USA) and delivered by the 6- or 10-MV photon beams. Patients underwent a response-assessment CT 4 to 12 weeks after RT, followed by clinical examination every 3 months until the first year and every 6 months afterward.
Diagnosis of Radiation Pneumonitis
Radiation pneumonitis was diagnosed when acute respiratory events or radiologic changes of the lung tissue within the irradiated field were observed and could not be explained by causes other than RT. Patients presenting any evidence of pulmonary infection were excluded. Patients demonstrating symptoms of grade 2 or higher radiation pneumonitis according to the National Cancer Institute Common Terminology Criteria Version 5.0. were classified as developing radiation pneumonitis. 29 Following these criteria, 137 patients (25%) developed radiation pneumonitis.
Pretreatment CT Data
Pretreatment contrast-enhanced chest CT images were acquired with the patient in a supine position during full inspiration. All original CT data slices measured 512 pixels each per width and height. Spacings between slices comprising scan data ranged between 0.67 and 10 mm with an average of 3.14 mm. The interpixel spacing ranged from 0.39 to 1.18 mm, with an average of 0.70 mm. The overall flow of CT data processing is shown in Figure 1. It is well known that employing pretrained weights and fine-tuning weight values toward specific tasks usually produces better-performing models than training models from scratch using random weights. We searched for pretrained 3D convolutional neural network (CNN) models using search criteria including pixel size measurement and lung CT. One of the well-known 3D CNN models was developed by Hou et al 30 for the task of human subject action recognition for video sequence data, the characteristics of which were far from those of the lung volume in terms of texture and distribution and spatial pattern of meaningful nonzero pixels. There were few pretrained models targeting the lung volume or the available models were fit for small cube volumes measuring widths of 28 pixels, which we decided to be too small to preserve radiation pneumonitis-pertinent 3D structural data. Our efforts in finding suitable pretrained models for the lung volume were not successful; thus, we had to train models from networks initialized with random weight values.

The flow of processing three-dimensional computed tomography data.
Automatic Lung Volume Processing
Lung regions were segmented out of digital imaging and communications in medicine (DICOM) format images using an automatic segmentation method developed by Hofmanninger et al. 31 While the segmentation method produced mostly accurate results, some regions or volumes of interest were removed during the process, and we manually reincluded them to obtain a set of properly segmented lung volume data. The input file format was DICOM and was converted into nearly raw raster data format files for the convenience of single file storage and saving storage spaces. The raw DICOM data often encompass nonlung regions such as the head and abdomen. The first and last slices properly encompassing any lung regions were identified to retain only lung-containing slices, and slices falling outside the lung volume were removed. For each item of the volume data, the marginal volume flanking lung regions along the width and height axes were removed (coronal and sagittal planes). Substantial variation was noted in interpixel spacing within slices with a median of 0.79 mm and range from 0.39 to 1.18 mm. Variation was found in the interslice spacing across the volume, which ranged from 0.67 to 10.00 mm with a median of 2.50 mm. We interpolated slices across the volume in the axial direction to obtain sets of slices with a normalized spacing of 0.75 mm, and interpolated pixels within slices to obtain a normalized interpixel spacing of 0.75 mm. Finally, volume data were converted into neuroimaging informatics technology initiative file format and stored in gunzip (gz) format to save storage and maintain compatibility with the data loader and preprocessing stage for the neural network.
Manual Curation
Since the positive and negative sets were imbalanced with an approximate set size ratio of 1:3, we augmented the positive set by replicating samples to obtain a size-wise balanced train set. The train set size was deemed to be exceedingly small compared with the model parameter count; thus, typical augmentation involving affine transformation to increase the train set size by a factor should not have a large impact on model performance. No augmentation by any of the following means was conducted: translation, rotation, and scaling of lung volumes.
SVM and LGBM
We built support vector machine (SVM) and LGBM models incorporating 27 clinical and dosimetric parameters. The SVM model was trained using a linear kernel type and a C parameter value of 10. The LGBM model trained with a maximum tree depth of 10, the boosting type of the gradient-boosted decision tree, and a learning rate of 0.003. The rest parameters which were used to train the LGBM model are shown in Supplemental Table 1.
Computing Resources
A 36-core Intel(R) Xeon(R) Gold 5220 CPU with 128 GB memory was mainly used. For training and testing alternative smaller models, a piece of Nvidia RTX 2080 TI graphics processing unit (GPU) and 2 pieces of NVidia A6000 GPU were used.
Deep Learning Topology
In this study, we developed a deep learning network named MergeNet, which employed both 3D lung volume data with textual predictive factors. This model encompasses a CNN, which is subsequently connected to fully connected (FC) layers. This framework could facilitate the integration of volumetric CT imaging data with clinical, dosimetric, and laboratory data. Figure 2 shows the overall topology of the model. Lung 3D CT volume data are fed into the CNN as inputs. The 3D maxpool layer takes the maximum values out of a tensor array of CNN outputs and in turn outputs them as a 1-dimensional vector. 32 The vector size of the maxpool layer was 4096. A series of interlaced dropout, FC and batch normalization layers follows the maxpool layer. The number of FC layers varied between 1 and 4 to generate submodels of distinct topologies. For output, 1 hot binary encoding scheme was used: the final FC layer outputs 2 values: corresponding to radiation pneumonitis-positive and radiation pneumonitis-negative predictions. During the course of experiments, the summation outputs from the CNN and FC cascade tended toward values larger than 1 in the absolute scale by approximately 2 orders of magnitude; thus, larger encoding values of −100 and +100 were used throughout the experiments. The specific scheme for producing the prediction output out of the 2 one-hot-encoded outputs was as follows:

A CNN topology to utilize both CT data and prediction factor data.
Let Op = positive prediction value, On = negative prediction value
if (Op > On) then prediction = radiation pneumonitis positive
else if (Op < On) then prediction = radiation pneumonitis negative.
For the tie case where Op = On, 1 of the 2 prediction outcomes was randomly selected for simplified performance measurements. Yet, throughout the experiments, no such tie cases occurred.
From the experiments, the removal of the dropout layers was found to cause overfitting: perfect performance values were obtained during the training stage; however, performance measures approached 0 during the testing stage. We experimented with a range of different topologies which are shown in Figure 3. They differ from each other in terms of the relative placement of the dropout layers with respect to the rest of the layers and the number of FC layers employed, etc. Volumes of normalized width, height and length were used as input to CNN. Initially, we used a cube of a width of 32 pixels on each side considering the required computational resources such as memory and CPU cores. While all of the original CT data slices measured 512 pixels on each side, the use of small cubes appeared to substantially negatively affect performance, which was possibly caused by the loss of lung structural and histological information pertinent to radiation pneumonitis prediction. Later we increased the cube volume to measure 96 pixels on each side considering the retention of information and the capacity of available computational resources and computational feasibility. The total number of trainable parameters of the deep learning model was 3,638,406,436. Initially, we tried to use commodity GPU seeking the benefit of fast parallel numerical processing typically required from convolution operations. However, most commodity GPUs had limited memory capacity to host our 3D CNN model and weight parameters together. Hence we had to resort to CPU-only computation utilizing 36 cores and 128 GB memory. Hyperparameters including batch size and learning rate were varied, as shown in Supplemental Table 2. The optimal parameter values with which the best-performing model was obtained were determined and used throughout the experiments. Specifically, the optimal batch size was 16 and the initial learning rate was 1e-3 (Supplemental Table 3).

Different deep learning topologies.
Normalization
Typically, substantial areas of CT slices outside lung regions correspond to air or other nonlung objects inside the CT equipment and assume values of 0. In the normalization of pixel intensity values, pixels with zero intensity values were identified and removed, and the nonzero intensity values out of the entire slices comprising volume data were normalized to a distribution with a mean of 0 and a variance of 1. Some representative parameters for the best-performing deep learning model are shown in Supplemental Table 3.
Feeding Predictive Factors into CNN
A total of 27 potential predictive factors were fed as input to one of the FC layers:11 clinical factors (age, sex, performance status, histology, T stage, N stage, chronic occlusive pulmonary disease, interstitial lung disease, forced expiratory volume in 1 s (FEV1), FEV1/forced vital capacity (FVC), and diffusing capacity for carbon monoxide (DLCO)), 11 dosimetricfactors (radiation dose, PTV volume, lung volume, maximum lung dose, mean lung dose, lung V5, lung V10, lung V20, lung V30, lung V40, lung V50), and 5 blood markers (pretreatment white blood cell count, absolute neutrophil count, absolute lymphocyte count, and neutrophil-to-lymphocyte ratio, and C-reactive protein). The dropout layers with a dropout probability of 0.3 were appropriately inserted into the FC layer cascade. We suspected the radiation pneumonitis-relevant signals of the predictive factors might be overwhelmed by the multitude of output values from the convolution layers to negatively affect the prediction outputs. We replicated the clinical factors by a factor of 6 for the FC layer input. When the values of predictors were normalized to have identical mean and variance, performance appreciably degraded over models without normalized factors. Hence we subsequently used raw numerical values of factors without normalization.
The dataset was partitioned into 75% train set and 25% test set. Four randomly partitioned sets were generated each of which was comprised of train and test sets. Prediction models were built for each of the sets and performance values were measured and results over the 4 sets were averaged.
Statistical Analysis
The correlation potential predictive factors including were collected and correlation was analyzed. Factors included age, Eastern Cooperative Group Performance Status, smoking history, histologic type, copresence of chronic obstructive pulmonary disease, TNMv8 stage, pulmonary function tests, radiation dose, radiation method, peripheral blood markers, and dosimetric parameters. A chi-square test was used to assess the differences in categorical variables between 2 institutions. For continuous variables, both between 2 institutions and between radiation techniques, the Wilcoxon rank-sum test was used. Univariate and multivariate logistic regression analyses were performed to determine which factors predicted RILI. Model performance was measured by receiver operating characteristic analysis and calculating the AUC. The AUC values of the CNN models were measured by taking the 2 one hot-encoded outputs. The minimum and maximum values were found from the range of aggregate radiation pneumonitis-positive and radiation pneumonitis-negative output values, and the range was quantized into 20 discrete threshold values. For each threshold value sampled out of the 20 values, the output values from the negative prediction arm were offset by the step threshold value. Then, the prediction performance values including true positive rate and false positive rate (TPR and FPR, respectively) were measured for each setting of the threshold value. The AUC values were calculated as the area formed by the points of pairs of FPR and TPR values as x's and y's, respectively. The performances of different models were compared using the DeLong test. For missing values of numerical variables, multiple imputation 27 was used instead of median-value imputation. All statistical tests were 2-sided, and a P value of <.05 was considered significant.
Results
Logistic Regression Analysis of Potential Predictive Factors
The factors significantly correlated with the development of radiation pneumonitis are shown in Table 2. Mean lung dose, Lung V5 (%), Lung V10 (%), Lung V30 (%), Lung V40 (%), Lung V50 (%), interstitial lung disease, radiation dose (≥60 Gy), and curative RT aim significantly correlated with radiation pneumonitis.
Factors Significantly Correlated With the Development of Radiation Pneumonitis in Univariate Logistic Regression Analysis.

Abbreviations: CI, confidence interval; Vx, the volume percentage receiving radiation dose more than x Gy.
SVM and LGBM
SVM produced an average AUC value of 0.5250 from 4 runs over random partition sets (Supplemental Table 4). The LGBM model yielded an average AUC value of 0.5408 with a standard deviation of 0.0261 from the 4 runs (Table 3). No significant difference was found between the SVM and LGBM models (DeLong test, P value = .209; Table 4). 33 Detailed results for each of the 4 CV sets are shown in Supplemental Table 5. Overall, LGBM showed lower performance than the best-performing CNN models (Table 4).
Performance of the Prediction Models in the Test Dataset.

Abbreviations: AUC, area under curve; SVM, support vector machine; LGBM, light gradient boosting machine; CNN, convolutional neural network.
Comparison of AUC Values of the Models Using DeLong Test.

Abbreviations: AUC, area under curve; SVM, support vector machine; LGBM, light gradient boosting machine; CNN, convolutional neural network; NA, not applicable.
CNN and MergeNet
A convolution model which does not incorporate clinical and dosimetric factors had a 4-fold cross-validation test AUC value of 0.5496. On the contrary, the MergeNet model simultaneously utilizing both CT and clinical and dosimetric factors yielded an average AUC of 0.6893, which is a substantial increase from values resulting from models using only CT data and from those of all individual factors. Substantial variation in performance was observed depending on the neural network topology (Supplementary Table 6). Overall, MergeNet exhibited the highest level of performance, followed by CNN using CT data only, LGBM, and SVM (Table 3). The ROC AUC plots are shown in Figure 4. As presented in Table 4, MergeNet significantly outperformed SVM (P = .001), LGBM (P = .001), and CNN (P = .002) in predicting radiation pneumonitis.
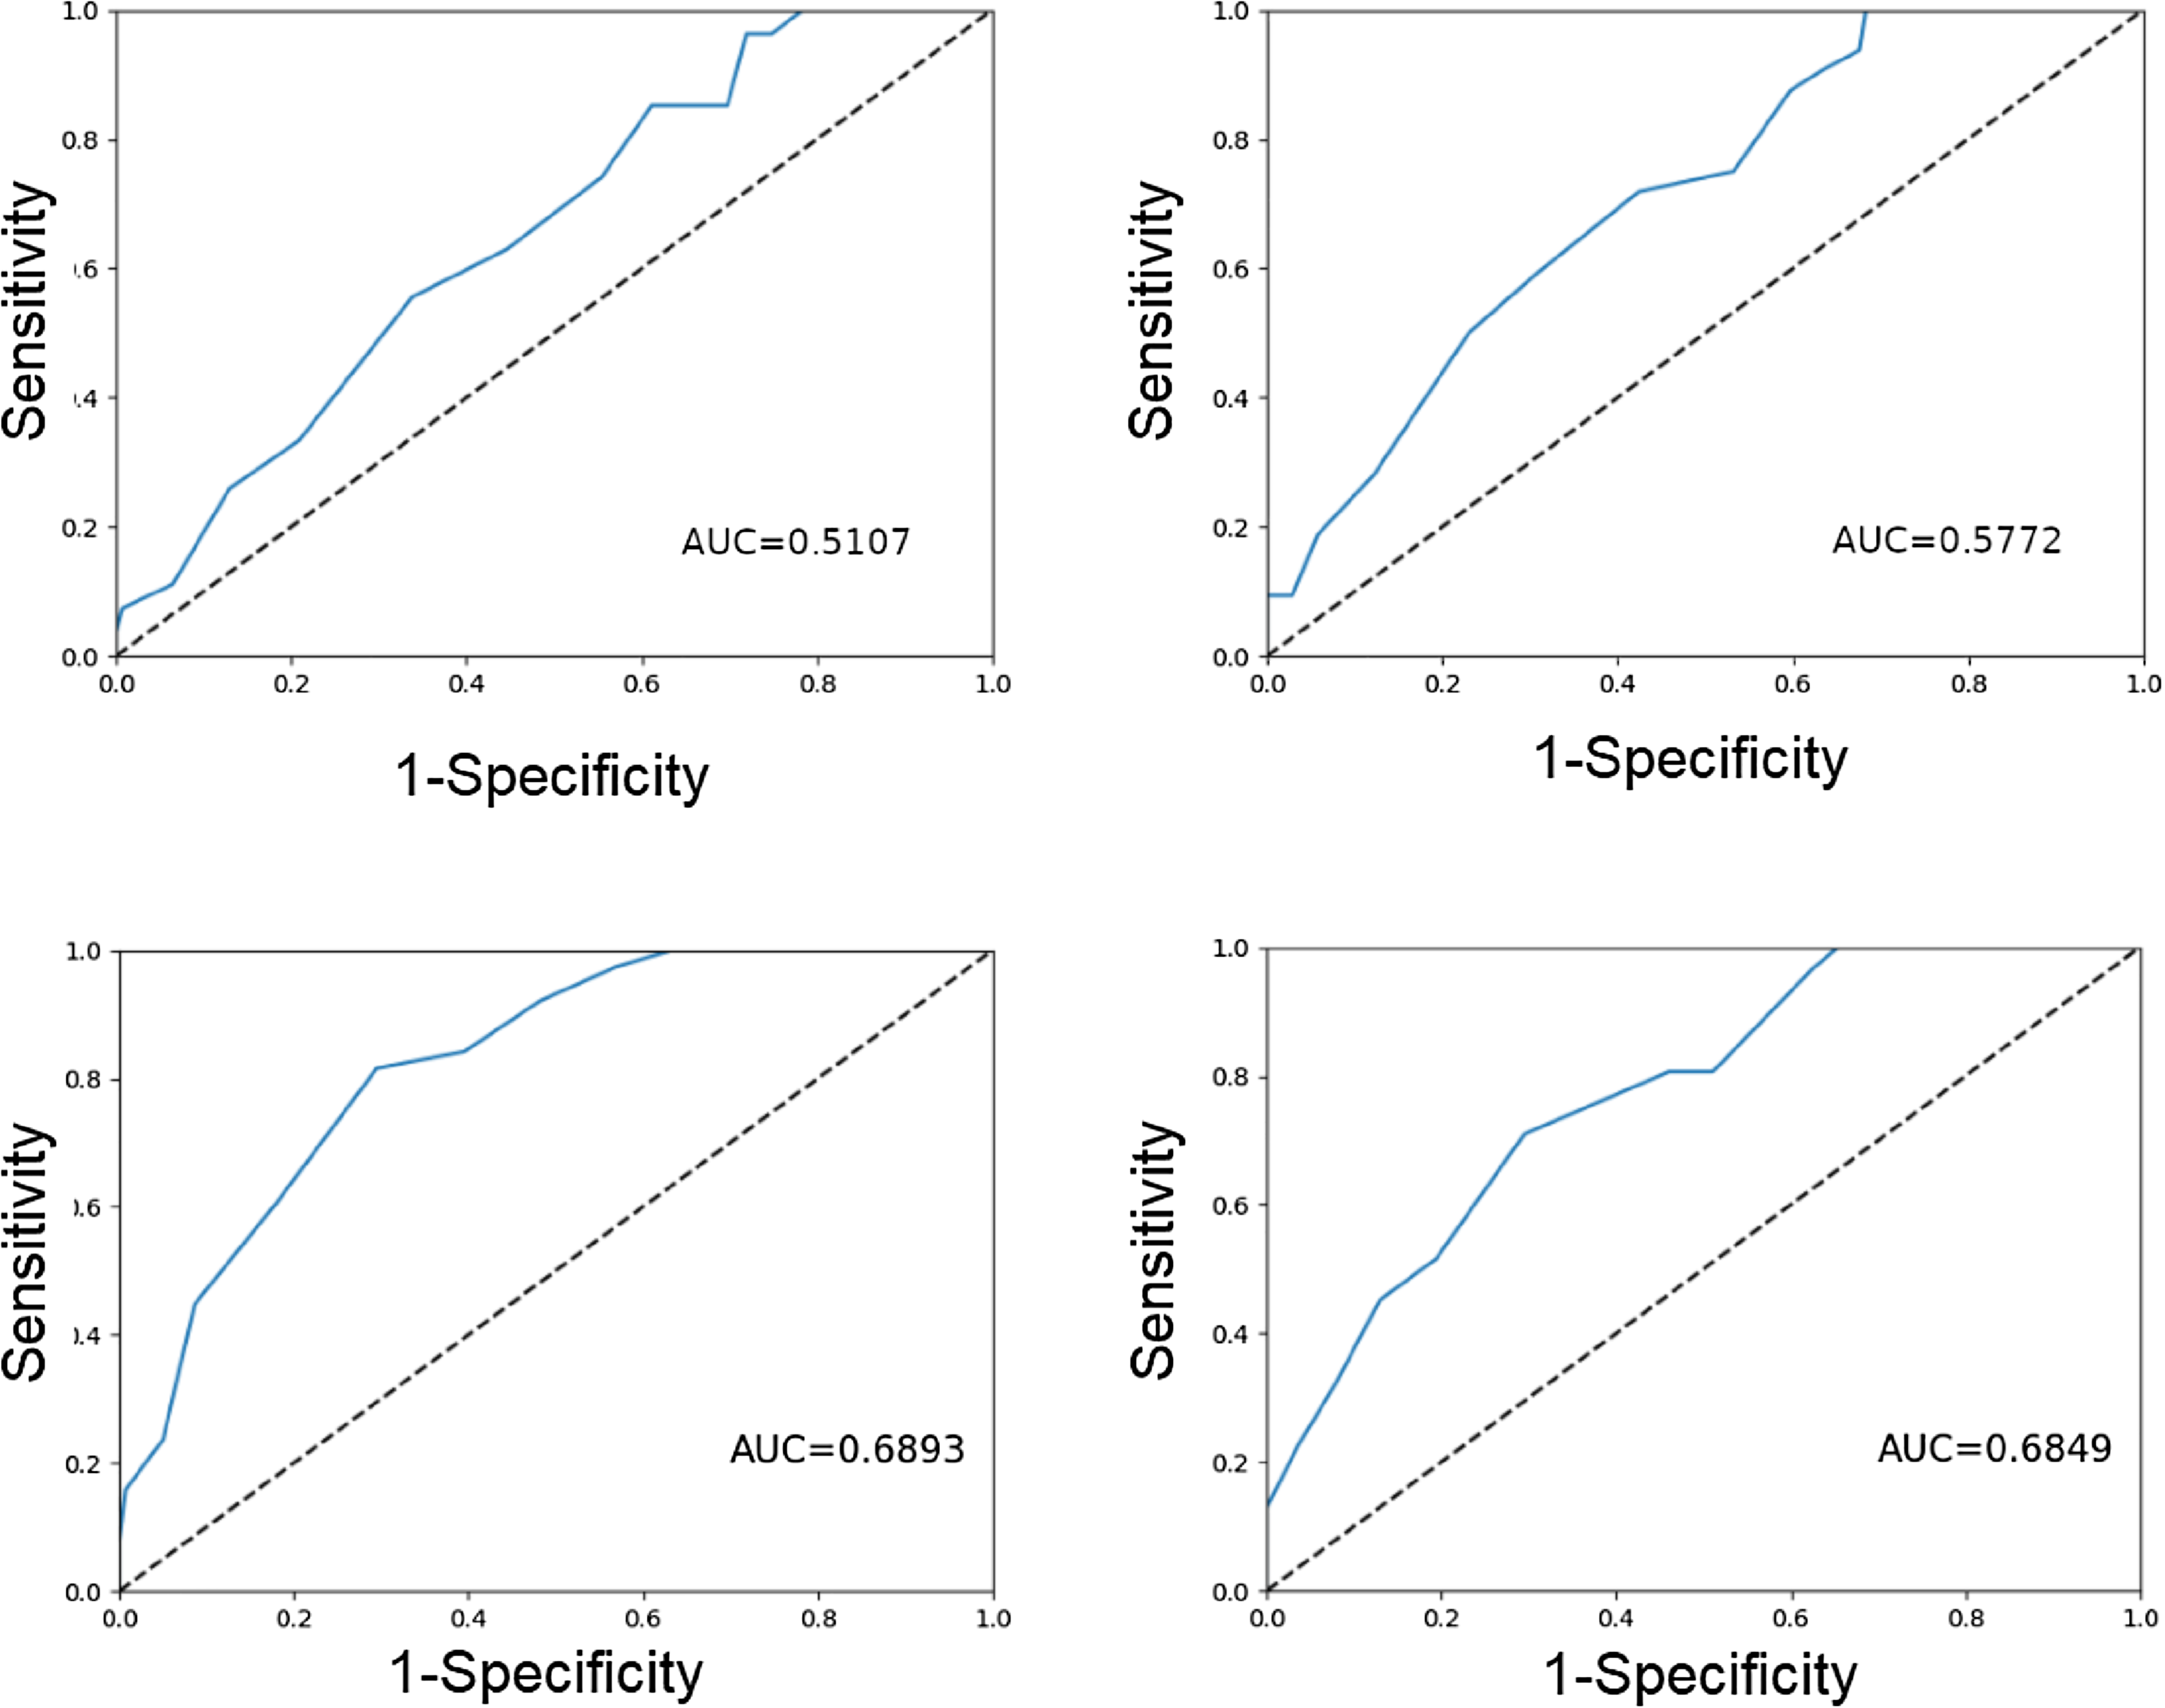
Receiver operating characteristic curves of the models. (a) SVM, (b) LGBM, (c) CNN topology #1, and (d) CNN topology #2.
Discussion
Radiation pneumonitis limits the application of thoracic RT for lung cancers. 34 Precise prediction of radiation pneumonitis is much sought for; however, no reliable methods have been suggested or established to date. 21 We attempted to build prediction models using well-known machine learning methods and compared their performance levels. Among various models we have constructed, the MergeNet model (AUC = 0.689) outperformed SVM (AUC = 0.525), LGBM (AUC = 0.541), and CNN (CT data only) (AUC = 0.550). This suggests that incorporating clinical, dosimetric, and laboratory data improved the prediction performance.
Although the MergeNet model exhibited the best performance among the proposed models, its performance was still unsatisfactory for clinical application. The CNN model was trained starting from randomly initialized weight configurations. It is well known that initializing network weights with pretrained weights help improve network performance to an appreciable extent. Transfer learning has been established as a way to accelerate the convergence of deep neural network training and improve the performance of the resulting model. 35 Data from the same domain or of nature similar to those of data in the target domain and task produce superior transfer learning results than heterogeneous data. Pretraining typically involves a large volume of data counting millions to billions of subjects. While such scale of lung CT data and associated clinical data are not publicly available, we believe in the value of taking initiatives and will continue to aggregate data to build prediction models.
We believe that some information that is pertinent to radiation pneumonitis prediction was lost when using a small cube with a width of 96 pixels. The memory size and number of CPU cores of computing machines that were used were among the main limiting factors to using large lung volume cubes in the convolution operation on CT data. We plan to employ computing machinery with larger memory and parallel computational resources and use the entire lung volume data without scaling down to see its feasibility and performance gains afforded. Running up to 100 epochs for model training typically took approximately three and a half hours. Due to the time-costly nature of the training steps, we could not check the performance levels of the models with as many variations as we hoped. In addition, some instabilities in training were observed such that a topology that produced a decently performing model occasionally produced poorly performing models in some training runs, which should be attributable to differences in initial random weights and the order of feeding randomly shuffled inputs. In addition, while a topology may produce decent performance models with a set of factors when additional factors are added to the set, the results are no longer satisfactory. We note the deep learning training process entails quite intricate and subtle aspects, which necessitate multiple iterations of model building, validation, and testing cycles.
Overall, the problem of radiation pneumonitis prediction is challenging partly due to the low power of predictive factors and the small dataset available to train the prediction models with. 36 Considering that our prediction models utilize a fairly comprehensive and diverse set of variables, a large part of symptomatic radiation pneumonitis development may be attributable to pure chances or other as yet unidentified factors. Despite the fairly large room for performance improvement, we believe our proposed method lays a promising foundation from which to pursue alternative methods and factors further. It suggests a feasible way to effectively utilize heterogeneous yet pertinent information in a unified way for radiation pneumonitis prediction.
Our study has several limitations. First, the lack of external validation may restrict the validity and generalizability of our model. Second, not performing power calculations for sample size estimation could undermine the reliability of our results. Third, our neural network-based models lack interpretability regarding the individual significance of each factor, owing to the “black box” nature of deep-learning algorithms. Despite these limitations, our proposed method, which developed from real-world data, comprehensively integrated imaging, clinical, dosimetric, and laboratory data. To the best of our knowledge, this study incorporated a dataset larger than those utilized in previous studies.37–39 Our study may give a comprehensive perspective on the utility and efficacy of different machine-learning approaches and distinct prediction factors for radiation pneumonitis prediction. In addition, it could partially help clinicians in making clinical decisions related to thoracic RT.
Conclusion
The MergeNet model, which incorporating chest CT, clinical, dosimetric, and laboratory data, demonstrated superior performance compared to other models. However, the overall performance of the model has not yet reached an optimal level for clinical application. Further research is necessary to improve the prediction accuracy and reliability.
Supplemental Material
sj-docx-1-tct-10.1177_15330338241254060 - Supplemental material for Deep-Learning Model Prediction of Radiation Pneumonitis Using Pretreatment Chest Computed Tomography and Clinical Factors
Supplemental material, sj-docx-1-tct-10.1177_15330338241254060 for Deep-Learning Model Prediction of Radiation Pneumonitis Using Pretreatment Chest Computed Tomography and Clinical Factors by Jang Hyung Lee, Min Kyu Kang, Jongmoo Park, Seoung-Jun Lee and Jae-Chul Kim, Shin-Hyung Park in Technology in Cancer Research & Treatment
Footnotes
Abbreviations
Declaration of Conflicting Interests
The authors declared no potential conflicts of interest with respect to the research, authorship, and/or publication of this article.
Ethics Statement
This study was approved by the Institutional Review Board of the Kyungpook National University Chilgok Hospital (KNUCH) (Approval number 2021-10-009). Owing to its retrospective nature, the institutional review board of the institution provided a waiver of consent.
Funding
The authors disclosed receipt of the following financial support for the research, authorship, and/or publication of this article: This work was supported by the National Research Foundation of Korea (NRF) grant funded by the Korea government (MSIT) (No. 2021R1I1A3048826).
Supplemental Material
Supplemental material for this article is available online.
References
Supplementary Material
Please find the following supplemental material available below.
For Open Access articles published under a Creative Commons License, all supplemental material carries the same license as the article it is associated with.
For non-Open Access articles published, all supplemental material carries a non-exclusive license, and permission requests for re-use of supplemental material or any part of supplemental material shall be sent directly to the copyright owner as specified in the copyright notice associated with the article.