
Abstract
This paper aims to examine the performance of home furnishing applications such as curtains, floor coverings, blankets or pillows to be air permeable, thermal insulators or sound absorbing materials. Two types of fillers, banana fibers and mini Styrofoam balls, were used in different proportions. Plain 1/1, twill 2/2, and sateen four weave structures made of jute-cotton fabrics were implemented by 12 and 16 picks per inch. The KES-F7 Thermo Labo apparatus was used to test the thermal conductivity of fabrics, SDL ATLAS M021 A tester was used to test air permeability, and the sound absorption coefficient (SAC) was measured using the impedance tube. The effect of different number of fabric layers (1, 2 or 3), different types of fillers between two layers of fabric and an air gap between the back plate and fabric samples during the sound absorption test was investigated. Along with two sewing techniques, lockstitch and 3-thread overlock stitch, two layers of optimal sound absorbing samples were joined together to examine the effect of different fillers on fabric properties. Radar chart, ANOVA analysis and coefficient of correlation were used as statistical tools to analyse the results. It was found that the lockstitch demonstrated better sewing performance compared to 3-thread overlock stitch. For triple-layered fabric with a twill structure, increasing the air gap between the back plate of the impedance tube and the fabric sample shifted the resonance frequency from 1600 Hz (SAC 0.97) to 1000 Hz (SAC 0.97). When using banana fibers with sateen structure, the resonance frequency remained at 6300 Hz but with an improved of SAC 0.96 compared to SAC 0.93. On the other hand, combining Styrofoam balls and banana fibres as fillers with a twill structure shifted the resonance frequency from 6300 Hz (SAC 0.93) to 4000 Hz (SAC 0.93).
Keywords
Introduction
In recent years, there has been an interest in using natural textile materials in many applications due to their light weight, good strength, low cost and appropriate thermal properties.1,2,3 Noise pollution is a serious problem and many researchers tend to use green composites to overcome health problems such as mental stress, mood changes problems hearing, tiredness and social negative communication which result from noise sources by using sound absorbing materials. 4 Nowadays, using of plant fibres as sound absorbers increased due to their biodegradable and eco-friendly characteristics.5,6,7,8 Many researchers applied different techniques to dissipate the acoustic energy which is measured by the sound absorption coefficient (SAC) and it ranges from 0 to 1. 9 The applications of acoustic textiles may be fabricated from textile materials only or by adding a definite type of polymer to add certain characteristics such as fire retardant or mechanical properties or to be a means to adhere fibres with each other. The basic elements of textile materials are divided into fibres, woven, knitted and nonwoven fabrics 10 that were used to enhance acoustic absorption. Composites based on natural fibres are considered as good sound-absorbing materials and many studies are conducted on their performance according to the fibre type.11,12,13,14,15,16,17,18 Increasing the amount of fibres in composite materials enhances the sound absorption coefficient because a higher volume fraction of resin means a smooth surface and more reflection of sound waves instead of moving into the material structure.19,20,21 Natural source fibres such as; blended kapok fibre with polypropylene fibre as non-woven composites and gave respectable sound retention behaviour at the frequency range from 250 Hz to 2000 Hz. 22 Jute fibres are commonly used in various applications as sound absorbers or thermal insulators due to their porous structure and good mechanical properties. However, the rough and stiff surface of jute fibres poses a challenge. To overcome these limitations, blending jute fibres with cotton fibres is a commonly employed solution.23,24,25,26,27,28 Woven fabrics are known for their sound-absorbing properties due to their porous structure in different weave patterns. Xie et al. 29 conducted a study to investigate the physical and acoustic properties of jute fabrics, focusing on the effects of warp and weft yarn densities, thickness, weight, and weave structure on sound absorption. Jeyaguru et al. 30 examined the impact of fabric weave structures (plain, twill, and basket weaves) in hybrid composites of blended Kevlar-Hemp fabrics on acoustic and mechanical behaviour. Basket weave exhibited the highest sound transmission, while twill structure showed better mechanical characteristics. Yarn parameters such as the type of raw material, yarn count, and spinning technology also affect the acoustic properties, with lower linear yarn density improving sound absorption. 31 Fabrics woven using rotor-spun yarns demonstrated greater sound absorption compared to compact or ring-spun yarns. Additionally, it was observed that increasing the number of fabric layers and using finer weft yarns resulted in higher values of the noise reduction coefficient. 32 Woven fabrics with lower pick densities and lower yarn twists exhibited improved sound absorption compared to higher densities and twists. 33 Islam et al. 34 investigated the structure of fabrics and discovered that plain and twill fabrics exhibit the highest levels of seam efficiency and strength, respectively. Plain fabrics have higher seam efficiency than other textiles with the same linear density of sewing threads. In terms of nonwoven fabrics as sound insulators, studies by Tascan and Vaughn21,35 examined the effects of fibre morphology and two different nonwoven fabric technologies (needle punched and vertically lapped) on air permeability and fabric density. The results indicated a positive relationship between fabric density and sound absorption, with increased air permeability leading to decreased sound insulation. However, this finding contrasts with the results of Kang et al. 36 Zakriya et al. 37 investigated the use of nonwoven jute fabric-based composite materials as effective sound absorbers and thermal insulators by filling them with different polymers. Increasing the amount of jute fibres in nonwoven blended fabrics made of jute-coir fibres enhanced the acoustic characteristics. 38 While most research has focused on utilizing natural fibres’ properties through different resin types in composite applications or by forming nonwoven fabrics using various techniques to enhance sound absorption, this research aims to develop effective sound-absorbing materials by using blended jute-cotton fabrics with home furnishings applications such as curtains, cushions or upholstery. Effect of number of fabric layers, fabric weave structure, picks per inch, fabric thickness, air permeability and different types of fillers on sound absorption performance were studied. Optimal fabric samples of sound absorption were sewn to examine the ability of different fillers to enhance sound absorption or reduce sound reverberation in upholstery applications. In addition, the effect of fabric parameters was examined to obtain the optimal performance of air permeability and thermal insulation of home furnishings applications.
Materials and methods
Samples’ preparation
Samples’ specification of different layers of fabric.


The pattern of weave structures (plain 1/1, twill 2/2 and sateen 4).
Fabric samples’ specifications.

To examine the acoustic performance of different fillers, two layers of optimal fabric samples of sound absorption performance for each weave structure (T12 or S12) were sewn together. Lockstitch and 3-thread overlock stitch using the same sewing thread polyester (42/2 Ne) provided by El-Negmah company were applied. Singer and over JUKI machines were used by four stitches per centimetre for each of them to determine the suitable sewing stitch for sewing these woven cotton/jute fabrics.
Specifications of fabric samples with different fillers.


Fabric samples with different fillers.
Testing and calculations
The thermal conductivity of various layers of the jute fabrics was determined using the KES-F7 Thermo Labo apparatus, ensuring that the heat transfer between the first plate at 30°C and the second plate at 20°C remained constant during measurement.
Air permeability was measured according to the standard test method ASTM D737, and SDL ATLAS M021 A tester was used to measure the samples. 39
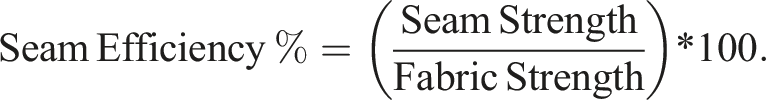
The sewn seam strength and sewn seam efficiency of critical sewn seam assemblies with each fabric were calculated, because sewn seam strength and sewn seam efficiency vary with each fabric. Seam efficiency for both applied seam types; tensile strength and elongation were measured for fabrics and seams according to the standard test method ASTM D1683/D1683M-22.
40
In addition, sewing strength (N/mm2), sewing elongation percentage, and seam efficiency percentage were determined using an Instron tester (USA, 2005) and seam efficiency was calculated regarding the equation
41
:
According to the (ASTM, E., 1050-9) standard, sound absorption coefficient (SAC) was measured. Standard test method for impedance and absorption of acoustical materials was used including a tube, two microphones, and a digital frequency analysis system. American Society for Testing and Materials, Philadelphia, PA, 1990), the normal sound absorption coefficient was experimentally determined using a two-microphone impedance tube technique. Figure 3 shows the test setup utilized in the laboratory to evaluate the samples’ sound absorption coefficients using a B&K impedance tube type 4206. The impedance tube’s internal diameter is 30 mm and 100 mm, and the acoustic properties were measured in the frequency range from 100 to 6300 Hz. According to (ISO 10534-2), the frequency range in the third octave band could divided into low frequency range (125–1600 Hz) and high frequency range (500–6300 Hz). With this technique, a loudspeaker at one end of the tube generates a plane sound wave, which is then reflected by the specimen at the other end. The decay of sound energy is captured using two microphones positioned differently on the inner surface of the tube. The complex acoustic transfer function is used to calculate the reflection coefficient ‘R’ of the specimen. Therefore, the normal incidence sound absorption coefficient is determined to be equal to α = 1 - |R|2. Setup of the impedance tube for sound absorption measurements.
To compare between the sound absorption performance of fabric samples made of blended jute-cotton fabrics, the average of sound absorption coefficient was calculated (SAC). The material is called sound absorption material when the SAC is greater than 0.210. Additionally when the SAC is greater than 0.56, the material is called high-efficiency sound-absorption material.
42

All results presented and tabulated, by means values as bar charts or graphs by using Microsoft Excel. The significant effect between variables were statistically analysed according to ANOVA two way measurements based on IBM® SPSS® (SPSS Inc., IBM Corporation, NY, USA) Statistics Version 22 for Windows, The significant difference was located at p ≤ .05. The coefficient of correlation was calculated to summarize the relation between fabric factors and the studied properties. Based on radar chart, 43 the best samples of air permeability, thermal conductivity and sound absorption were investigated.
Results and discussion
Results are divided into two sections; section one investigates the relation between fabric samples such as number of layers, picks per inch, fabric weave structure, fabric thickness, air permeability and thermal conductivity. The best samples of air permeability and thermal insulation could be applied in home furnishings such as curtains. The second section is to test the ability of home furnishings such as curtains, cushions or upholstery to absorb sound waves. The performance of different number of fabric layers, air gap back the fabric samples and different fillers between two layers of fabric will be studied.
Thermal and air permeability performance of home furnishings
Specification of different layers of fabric.

Effect of fabric factors on air permeability
Fabric factors affecting air permeability.

Figure 4 shows that by increasing the number of picks per inch, air permeability decreases. Additionally, sateen structure has the highest values of air permeability because of its opened structure and more weft floats compared to plain and twill weave structures. For instance, the highest value of air permeability is with single layer of sateen structure and 12 picks per inch which makes this sample be suitable for home furnishings such as curtains. Effect of number of layers on air permeability.
Effect of fabric factors on thermal conductivity
Fabric factors affecting thermal conductivity.

Figure 5 shows that at the same fabric structure by increasing the number of fabric layers, thermal conductivity increases. On the other hand, 16 picks per inch recorded higher values of thermal conductivity compared to 12 picks per inch. The lowest value of thermal conductivity was recorded with the single layer of sateen structure at 12 picks per inch which means that it is the suitable fabric to be as a thermal insulator in the upholstery applications such as curtains. Higher values of air permeability indicate to more air molecules that are trapped between fabric construction and effective thermal insulation.44,45 Effect of number of layers on thermal conductivity.
Effect of fabric factors on fabric thickness
Fabric factors affecting fabric thickness.

Figure 6 displays the effect of number of fabric layers on the fabric thickness. It is noted that the lowest values of fabric thickness are with plain weave structure at 16 picks per inch. This is due to the higher intersections between yarns that lead to more compactness in the weave structure and lower fabric thickness. Effect of number of layers on fabric thickness.
Correlation between fabric thickness, air permeability and thermal conductivity
Correlation between fabric thickness, air permeability and thermal conductivity.

Ranking of fabric samples according to thickness, air permeability and thermal conductivity
Radar chart of the jute-cotton fabrics with three different layers are drawn in Figure 7 presenting their characteristics. Also, radar chart areas were calculated and ranked in Table 9 to select the higher ranked samples according to their optimal characteristics. The rank is according to higher values of air permeability, lower thermal conductivity and lower thickness of fabric samples to achieve the higher performance of home furnishings such as curtains, floor coverings or blankets. By calculating radar chart areas, it was found that sateen followed by twill structures by weft density 12 picks per inch ranked as 1st and 2nd respectively by a little difference in the radar chart areas. Radar chart of different layers of fabric samples. Radar areas for different layers of fabric samples.

Acoustic performance of single layers
Figure 8 shows that the sound absorption coefficient (SAC) of all samples is fluctuated between 0.04 and 0.15 in the frequency range from 500 to 5000 Hz. At 6300 Hz, a significant increase in the SAC values is observed. Although there is an increase at 6300 Hz, the results are not acceptable to achieve a good sound absorbing material in home furnishings applications, so that the research suggested some factors that enhance the values of SAC of woven jute fabrics such as increasing the number of fabric layers, air gap between the fabric sample and the rigid back of the impedance tube, or adding different fillers between fabric layers. SAC of single layers.
Fabric factors affecting SAA
After computing the sound absorption average (SAA) for single layers in the scenario of high-frequency range,
47
as depicted in Figure 9. The sound absorption average (SAA) is calculated to express the average value of SAC for each sample at the high frequency range of sound waves (500 – 6500 Hz) and the samples which recorded the highest SAA values are selected. Among these samples, S12 and T12 exhibited the highest values of air permeability. This outcome suggests that fabrics with higher air permeability values serve as effective sound absorbers. This can be attributed to the presence of air molecules between yarns within the fabric structure, which results in increasing friction between sound waves and air molecules, leading to enhance sound wave attenuation.
35
The effect of fabric thickness on SAA is not consistent for all samples due to the effect of other variables such as fabric structure and amount of air molecules between the fabric construction. SAA values of single layers.
Radar chart areas of single layers of fabric
Radar chart of the single layer of fabric samples are depicted in Figure 10 presenting their characteristics. Also, radar chart areas were calculated and ranked in Table 10 after measuring the sound absorption average (SAA) for ranking the fabric samples and select the optimal samples to study the effect of multilayers of fabric and different fillers on sound absorption performance in home furnishings applications. By calculating radar chart areas, it was found that sateen and twill structures by weft density 12 picks per inch ranked as 1st and 2nd by a little difference in the radar chart area. These areas confirm the results of Figure 9 and ensure that these samples (S12 and T12) present the higher performance in all applied samples. Radar chart of single layers of fabric samples. Radar areas of single layer of fabric samples.

Acoustic performance of double and triple layers
This section is to discuss the effect of the number of fabric layers, the air gap between fabric samples and the rigid back of the impedance tube, and different types of fillers between two layers of fabric. SAC of Low frequency range (100 Hz to 1600 Hz) and high frequency range (500 Hz to 6300 Hz) were measured for double and triple layers.
Effect of the number of fabric layers on SAC
Figure 11 compares between the performance of sound absorption of twill and sateen structure of samples 2T12, 2S12, 3T12 and 3S12 with different number of fabric layers. It is demonstrated that by increasing the number of layers of jute fabrics, the sound absorption behaviour of the triple layers enhanced compared to the double layers. For instance, the average of sound absorption coefficient (SAC) of 3S12 increased by (42% and 39%) at low and high frequencies respectively compared to 2S12. Effect of number of fabric layers on SAC.
Figure 12 displays the relation between number of fabric layers, SAC, air permeability and fabric thickness. By increasing the number of layers, air permeability decreased and SAC increased. This finding contradicts the previous result of single layers as it was shown in Figure 9. This is due to higher values of air permeability in single layers which potentially enhance their ability to trap a greater number of air molecules within the fabric structure, thus increasing the friction between air molecules and sound waves leads to higher sound attenuation. On the other hand, increasing the number of layers make the fabric more compact and dense which prevent transmission of sound waves. This finding confirms that there is an optimum value of air permeability to achieve the best results of sound absorption performance.
33
Effect of No. of layers on SAC.
Effect of air gap of double and triple layers of fabric on SAC
Figure 13 shows the effect of three different mounting conditions; rigid backing (the samples were directly mounting on the rigid back of the tube), 3 cm and 6 cm air gaps between the samples and the rigid backing of the impedance tube on the SAC of a double layer from each of the two optimum fabric samples (2T12 and 2S12). It is revealed that, by increasing the air gap between the samples and the back plate from 3 cm to 6 cm, a significant increase in the SAC was obtained. In case of 2T12, the average of SAC at 3 cm and 6 cm are (0.25) and (0.35) respectively. Increasing the air gap shifted the resonance frequency (the frequency at which the maximum absorption coefficient occurs) from 1600 Hz (SAC 0.82) to 1250 Hz (SAC 0.85). Regarding 2S12, the average of SAC at 3 cm and 6 cm are (0.26) and (0.38) respectively. Increasing the air gap shifted the resonance frequency from 1600 Hz (SAC 0.82) to 1000 Hz (SAC 0.82). By increasing the air gap between the fabric sample and the rigid back wall, SAC values increased.
48
Effect of air gap on SAC of a double layer.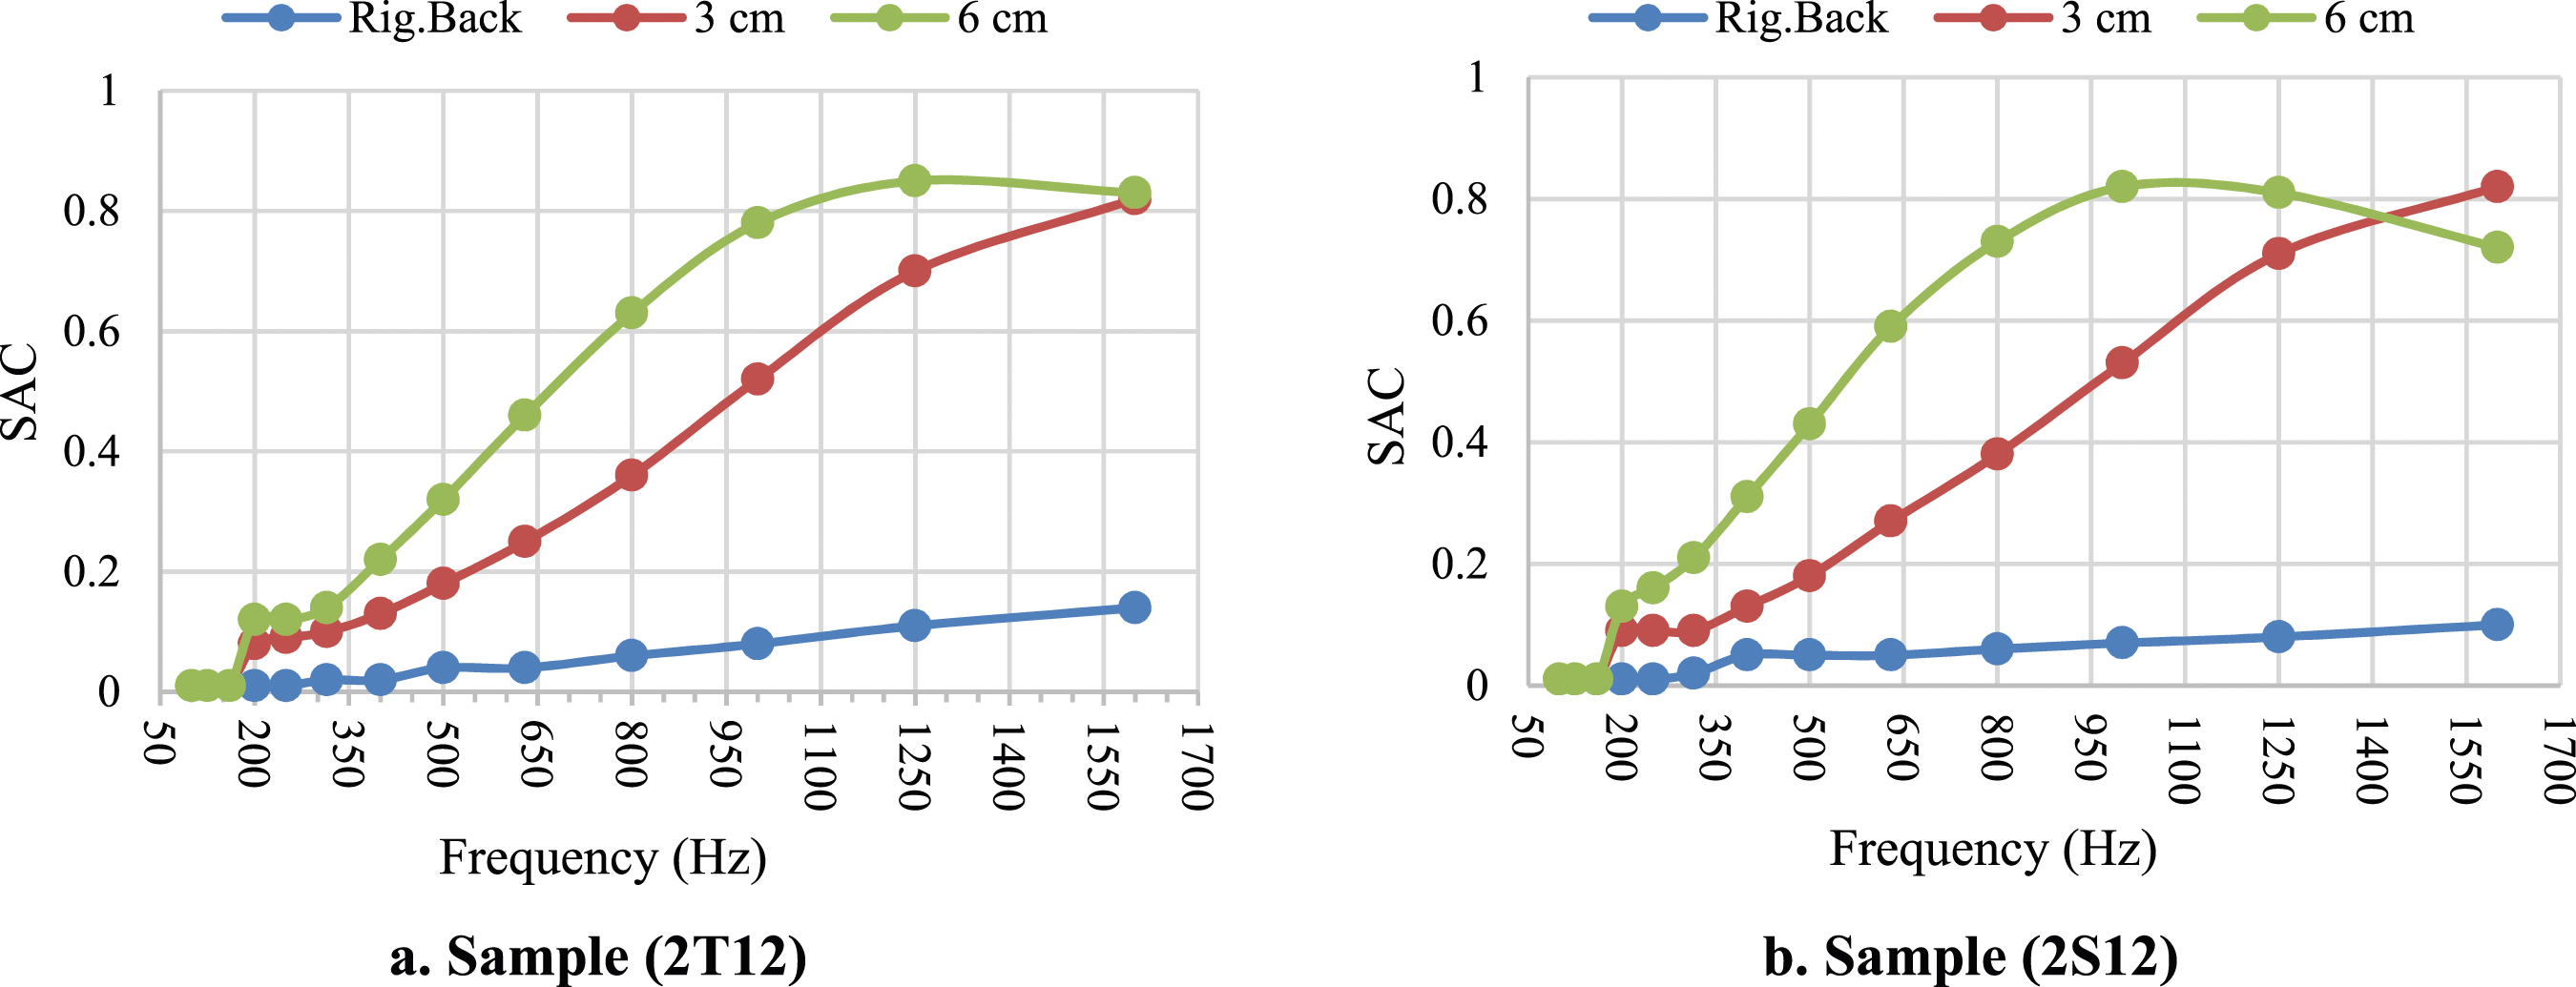
Figure 14 demonstrates that, by increasing the air gap between the samples and the back plate from 3 cm to 6 cm, a significant increase in the SAC was obtained. In case of 3T12, the average of SAC at 3 cm and 6 cm are (0.35) and (0.49) respectively. Increasing the air gap shifted the resonance frequency from 1600 Hz (SAC 0.97) to 1000 Hz (SAC 0.97). Regarding 3S12, the average of SAC at 3 cm and 6 cm are (0.32) and (0.47) respectively. Increasing the air gap shifted the resonance frequency from 1600 Hz (SAC 0.96) to 1000 Hz (SAC 0.96). Effect of air gap on SAC of triple layers.
Radar chart areas of double and triple layers of fabric
Figure 15 and Table 11 show the radar chart results of sewed double and triple layers of T12 and S12 samples. The radar chart is based on higher values of air permeability, lower thickness and lower thermal conductivity to obtain the optimal samples of home furnishings applications to be as thermal insulators and sound absorbing materials such as curtains, blankets or floor coverings. By calculating radar chart areas, it was found that the sewed double layers of twill weave structure ranked as the first optimal sample followed by the double layers of sateen structure. Radar chart of double and triple layers of fabric samples. Radar areas of double and triple layers of fabric samples.

Effect of type of fillers on SAC
This section discusses the ability of furnishings home such as upholstery, curtains or pillows to absorb sound waves. After joining two layers of the selected fabric together (T12 or S12) according the higher values of SSA, three different fillers were padded (Figure 2). In the beginning, this section discusses the sewing performance to form the shape of samples then effect of different of fillers on sound absorption performance will be analysed.
Effect of seam type and fabric structure on sewing performance
Sewing performance of lockstitch and 3-thread overlock stitch.
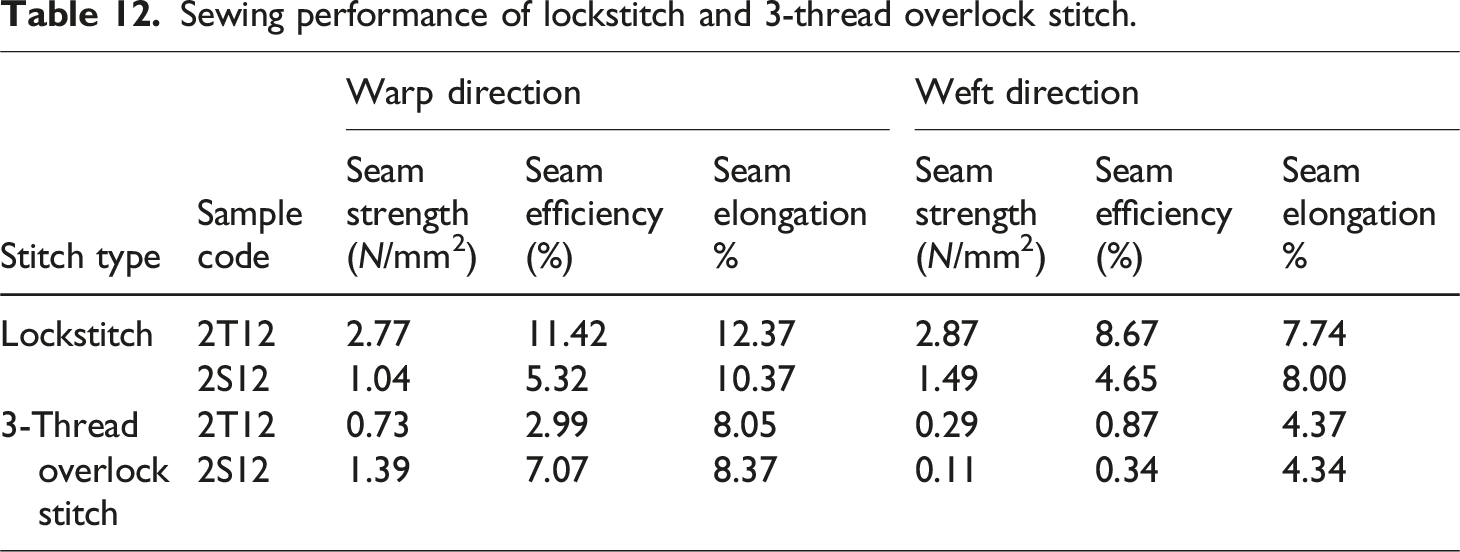

Sewing performance of lockstitch and 3-thread overlock stitch.
Effect of fabric factors on sewing performance
Effect of seam type and fabric structure on sewing performance.
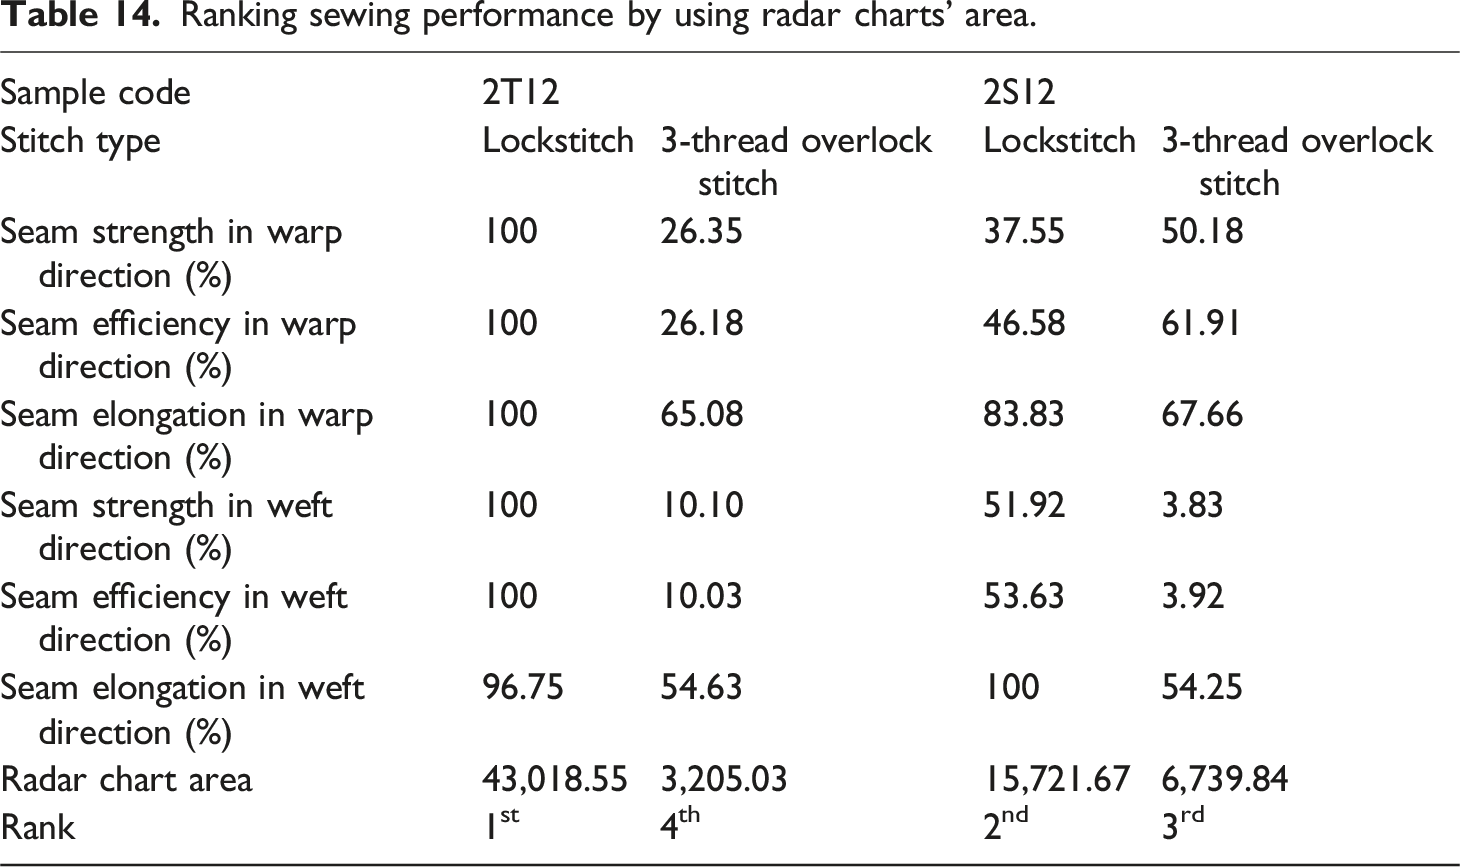
Ranking seam type according sewing performance by radar charts’ area
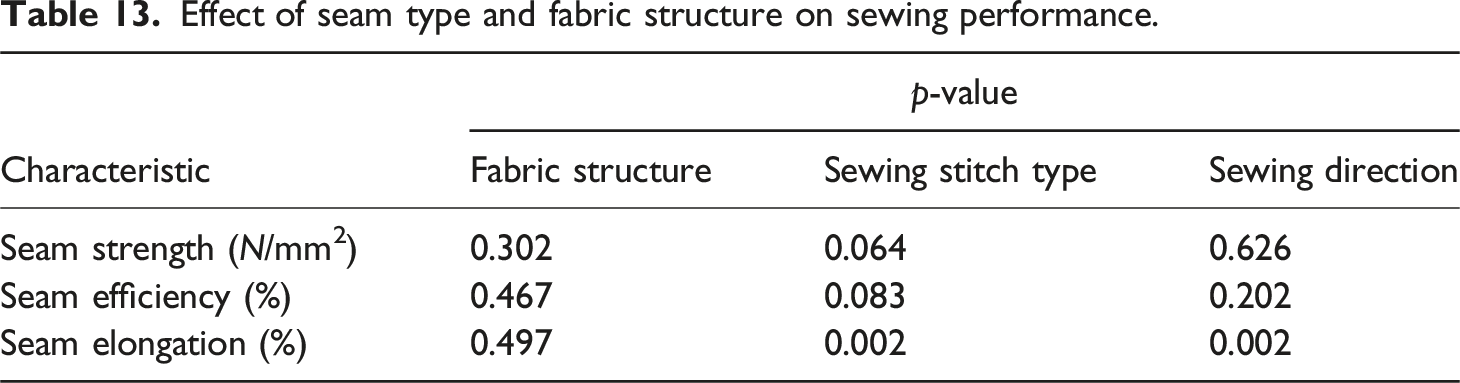
Figure 17 shows the effect of the fabric direction; as it’s clear that sewing performance in the warp direction is higher compared to the weft direction. The sewing performance with twill structure is higher compared to fabric weave structure. Radar charts depict the sewing performance of T12 and S12 whereas the radar chart area was calculated for both samples (2T12 and 2S12), and both seam types. It was found that the radar chart area of the lock stitch is higher of the both weave structure.
49
All sewed samples were ranked by radar chart areas in Table 14. Therefore, lockstitch was applied to join fabric samples together due to its higher ranks in sewing performance. Radar charts of sewing performance of lockstitch and 3-thread overlock stitch. Ranking sewing performance by using radar charts’ area.
Effect of different types of fillers and air gaps on SAC
Figure 18 displays the SAC of 1T and 4S at three different mounting conditions, rigid backing, 3 cm and 6 cm air gaps. It is demonstrated from the figures that, leaving an air gap between the sample and the back plate of the tube, improved the SAC significantly. In another meaning, the averages of SAC of 1T at rigid backing, 3 cm and 6 cm in the frequency range from 100 Hz to 1600 Hz are 0.08, 0.3 and 0.36 respectively. Also for 4S sample, the averages of SAC are 0.09, 0.32 and 0.38 for rigid backing, 3 cm and 6 cm correspondingly.
50
100% Styrofoam balls filler with twill and sateen structure.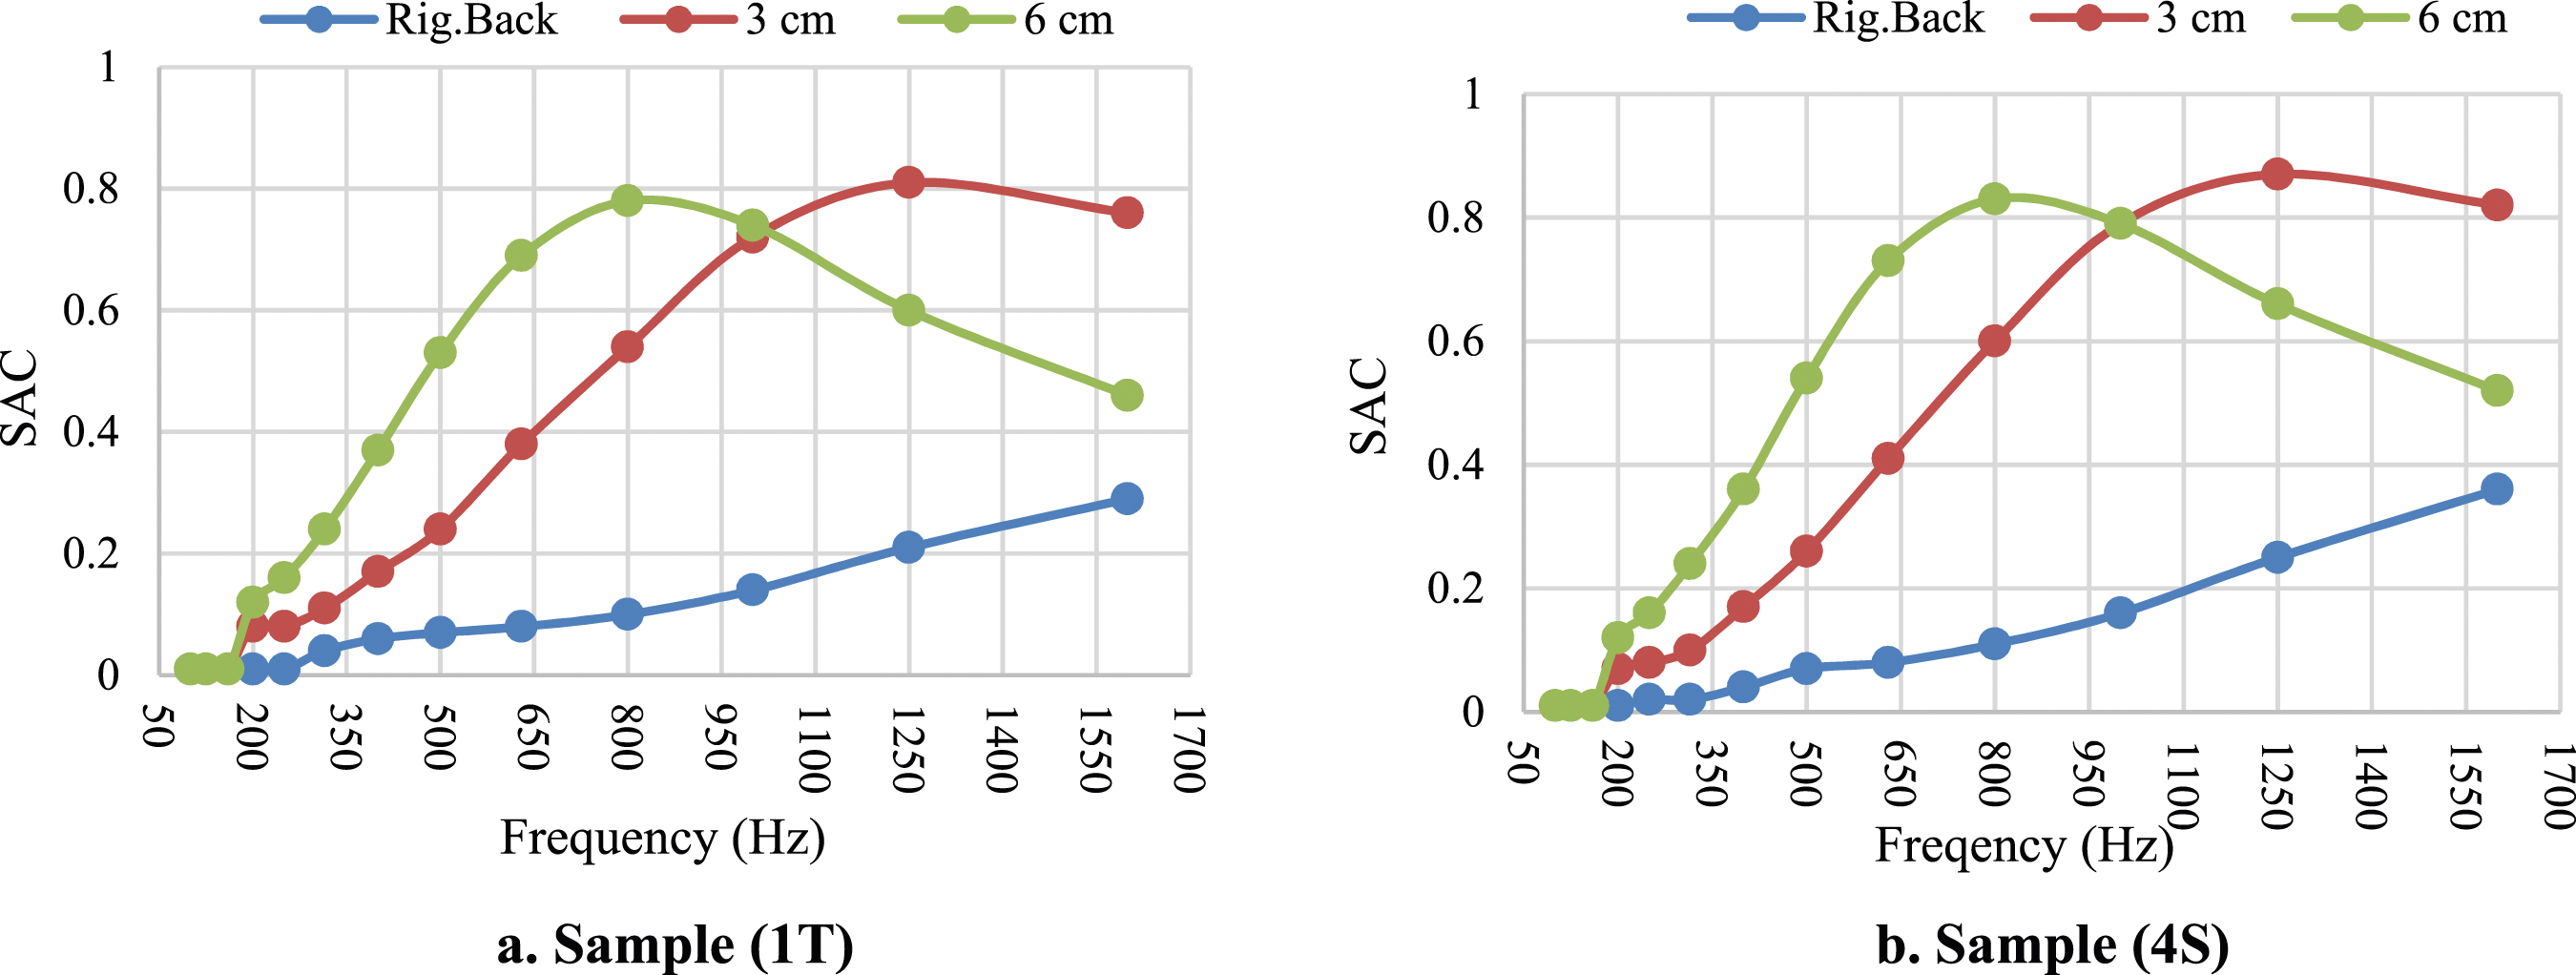
Moreover, by increasing the air gap from 3 cm to 6 cm, the resonance frequency in case of 1T shifted from 1250 Hz (SAC 0.81) to 800 Hz (SAC 0.78) which enhanced the sound absorption at low frequency. And in the case of 4S, the resonance frequency shifted from 1250 Hz (SAC 0.87) to 800 Hz (SAC 0.83). By comparing between the results of 1T and 4S, it can be concluded that, the SAC of sateen structure is higher compared to the twill structure while maintaining the same filler.
Figure 19 shows SAC values of 2T and 5S at three different mounting conditions, rigid backing, 3 cm and 6 cm air gaps. It is demonstrated from the figures that, the presence of an air gap between the sample and the back plate of the impedance tube, improved the SAC significantly. In another meaning, the averages of SAC of 2T at rigid backing, 3 cm and 6 cm in the frequency range from 100 Hz to 1600 Hz are 0.07, 0.32 and 0.4 respectively. Also for 5S sample, the averages of SAC are 0.06, 0.29 and 0.38 for rigid backing, 3 cm and 6 cm correspondingly. Blended filler (50% Styrofoam balls/50% Banana fibers).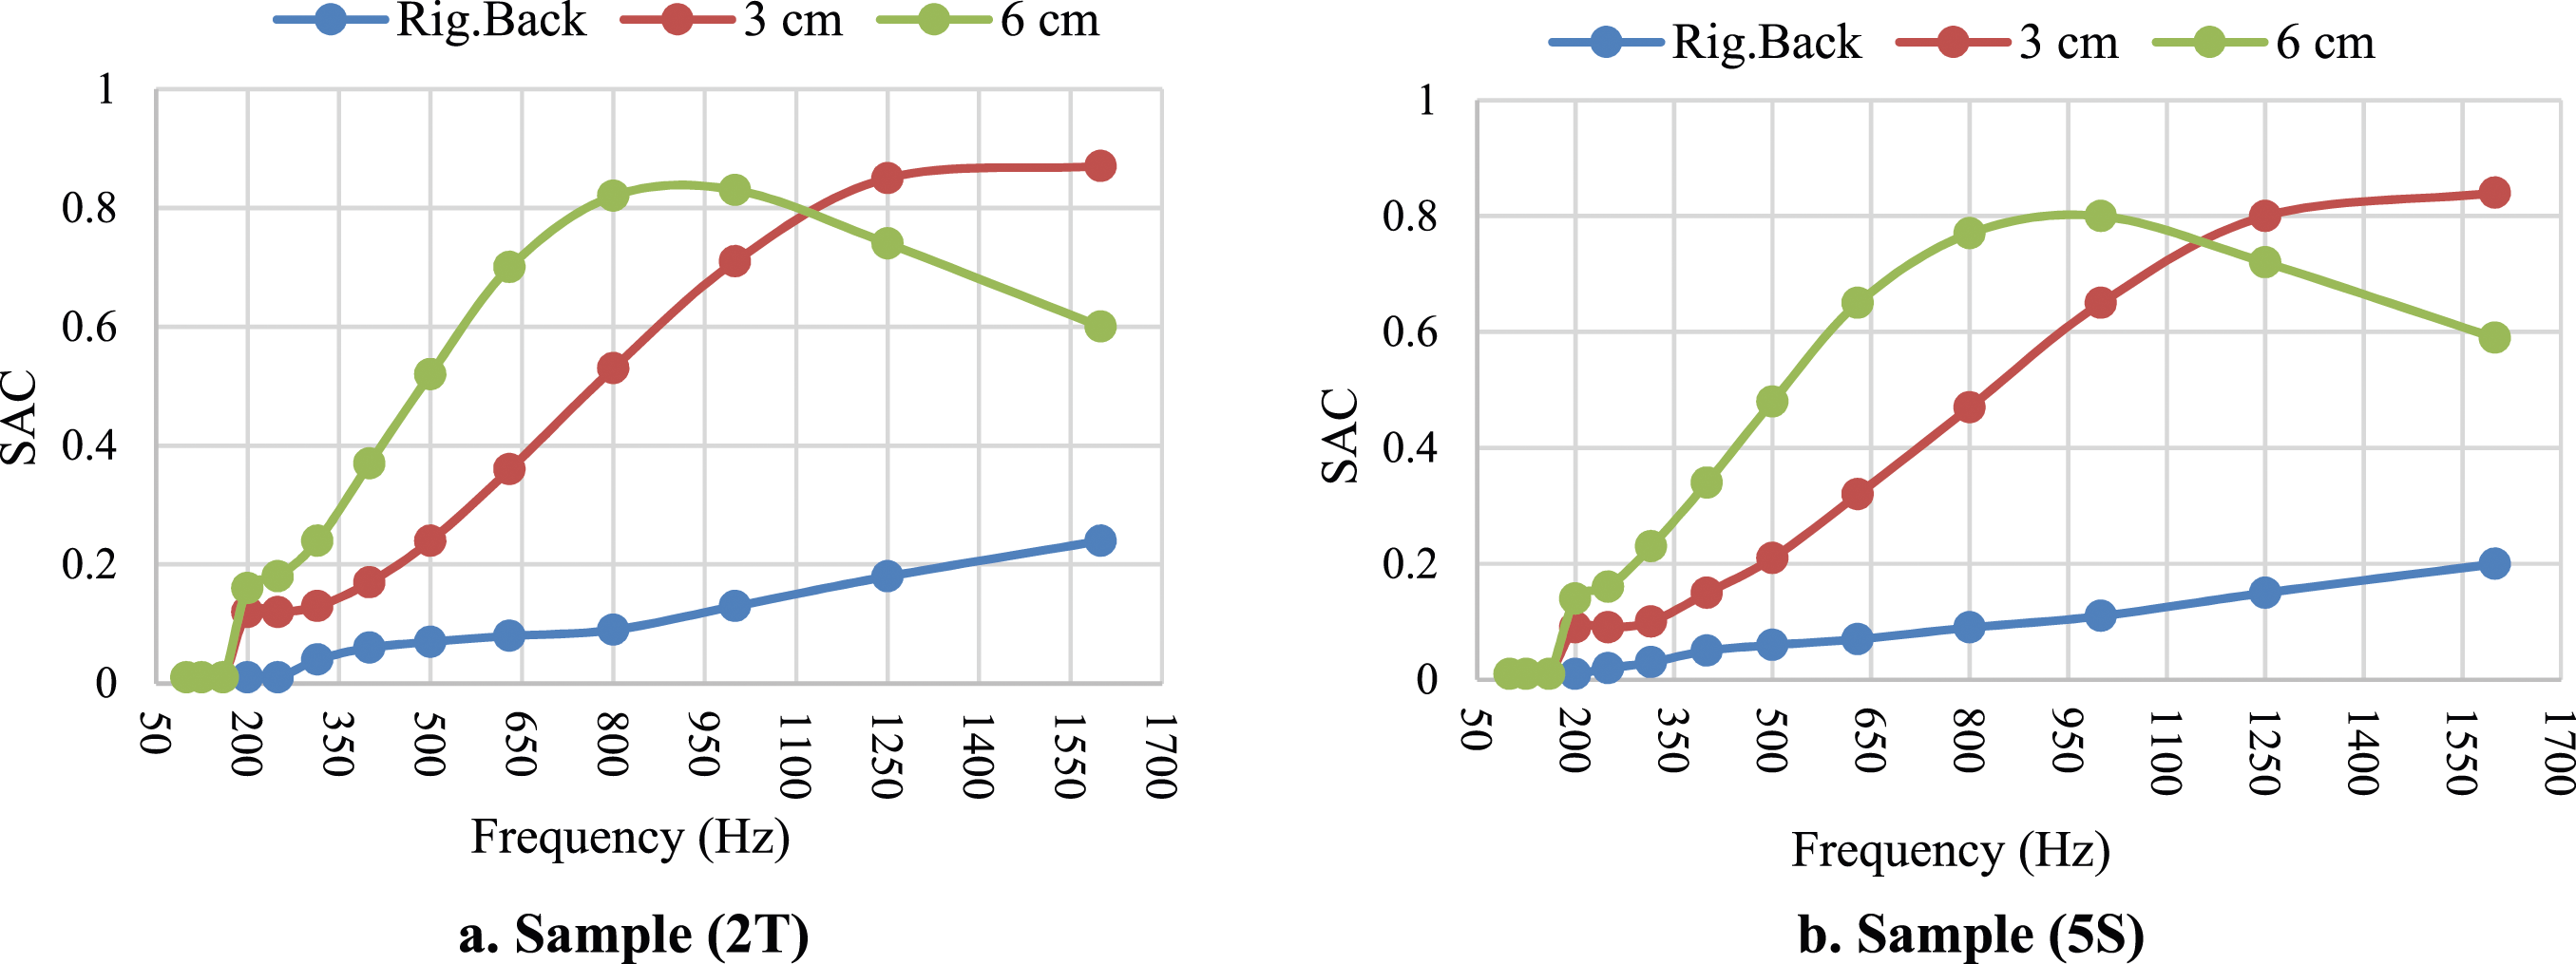
Furthermore, by increasing the air gap from 3 cm to 6 cm, the resonance frequency in case of 2T shifted from 1600 Hz (SAC 0.87) to 1000 Hz (SAC 0.83) which enhanced the sound absorption at low frequency. And in the case of 5S, the resonance frequency shifted from 1600 Hz (SAC 0.84) to 1000 Hz (SAC 0.8). By comparing between the results of 2T and 5S, it can be concluded that, the SAC of twill structure is higher than the sateen structure.
Figure 20 displays the SAC of 3T and 6S at three different mounting conditions, rigid backing, 3 cm and 6 cm air gaps. It is demonstrated from the figures that, leaving an air gap between the sample and the back plate of the tube, improved the SAC significantly. In other words, the averages of SAC of 3T at rigid backing, 3 cm and 6 cm in the frequency range from 100 Hz to 1600 Hz are 0.05, 0.29 and 0.41 respectively. Also for 6S sample, the averages of SAC are 0.04, 0.27 and 0.4 for rigid backing, 3 cm and 6 cm correspondingly. 100% Banana fibers filler with twill and sateen structures.
Moreover, by increasing the air gap from 3 cm to 6 cm, the resonance frequency in case of 3T shifted from 1600 Hz (SAC 0.88) to 1000 Hz (SAC 0.87) which enhanced the sound absorption at low frequency. And in the case of 6S, the resonance frequency shifted from 1600 Hz (SAC 0.85) to 1000 Hz (SAC 0.85). By comparing between the results of 3T and 6S, it can be concluded that, the SAC of twill structure is higher than the sateen structure.
Effect of type of filler on SAC at rigid backing condition
Figure 21 displays the SAC values of four different filling conditions at rigid backing; without filler, 100% mini Styrofoam balls, 50% mini Styrofoam balls and 50% Banana fibers, and 100% Banana fibers with twill and sateen structure. It is demonstrated from Figure 21(a), adding filler in twill structure improved the SAC significantly. In other words, the averages of SAC of 2T12, 1T, 2T and 3T in the frequency range from 500 Hz to 6300 Hz are 0.32, 0.42, 0.43 and 0.38 respectively. These results mean that, the combination between Styrofoam balls and banana fibers is the best absorbing material as filler with twill structure. In addition, by adding this filler in case of 2T, the resonance frequency shifted from 6300 Hz (SAC 0.93) to 4000 Hz (SAC 0.93) compared to 2T12 (without filler). Comparison of different fillers in twill and sateen structure.
Moreover, it is revealed from Figure 21(b), altering the type of filler in sateen structure enhanced the SAC significantly. In other meaning, the averages of SAC of 2S12, 4S, 5S and 6S in the frequency range from 500 Hz to 6300 Hz are 0.3, 0.39, 0.4 and 0.34 correspondingly. It can be concluded that, banana fibers is the best filler which enhanced the SAC with sateen structure.
Figure 22 depicts the effect of type of fillers on SAC, air permeability, thermal conductivity and thickness of fabric samples. The best sample of thermal insulation is (3T) due to its lower thermal conductivity which indicates to its availability to be as curtains, blankets or floor coverings. On the other hand, (2T) recorded (SAC 0.274) which means that it is considered as an absorbing material for sound waves.
42
In other words, twill structure with a combination of 50% mini Styrofoam balls and 50% Banana fibers is suitable for thermal insulation applications in home furnishings. Banana fibers as a filler of twill fabric structure enhance the sound absorption performance. Effect of type of filler on fabric properties.
Radar chart according to the filler type at rigid backing condition
Ranking of the radar chart area according the filler type.


Radar chart area according to the filler type.
Conclusion
This paper aims to investigate the effect of fabric factors, air gap back the fabric samples in the impedance tube, different type of fillers on air permeability, thermal conductivity and sound absorption performance. Air permeability is negatively correlated to the thermal conductivity which means higher values of air permeability leads to higher thermal insulation. Fabric thickness is negatively correlated to thermal conductivity whereas lower thickness may guarantee more air molecules which make as barriers and thermal insulators. Sateen weave structure with single layer is suitable for curtains due to higher air permeability, lower thickness, higher thermal insulation and higher sound absorption.
On the other hand, by increasing the number of fabric layers of the optimal samples (T12 and S12), the values of SAC improved at low and high frequencies of sound waves. Moreover, by increasing the air gap between the back plate of the impedance tube and fabric samples, SAC values improved due to the presence of air molecules results in more friction with sound waves and higher sound attenuation. Banana fibers are the optimal fillers to form sound absorbing materials in home furnishing applications such as blankets or pillows.
In addition, the sewing direction and the type stitch recorded a significant effect on the sewing performance. Warp direction with twill fabric recorded higher sewing performance compared to the weft direction and sateen wave structure.
According the radar chart, for single layer, sateen weave structure with 12 picks per inch is the best sample of air permeability, thermal insulation and sound absorption. For multilayers of fabric, double layer of twill weave structure is the optimal sample of lower thickness, higher thermal insulation and higher sound absorption. The banana fibers 100% as filler with twill weave structure is the best sound absorbing material compared to the other fillers.
Footnotes
Declaration of conflicting interests
The author(s) declared no potential conflicts of interest with respect to the research, authorship, and/or publication of this article.
Funding
The author(s) received no financial support for the research, authorship, and/or publication of this article.