
Abstract
Plaited jersey fabrics are always engineered to enhance the thermal conductivity characteristics, providing thermal equilibrium among the wearer and clothing during hot weather. These can also be architected with higher thermal resistance/heat insulation characteristics and is a crucial area of interest; however there isn’t any significant literature reporting this. The study focuses on developing plaited jersey gloves using Thermolite®, acrylic, and wool yarns in alternative main and plaiting configurations for winterwear. Thermal characterizations were conducted to ascertain heat and mass transfer properties, such as fluid transmission and thermal resistance. Infrared (IR) imaging visualized heat retention in terms of temperature gradients. Mechanical characteristics, such as pilling and bursting, were assessed to determine the gloves durability to physical abrasions and stresses. Thermolite® knitted gloves possessed superior heat and mass transfer properties with improved fluid transmission and thermal resistance. Infrared imaging revealed highest body temperature rise of 34.43oC for Thermolite® , and mechanical properties were also found adequate. Fluid transfer (air permeability) was acquired highest for wool samples (1770 mm/sec); however, Thermolite® exhibited 28% lower air permeability than wool, validating its heat retention. Thermolite® knits with the lowest areal density of 226 g/m2 and the smoothest Thermolite® surface had the highest OMMC (overall moisture management capacity) index of 0.46 due to generated capillaries. The statistical analysis of the characterization data indicated the significance (p-value <0.05) of the main and plating yarns, proving the plaiting a solution to achieve desired heat and mass transfer characteristics.
Introduction
Knitted fabrics engineered through interlooping yarns are chiefly known for superior comfort characteristics provided by soft and resilient interloped architectures. 1 Comfort is the state of not feeling displeasure, keeping someone in balanced conditions. 2 Textile and clothing materials comfort is justified using four primary attributes, that is, thermos-physiological, tactile, garment fit, and psychological comfort characteristics.3,4 Thermo-physiological comfort termed as heat and mass transfer capability is the primary customer requirement and is necessary for clothing to maintain the body heat balance. 5 Air permeability, thermal resistance, and water vapour permeability are the necessary thermal parameters. However, mechanical performance is also essential in describing knitted fabric quality. Pilling and bursting characteristics are significantly tested in vitro performance parameters. 6 Different knitted structural derivatives are fabricated to ensure the desired heat, mass transfer, and performance attributes; pique, honeycomb, and cross miss are the most used structural alterations. 7 Similarly, speciality knitting techniques enable engineers to obtain both thermal and mechanical performance simultaneously. 8 Usually, plaited jersey fabrics are an integral component of sportswear, knitted with variable main and plaiting yarns of hydrophilic and hydrophobic natures, improving the fluid transmission and thermal characteristics w. r.t to summer wear.9,10 However, there also comes a possibility of developing plaited textiles suitable for the cold environment, which is the context of this research.
Md. Saiful Hoque et al.’s study established a statistically significant relationship between fabric structure and material types with comfort and mechanical behaviors are suitable for polyester; however, the thermal comfort was experienced viable for cotton knits. 11 H.G. Atasağuna et al.’s investigations report that viloft/Coolmax® blended yarns suitable for knitted summer sportswear offer viable moisture management characteristics. 12 Aleksandra Ivanovska et al. found that pure cotton knitted fabrics have better moisture management and warm/cool feelings than elastane-plaited jersey fabrics; the comfort attributes further decreased after wet treatments. 13 Synthetic and regenerated have been introduced in the market with better comfort characteristics than natural ones; Coolmax® and Thermolite® possess superior air permeabilities and wicking due to micro-channels than wool and cotton fibers. 14 Microfibers induce better moisture management characteristics in knitted fabrics due to large fiber surface areas and moisture contact regions. 15 Muhammad Zaman Khan et al. found hybrid plaited knitted fabrics gifting improved moisture transportation properties; however, air permeability was greater for plain jersey fabrics. 16 Plaited jersey fabrics with modal knitted faces and micro-polyester on the back have excellent moisture and heat transmission characteristics and decent pilling performance. 17 However, increasing elastane yarn percentages in lycra-plaited jersey fabrics increases fabric thickness, leading to less thermal conductivity, air permeability, and water vapor transmission. 18 Rashid Masood et al. reported that Thermolite® knitted interlock fabrics have better thermal insulation properties than cotton interlock fabrics, hence are preferred for seasonal wear. 1 Double-layered interlock fabrics showed increased thermal resistance with increased fabric thickness and loop length governed by entrapped air between fabric pores. 19 Though the literature comprises valuable studies on thermal conductivity and fluid transportation enhancement of plaited fabrics for summer wear applications; however, the experimental investigation reporting thermal insulation characteristics enhancement of plaited fabrics to be employed for winter garments still finds the gap. Hence, the research focuses on developing plaited jersey gloves using Thermolite® , acrylic, and wool. Thermal characterizations have been performed to analyze heat and mass transfer properties using advanced IR imaging techniques with textile thermal comfort testing. Data has been statistically analyzed with heatmap visualization and contour plots analysis, relating the thermal characterizations with calculated loop pores area and perimeter on Digimizer.
Materials & methods
Knitted specimens were engineered into gloves anatomy. Gloves are categorized according to size and fabric construction. In gloves engineering, terry loops and plaited knitted structures are most employed. Terry incorporates hanging loops on the fabric back, and the plaiting is accomplished by concurrently passing two yarns through a single needle hook, with one yarn on the technical face and the other on the back. Figure 1 depicts the animated loops topology of plaited jersey fabrics conjured up with the SHIMA SEKI® APEX-III programming module. Acrylic, wool, and Thermolite® yarns were periodically employed as the main knitting and plaiting yarns. Acrylic is a synthetic fiber offering properties equivalent to wool fibers. According to the ISO definition, the fiber comprises at least 85% acrylonitrile and is free radical polymerized through the acrylonitrile and comonomers. Spinning can be performed using both wet and dry spinning techniques. Acrylic offers better dimensional and mechanical stability than wool and promotes thermal insulation, hence is being used as a wool replacement in winter wear.
20
Wool being a protein-based natural fiber is obtained from sheep and lamb hairs. Wool fibers possess an inherently crimped structure with raised scales on the surface, responsible for higher thermal resistance values of wool. Wool fibers are classified according to sheared animal breeds and the part of the body which is cropped.21,22 Thermolite® is a synthetic fiber engineered from polyester, offering excellent insulation properties. The fiber can provide warmth without creating bulk like conventionally used insulative materials. The hollow architecture allows Thermolite® to entrap air, providing viable thermal resistance even in wet conditions.
23
Physical properties of utilized materials have been shown in Table 1. Using a full factorial design of experiments, there were nine experimental runs through employing the above-discussed three yarns as main and alternatively plaiting yarn. Table 2 and Table 3 highlight the experimental factor, levels, and design of the experiment used in the research. Plaiting animations: (a) V-bed alignments, (b) plaiting feeders arrangement, (c) technical back, and (d) technical front. Dry state physical characteristics of used material. Experimental factors and levels. Design of experiment.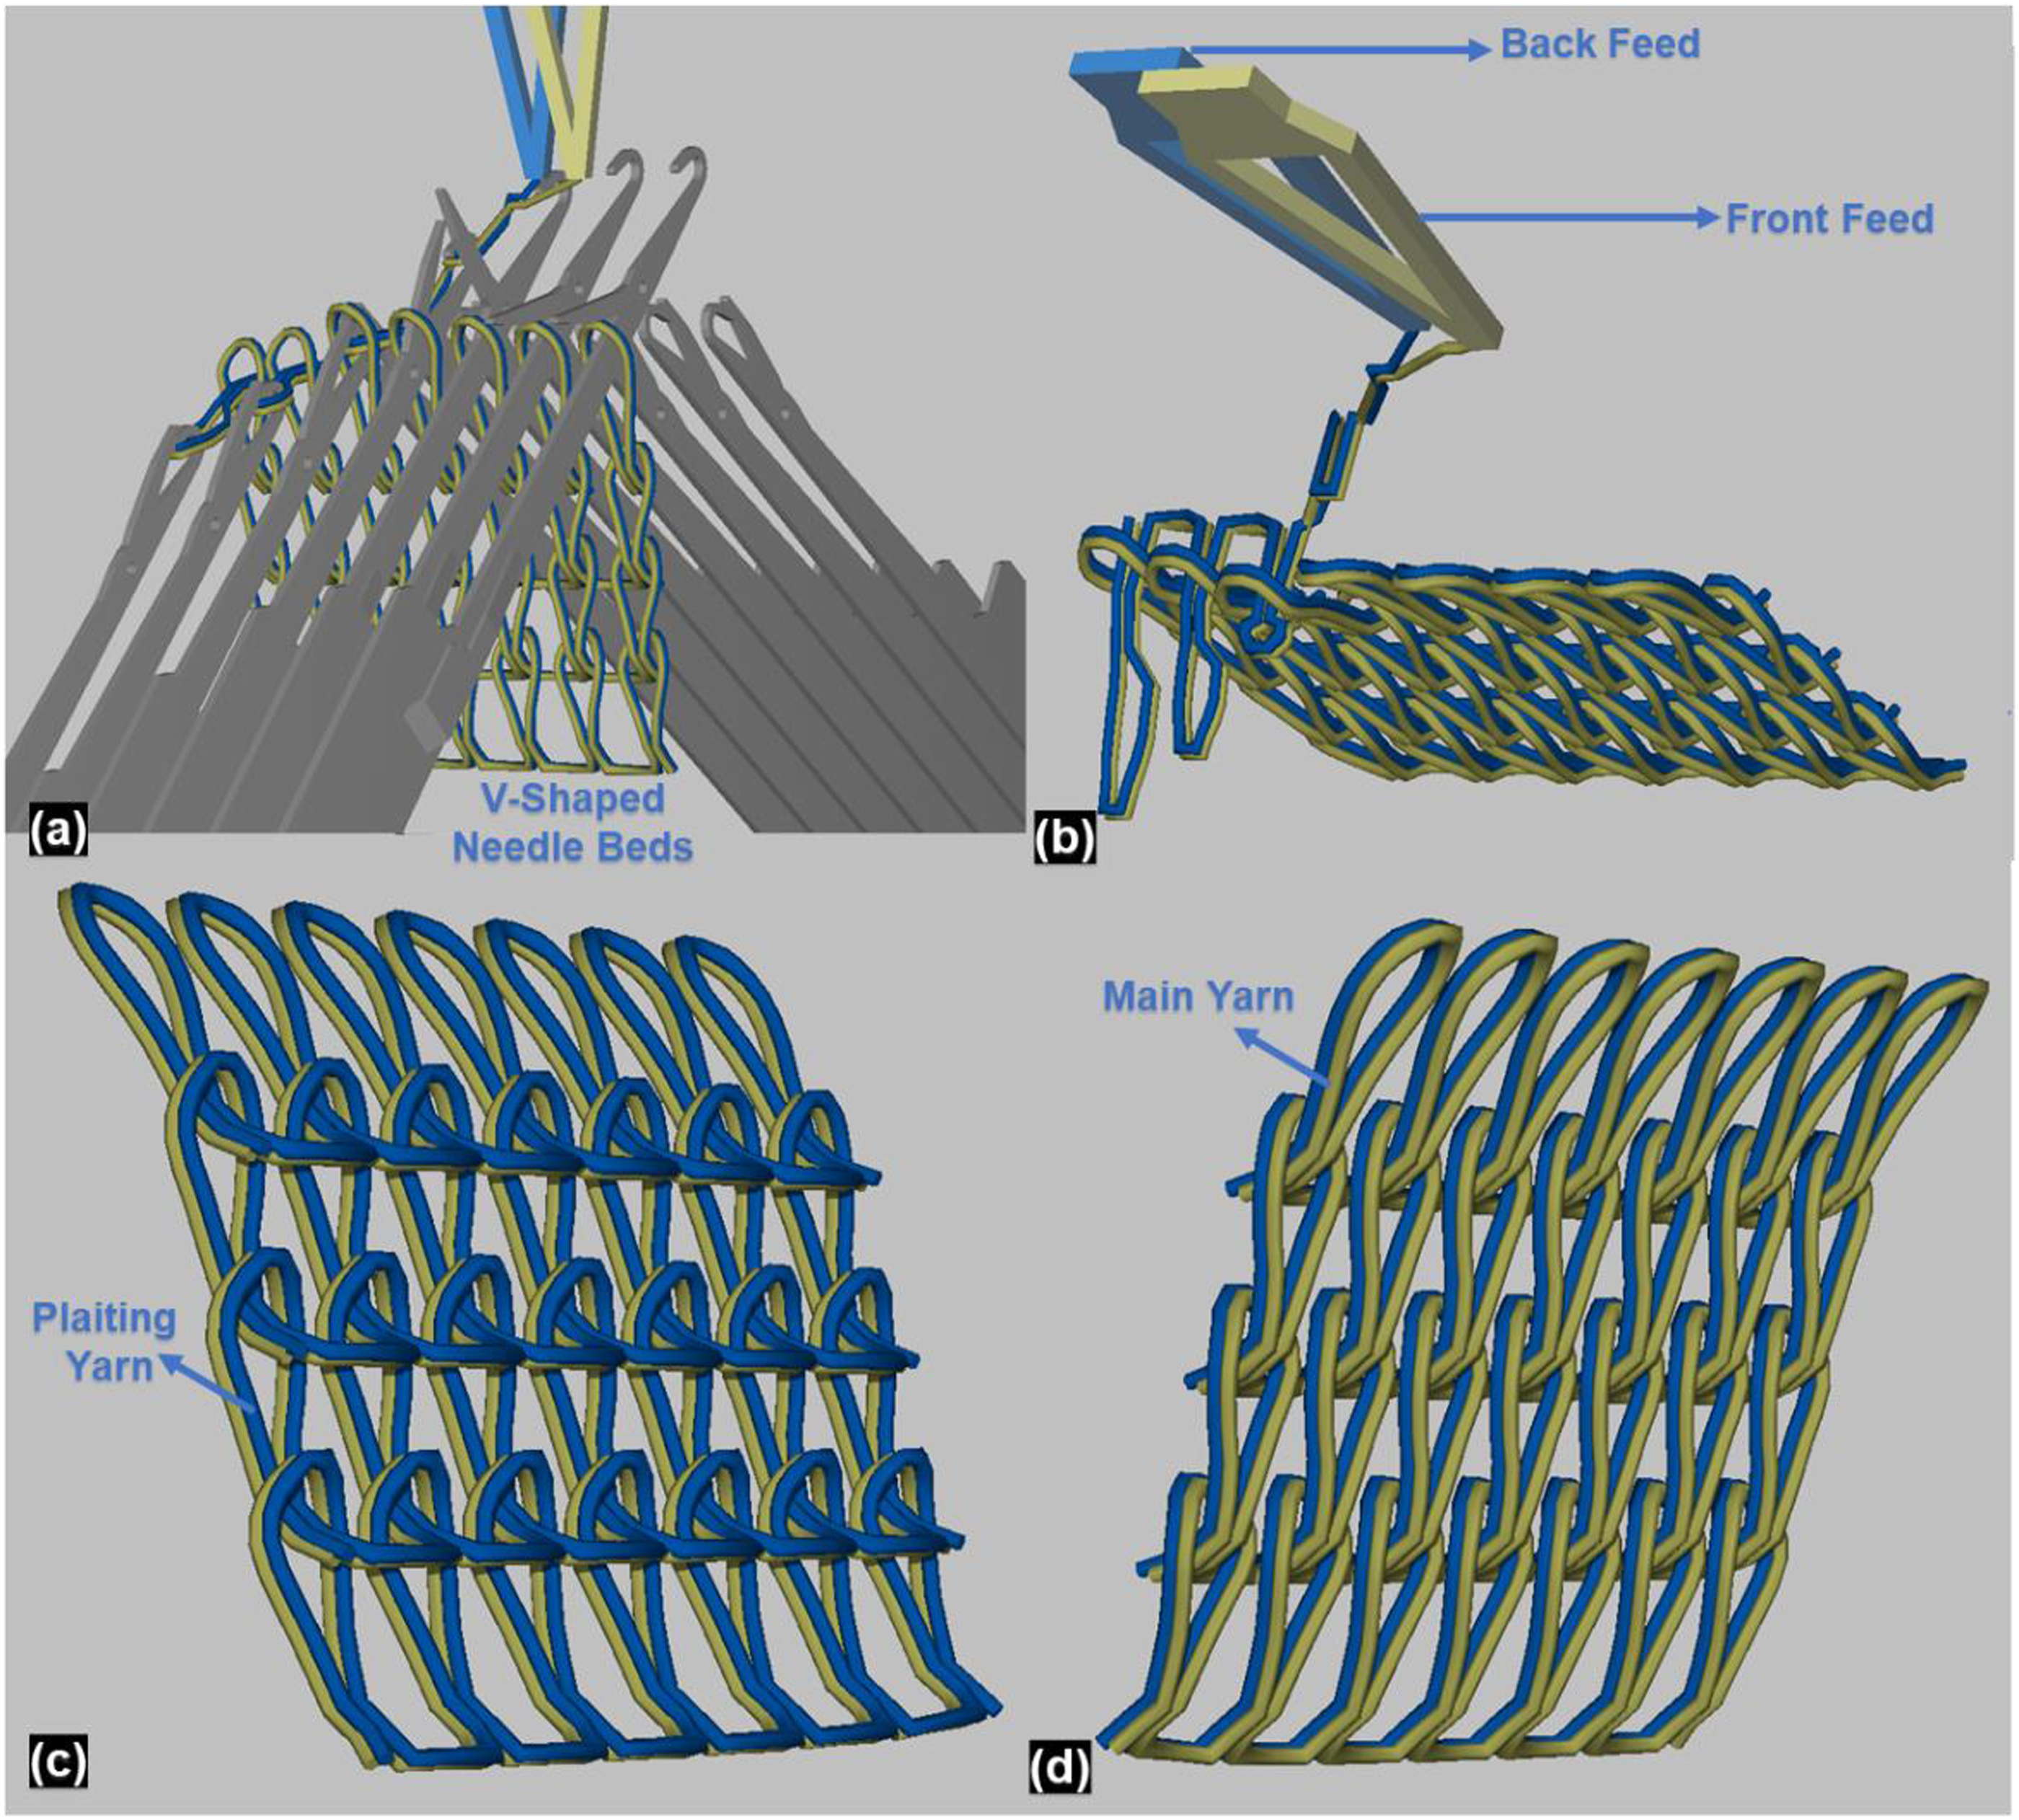


Knitting was performed on SHIMA SFG-I gloves knitting machine having 13 gauge and 156 needles on both beds with V-shaped alignment. The bed alignment is shown in Figure 1(a). Machine comprised of electronic knitting CAM-carriage system capable of knitting two courses in a cycle. System was activated through solenoid activators controlled by computer programming. The backside creel provided support to yarn cones, and spring disc tensioners worked to provide optimum tension to the yarn. Yarn feeders were employed to supply the yarn evenly to knitting needles; however, the gloves’ architecture, including fabric structure and size, was controlled through a programming panel. The described machine elements are shown in Figure 2. After knitting, the specimens were dry, relaxed for 24 h, rinsed with hot water, and sent for characterization. Plaiting machine elements.
Characterization
Standard characterization methods.

Results & discussion
Physical parameters
Physical parameters of knitted gloves include the number of wales and courses per inch, stitch density, length, and areal fabric density. Such estimated physical characteristics are essential for explaining the characterization trends, that is, the tightness and looseness of fabric can support air permeability patterns. The number of wales and courses per inch is a measure of vertical columns and horizontal rows of knitted loops in one-inch dimension; however, the stitch density describes the number of loops in a specific area and is determined by multiplying the number of wales and courses per inch. Stitch length measures the amount of yarn consumed for a single loop construction. Fabric areal density is also the number of grams per square meter area (GSM). The physical parameters are calculated using individual methods; however, they are related to each other in practical situations. Figure 3 shows the correlation of calculated physical parameters, and the respective values can be observed in Table 5. Number of wales and courses per inch remained between 16 and 17 for wales and 21 to 22 for the courses. The slight variation occurred due to the differential surface frictions of constituent fibers in utilized yarns. Different friction gradients led to different shrinkages, and the number of wales and courses per inch varied; however, still, the variation was in a controlled and considerable range. The stitch length of the knitted specimens ranged between 0.60 cm and 0.62 cm; the gloves knitting machine comprised of negative yarn feeding system; hence the stitch length couldn’t be kept constant. Historically the stitch length and GSM are inversely related, and the same relation can be observed from the graph in Figure 3(b). Specimens having lower stitch length values exhibited higher GSM values keeping the yarn linear density constant. Stitch density was also influential in defining GSM; hence the samples with higher stitch density values had higher GSM. Physical parameters plots: (a) Wales and courses per inch & (b) stitch length and GSM. Physical parameters of knitted fabrics.

Thermal characterization
Fluid transmission characteristics
Fluid transfer capability of gloves/fabrics is a necessary factor in determining their capability to maintain body heat balance. Air permeability and overall moisture management characteristics (OMMC) are significant tests to verify the characteristics. Air permeability measures the laminar flow of air under standard conditions, and OMMC includes wetting time, absorption rate, and transmission capability. Figure 4 illustrates the air permeability and OMMC values of developed plaited fabrics. Air permeability is the factor of knitted fabric’s tightness factor, and porosity.
24
W/W specimen with higher porosity indicated by its lower stitch density exhibited a higher air permeability of 1770 mm/sec. W/T specimen showed the second highest air permeability of 1590 mm/sec, 10.16% lower than W/W. However, the T/W had a 28.25% less air permeability value than W/T fabric, showing the significance of yarn position on the main and plaiting feeder. Although sole Thermolite® knitted fabrics possess higher air permeability due to their hollow core and smooth cross-section, hence in plaited fabrics, the wool also outperformed.
25
A/W and T/T possessed air permeability values of 1130 mm/sec and 1070 mm/sec, respectively. The behavior is supported by the lower GSM allowing more air transportation. Acrylic having its inherent low air permeability behaviors followed the trend in developed specimens, supported by higher GSM values. Hence compromised the W/A, W/T, and A/A air transportation capabilities, where A/A had 58.98% less air permeability than the highest value of W/W. Fluid transmission plots: (a) Air permeability & (b) OMMC index.
Similarly, the Wool and Thermolite® knitted plaited specimens outperformed in OMMC characteristics. Thermolite® fiber has a smooth cross-section, and its hollow core has excellent moisture management. 1 Hence T/T showed the highest OMMC index of 0.46, and W/W had a 13.04% less OMMC index than T/T, W/T and T/W exhibited the equivalent OMMC index of 0.39 and 0.38, respectively; inherent characteristics of Thermolite® and the physical parameters, that is, lower GSM, governed the behavior. Acrylic fiber being hydrophilic retains better wetting time and absorption, but poor transportation compromises the overall OMMC index. 26 A/W, W/A, and A/A showed the least OMMC index due to the above-discussed reason, and A/A has 36.95% less OMMC index than the higher one of T/T. Hence the fabrics comprising the Wool and Thermolite® with positions at main and plaiting architectures offer overall better air permeability and OMMC indices.
Thermal resistance
Thermal resistance quantifies the glove/fabric’s heat retention capability and is necessary to provide insulation characteristics in cold weather. In the standard characterization method, thermal resistance is an amount of heat (watts) required to raise the temperature of a square meter fabric to one K. More the fabric resistance, the more heat will be required. Figure 5 shows the thermal resistance behaviors of developed plaited samples. Thermolite® fiber comprises entrapped air in a hollow core structure, which is a good insulator for heat retention.
27
Hence, the T/T specimen exhibited the highest thermal resistance value of 0.023 m2K/W, Thermolite® yarns at both main and plaiting positions governed the phenomenon. Acrylic knitted fabrics with higher GSM and fewer porosities already exhibited poor fluid transportation characteristics; hence the rigid nature enhanced the thermal resistance of acrylic fabrics. The A/T knitted specimen had the second highest thermal resistance of 0.020m2K/W, 13.04% less than T/T fabric. W/W exhibited the least thermal resistance value of 0.0145m2K/W, depicting the least contribution of wool fiber towards the thermal performance enhancement of plaited fabrics. Although wool fiber has better thermal insulation properties than acrylic, the more porosity and least GSM compromised the thermal resistance of Wool and Wool plaited fabrics,
26
and the W/W had 36.95% less thermal resistance than T/T proving Thermolite® performance dominant over conventionally used expensive wool fiber. Similarly, the Thermolite® comprising W/T and T/W both showed the thermal resistance value of 0.0165m2K/W making Thermolite® yarn suitable with wool either on the main or plaiting yarn position. Thermal resistance plot.
IR imaging
Infrared imaging technology is an advanced temperature gradient measurement tool using thermal tomography devices.
28
It can capture electromagnetic range waves that aren’t visible to the naked eye. The amount of infrared radiation depends on the temperature of the captured body; more the temperature more infrared rays will be emitted from the body.
29
Different temperature gradients are captured in different color shades, cold bodies shift their spectrum towards the blue region and hot bodies towards the reddish region. Infrared images of developed specimens were taken twice, once at the time of wearing and the second after 5 minutes. Figure 6 shows the developed specimens’ initial and final infrared images with temperature gradient scales. It can be observed from infrared tomography that thermal resistance values directly correlate with temperature gradients. The T/T knitted specimens with the highest thermal resistance exhibited the highest temperature retention of 34.43oC (Figure 6(d)). The A/T fabric with the second highest thermal resistance retained 34.4oC after 5 minutes of wearing; the heat retention was 0.09% less than T/T temperature gradient (Figure 6(a)). T/W exhibited 0.47% less heat retention than the A/T specimen, as shown in Figure 6(h). Similarly, the A/W fabric indicated 34.34oC heat retention corresponding to its position in the thermal resistance trend. The W/W fabric with the least thermal resistance had poor heat retention of 33.54oC, 2.58% less than the highest recorded value of the T/T specimen (Figure 6(f)). While W/A exhibited the final temperature value of 34.00oC, a value 1.35% higher than W/W, W/A possessed thermal resistance higher than W/W (Figure 6(i)). The T/W and W/T fabrics having equal thermal resistance values showed infrared tomography temperatures of 34.24oC and 34.22oC, making the heat retention compared with the corresponding thermal resistance equivalency. Nevertheless, the Thermolite® knitted specimens having Thermolite® in either the main or plaiting yarn position exhibited better heat retention, and the trend decreased towards the acrylic and wool. Ir images: (a) A/T, (b) W/T, (c) A/W, (d) T/T, (e) T/A, (f) W/W, (g) A/A, (h) T/W, and (i) W/a.
Mechanical characterization
Bursting behaviors
Knitted fabrics being isotropic, can’t be mechanically characterized through tensile loadings; hence bidirectional force is applied to rupture the fabric, and the maximum required force is quantified as bursting strength. Figure 7(a) shows the gross and net bursting strengths of developed specimens, and Figure 7(b) illustrates the bursting time. Gross bursting strength shows the force required to rupture the fabric, including diaphragm-absorbed energy. The diaphragm absorbed a consistent 90 kPa energy, and the net bursting strength was obtained by subtracting the diaphragm energy from gross bursting strength. The bursting time of all knitted specimens positively correlated with net bursting strength. The T/T knitted fabric exhibited the highest net bursting strength of 409 kPa owing to the uniform fiber cross sections and polymeric structure.
30
The highest bursting time of 57.2sec was observed for T/T. Polyester knits show better bursting performance over acrylic and natural fibers; Thermolite® , a modified polyester form, followed the trend.
31
Acrylic, a synthetic fiber with more uniform behavior, had superior mechanical characteristics over wool. Hence acrylic knitted specimens showed higher net bursting strength than wool. The viable bursting performance of Thermolite® boosted the acrylic bursting strength, making the A/T and T/A knitted fabrics the second-highest performer with net bursting strengths of 344 kPa and 355 kPa, respectively. The values were almost 14.42% less than T/T, and bursting time was 47.8sec and 50.8sec, respectively, for A/T and T/A counterparts. Similarly, the A/A showed net bursting strength of 262 kPa, higher than all other wool and its acrylic plaited fabrics. The W/W knitted fabric exhibited the least net bursting strength of 129 kPa at the 28.4sec bursting time, the net bursting strength was 69.43%, and the bursting time was 50.34% lower than the best performing T/T fabric. Overall, the Thermolite® and acrylic knitted specimens with different main and plaiting yarn positions of Thermolite® , and acrylic showed better bursting performance over the wool and its acrylic and Thermolite® plaited specimens, making the Thermolite® preferable to be used in clothing. Bursting behaviors plots: (a) Bursting strength & (b) bursting time.
Pilling resistance
Pilling resistance quantifies the gloves/fabrics capability of resisting fiber balls and fuzz formation on its surface into pilling grades. Figure 8 highlights the pilling performance of developed specimens. Thermolite® and acrylic fibers have comparable pilling characteristics historically.
12
However, the Thermolite® knitted specimens outperformed acrylic knits. T/T knitted fabric exhibited the highest pilling resistance of grade 4, and A/A had the pilling grade of 3, a 25% less value than T/T. Better pilling resistance of Thermolite® boosted the performance of acrylic, governing the pilling grades of four for T/A and A/T knitted fabrics. Owing to the rough wool fiber surface and cross-sectional irregularities, W/W showed the least pilling resistance of grade 1, which was 75% less than the best-performing T/T specimen.
32
However, the W/T and T/W knitted fabrics possessed 66.67% and 60% higher pilling resistance than W/W knitted specimen. Similarly, the A/W exhibited a pilling grade of 2.5, making the hybrid plaiting technique suitable for enhancing the pilling resistance of inherently low-performing fibers. However, the Thermolite® and its plaited fabrics exhibited higher pilling resistance values than acrylic and wool-knitted specimens. In contrast, acrylic and its plaited samples had a pilling performance greater than wool and less than Thermolite®. Pilling resistance plot.
Microscopic analysis: Pore size estimation
The engineered plaited jersey gloves were analyzed under a digital light microscope (Olympus/SZ51) at 10x magnification. Figure 9 shows the micrographs of analyzed specimens. Changing material combinations of main and plaiting yarns governed significant changes in fabric porosities and structure tightness. Such structural parameters are directly correlated with discussed thermal and mechanical characterizations. Using the Digimizer® software, the intraloop and interloop pore sizes area and perimeter were calculated in μm2 and μm; respectively, the software employed a sort of finite element analysis while calculating desired parameters (Figure 10). Table 6 highlights the calculated pore areas and perimeters of plaited fabrics. The W/W knitted fabric exhibited the highest intraloop pore area of 0.600 μm2, with an interloop area of 0.421 μm2. The highest pore area and perimeter made fluid transmission characteristics higher, and thermal resistance was compromised as the pore area crossed the optimum limit to contribute toward thermal resistance. The W/T exhibited 6.17 % less intraloop pore area than T/W, hence having the second highest fluid transmission characteristics. T/T knitted fabric with intraloop and interloop area of 0.370 and 0.688 μm2 was found with optimum fabric porosity, offering the highest thermal resistance and IR temperature rises with air pockets.
33
Similarly, thermal characterizations of each specimen can be correlated with calculated pore area and perimeter. Microscopic images: (a) A/T, (b) W/T, (c) A/W, (d) T/T, (e) T/A, (f) W/W, (g) A/A, (h) T/W, and (i) W/a. (a) digimizer analysis window, (b) measurements, & (c) statistics. Pore area and perimeters.


Data analysis
Statistical data analysis is crucial for identifying correlations and trends in the experimental data. The input factors, physical parameters, and characterizations output values were statistically evaluated to determine the significance of substantiated input variables and to derive the trends of fabric characterizations considering the continuous physical parameters. Using MINITAB® 18 and Origin® 18 software, analysis of variance (ANOVA), contour plot analysis, and heatmap data visualization were done and are presented in the subsections below.
Analysis of variance (ANOVA)
ANOVA p-values.

Heatmap visualization
Heatmap analysis visualizes the output data (z-axis) color’s hue and intensity variation considering the change in input variables on the x and y-axis of plots. Color changes are divided into grids making a square or rectangular portion of each color. A secondary hue axis is provided to compare the desired studied region hue and interpret the output variable values in the grid. Figure 11 visualizes the heatmap analysis of thermal characterizations w. r.t continuous physical parameters of knitted fabrics. Both main and plaiting yarn were categorical input variables and influential in defining the knitted fabrics physical parameters. Hence the characterizations data’s heatmap visualization has been performed using continuous physical parameters, that is, wales/inch, courses/inch, areal density, and stitch length. Heatmaps: (a), (b), (c) thermal characteristics and wales and courses per inch, (d), (e), and (f) thermal characteristics areal density and stitch length.
Figure 11(a) describes the heatmap of air permeability considering the number of wales and courses per inch (WPI and CPI) on the x and y-axis. Air permeability less 922 has been experienced in initial value to 16.5 CPI and 21.5 WPI grid; however, 16.5 to 17 CPI and 20 to 21.5 WPI grid demonstrated air permeability between 922 and 698 mm/sec. Increasing WPI significantly influenced air permeability enhancement as WPI >21.5 grid exhibited an air permeability greater than 1304 mm/sec. Similarly, Figure 11(b) visualizes the heatmap of OMMC w. r.t WPI and CPI into four distinct grids, depicting that both fluid transmission characteristics possess equal distinctions in heatmap visualization. From origin/initial value to 16.5 CPI and 21.5 WPI grid least OMMC index (<0.3200) has been experienced due to less fiber medium ability for wetting, absorption and desorption phenomenon. However, the increasing WPI and CPI enhanced the OMMC index proving the hydrophilic nature of fibers more influential in OMMC index improvement rather than fabric porosity. The thermal resistance of plaited fabrics was highest in the initial grid from origin to 16.5 CPI, and 21.5 WPI grid due to more significant heat flow hindrance entrapped air in fabric pores (Figure 11(c)). Increasing the WPI grid dimension from 21.5 to 22 WPI and keeping the CPI dimension constant provided the optimum thermal resistance range of 0.021 to 0.027 m2K/W, proving entrapped air in pores as a more suitable solution to thermal conductivity rather than dense fabric development. A similar trend could be observed while moving CPI grid dimensions from 16.5 to 17 and keeping WPI from 20 to 21.5. Though increasing both WPI and CPI, the thermal resistance compromised as increasing solid medium increased through-thickness heat flow.
Stitch length and areal density (SL and GSM) on the x and y axis divided the thermal characterizations into six major grids rather than the previously discussed four heatmap grids. Automatic conversion of the characterizations data sheet into the matrix on Origin® 2018 made some hue in negative values of output variables which are not practically possible but are suitable in describing trends of z-axis output considering the change in the x and y-axis. According to calculated data, air permeability could be assertively least with SL <0.61 and GSM <255 (Figure 11(d)). However, the 0.615 to 0.630 SL and 200 to 255 GSM grid exhibits air permeability of 270 to 755 mm/sec, with maximum data near 755 mm/sec. The grids with SL >0615 and GSM >255 also exhibit the highest air permeabilities with values greater than 1240 mm/sec. Figure 11(e) visualizes the heatmap grids of OMMC index; for 0.60 to 0.615 SL and 200 to 255 GSM grid, the OMMC index wasn’t found to be much higher due to the least areal density for absorption and desorption of fluid. However, increasing areal density in other grids increased the OMMC index. The thermal resistance heatmap plot visualized in Figure 11(f) depicts more excellent thermal resistance in 0.60 to 0.615 SL and 200 to 255 GSM grid due to entrapped air in poses working as an insulating medium. Increasing SL from 0.615 and keeping GSM dimensions in the 200 to 325 GSM region, higher thermal resistance was experienced. At the same time, grids with increasing GSM from 325 and keeping SL dimensions constant in the>0.615 region show compromised thermal resistance due to a more solid medium for heat transfer.
Contour plot analysis
Contour plot graphically represents the z-values change w. r.t change in x and y values. The technique is similar to heatmap data visualization; instead of grids formation, continuous real-time trends are visualized considering the shift in continuous input variables of the x and y-axis. Figure 12 shows the contour plots of thermal characterizations keeping the physical parameters on the x and y axis, including the number of wales and courses per inch, areal density, and stitch length. Trends are like heatmap plots, and the reasoning of trends also corresponds to what was previously described in heatmap visualization. Figure 12(a) highlights a decrease in air permeability with increasing wales and courses per inch. The reddish hue in the top left corner depicts an exponential increase in air permeability when the WPI, least, and CPI are the most. OMMC index was exhibited higher for a higher number of WPI and CPI as indicated by greenish and reddish hues in the right corner of Figure 12(b); increased transportation medium caused efficient absorption and desorption of fluid through fibers leading to increased OMMC index. However, the thermal resistance contour plot in Figure 12(c) shows green and red hues in the bottom left corner, indicating an increase in thermal resistance with a smaller number of WPI and CPI, proving that air is a better insulation medium than densely knitted fabric. Figure 12(d) illustrates increasing air permeability with increasing stitch length and areal density highlighted by a yellow hue. However, the OMMC index had an intermittent color contour due to variable changes in fabric porosity corresponding to the areal density of plaited jersey fabrics (Figure 12(e)). Similarly, the yellow hue in Figure 12(f) ‘s bottom right corner illustrates increasing thermal resistance with higher stitch length and lower areal density fabrics due to entrapped air restricting heat transfer; however, a simultaneous increase in both stitch length and areal density decreased the thermal resistance because of porosity more than the optimum limit to govern thermal resistance. Contour plots: (a), (b), (c) thermal characteristics and wales and courses per inch, (d), (e), and (f) thermal characteristics areal density and stitch length.
Conclusion
Plaited jersey gloves knitted using two different materials and plaiting configurations serve as a solution to achieve tailorable heat and mass transfer attributes. The study proved sutibility of plaited jersey fabrics for winterwear application that is, gloves rather than conventional summer apparels. Thermolite® , being a synthetic fiber with a hollow core, resulted in lightweight fabric construction, and offered better fluid transmission characteristics, allowing the wearer’s residual body fluids to evacuate. Lower intraloop and highest interloop porosities of 0.370 and 0.688 μm2 respectively governed the least air permeability and highest OMMC index of T/T specimen. However, the hollow core of Thermolite® with entrapped air worked for improved thermal resistance over acrylic and wool-plaited fabrics. Moreover, Thermolite® plaited acrylic gloves exhibited effective heat resistance properties, whereas Thermolite® plaited wool gloves offered efficient fluid transfer characteristics. IR imaging asserting thermal resistance through body temperature variations conclusively demonstrated Thermolite® knits as better insulators, and the trend declined towards acrylic and wool fabrics. Statistical data analysis made material contribution significant in heat and mass tranfer characteristics variation with p-value <0.05, contour plots and heatmap visualization proved the discussed trends. Thus, the findings suggest that Thermolite® is a viable substitute for traditionally used wool fiber with a low cost, better heat and mass transfer, and mechanical performance. Similarly, the infrared imaging is also suitable to be considered for thermal behaviors analysis of knitted fabrics than conventional testing procedures.
Footnotes
Declaration of conflicting interests
The author(s) declared no potential conflicts of interest with respect to the research, authorship, and/or publication of this article.
Funding
The author(s) received no financial support for the research, authorship, and/or publication of this article.