
Abstract
This research aimed to create a UV sensor using photochromic pigment in nonwoven form and analyse its fatigue resistance under continuous ultraviolet (UV) light. The photochromic polymeric matrices consist of a photochromic pigment, a polymer, and a photo stabilizer, which enhance the stability of the photochromic systems under light exposure. As a base matrix, we used polyvinyl butyral. Then, we added different amounts of the photochromic pigment 5-chloro-1,3,3-trimethylspiro [indoline-2,3′-(3H) naphtho (2,1-b) (1,4)-oxazine]. We produce photochromic nonwovens by electrospinning a polymeric matrix solution with varying pigment concentrations. The study aimed to create a UV sensor with photochromic nanofibers that are very sensitive to light. It also tested how well it can degrade under continuous UV radiation by looking at its photo fatigue resistance under constant UV irradiation for its final use as a UV sensor material. Using FTIR, CRM, SEM, and XRD techniques, this study investigates the physiochemical properties and photodegradation behaviour of photochromic nonwovens and writes a report on it. The photo-light stability of photochromic materials is a major problem concerning its external stimuli in different substrate forms. It also looks at how well they resist photo-chemically towards the UV light. The fatigue resistance measurements were carried out using a FOTOCHROM3 spectrophotometer under continuous UV irradiance using two different modes. This study evaluated and reported their photodegradation behaviour in cyclic and continuous UV irradiance modes. The tests showed that the prepared photochromic system works well with photostability and can go through more than 20 exposure cycles, each with 100 min of UV light and intensity equal to 1/3 of the sun’s rays on a clear day. Given the PVB applications in our daily lives, it can serve as a UV sensor in numerous industrial applications. Photochromic nanofibers possessing excellent photosensitivity hold immense promise as optical rewritable devices and colourimetric-based UV sensors.
Introduction
Photochromism is a process where a compound undergoes reversible structural changes when exposed to ultraviolet (UV) light, transforming it from an uncolored state to a hued one. This phenomenon is utilised by applications such as sunglasses, lenses, coatings, UV-based sensors, and data storage devices. Photochromic materials offer benefits like instant colour transition and maintain their properties even after multiple switchings.1,2
Photochromic nanofibers are versatile materials in optical sensors, processing media, and smart windows or displays. Electrospinning, drawing, self-assembly, phase separation, and template synthesis are the methods used to produce them. Nanofibrous materials are ideal for optical and visual sensors due to their merits, fast response, and excellent sensitivity, thus increasing their reliability. Nanofibers are suitable as optical visual sensor materials because they have properties that make them more sensitive to light, such as high porosity, flexibility, high specific surface area, and very fast response. Furthermore, matrix material selectivity based on the targeted product is vital to ultra-sensitivity and quick response. Electrospinning offers ease of application, low cost, and the ability to use various polymers. Adding substrates such as drugs, cosmetics, and dyes to the polymer matrix can enhance functional properties. This study explores novel photochromic materials for optical data storage, intelligent materials, and biomedical devices to improve their effectiveness, sensitivity, and reversibility. When exposed to light, spiro-oxazine-based photochromic pigments in color-changing coatings, lenses, and intelligent materials undergo reversible color changes. The molecule’s central spirocarbon, linked to indoline and naphthoxazine rings, undergoes photoisomerization, causing the colour shift. Photochromic pigments based on spirooxazine offer advantages over conventional dyes and pigments, allowing frequent colour transitions and fading with UV light. They can be incorporated into fabrics, plastics, and polymers, attracting attention to new synthesis techniques and services.3–7
The industry invented poly (vinyl butyral) (PVB) in 1927, slightly before the use of electrospinning. It’s a biocompatible, non-toxic, and odourless polymer with good solubility in alcohol and inorganic materials, improved flexibility, and good adhesion to various substrates. You can customise it for specific applications by altering its hydrophilic and hydrophobic characteristics. Selecting the suitable solvent for poly (vinyl butyral) (PVB) electrospinning is crucial for producing uniform fibres with controlled bead formation. The study found that solvents like acetic acid, propanol, butanol, ethanol, and dimethyl formamide (DMF) improved spinning performance. A 10% w/w polymer solution with ethanol showed better fiber formation and uniform diameter, while controlling bead formation.8,9 Organic light-emitting diodes use poly (vinyl butyral) (PVB) as a cost-effective, non-toxic, and durable material because of its resistance to water and heat. Its low adsorption efficiency makes it an emerging material for wastewater treatment to remove toxic metals. 10 In electrospinning poly (vinyl butyral) (PVB), the solvent plays a crucial role in producing fibres with a uniform distribution, diameter, and control over bead formation. The previous study focused on solvent effects, solubility, and overall spinning performance. To spin the poly (vinyl butyral) polymer, you must use acetic acid, propanol, butanol, ethanol, and dimethyl formamide (DMF). The polymer solution with 10% w/w ethanol as a solvent produces better fibre formation and uniform fibre diameter. Ethanol, as an electrospinning solvent, also controls the formation of beads. 11
We used the poly (vinyl butyral) (PVB) polymer as the base matrix 12 and studied the photochromic component to produce photochromic nonwovens using electrospinning. The spiroxazine-based pigment has strong fatigue resistance because its open-coloured form intensifies coloration in the visible absorption band when exposed to a UV light source. Research on fatigue resistance might involve the pigment in polymeric form, applied to the surface of the textile fabric (photochromic prints), or in film form. This study involves doping a photochromic pigment in its polymeric state and preparing a photochromic polymeric solution matrix before spinning. Some factors affect the processing parameters that decide how the photochromic nanofiber material is made in the polymeric solution and production stage. Some ways to add the photochromic pigment as doping are to spread it out in the host polymeric matrix and keep its dispersive nature in the solution for a long time. The pigment is used in powder but not pure form because it is mixed with other additives during manufacturing. The molecular-level preparation of the photochromic solution and the solvent for the electrospinning process trigger this chemical reaction. Whether acidic or basic, the solvents used in the electrospinning process, when mixing the colourant, polymer, and solvents, tend to change the colour of the spinning solution compared to the original colour of the colourant. The aggregates of colourant in the polymeric solution tend to react. They are in small aggregate form, as the used colourant has a dispersive nature and does not dissolve one, thus forming the agglomeration inside the solution. To make a uniform and homogeneous fibrous material using the electrospinning method, we need to spin the homogeneous solution from the prepared photochromic polymeric solution. So, sonication was used before turning to create the uniform nanofiber photochromic system from the uniform solution with the colour in it. At the molecular level, the colourant aggregation within the polymer tends to react; additionally, it reacts with the solvent specific to the polymer, thereby influencing the polarity and attachment of individual elements in the resulting structure, which can be either hydrophobic or hydrophilic. During the preparation of the photochromic solution, the dye reacts with the polymer and solvent, resulting in an opaque solution. The non-dissolved dye molecules are visible at the bottom of the solution. Therefore, sonication was carried out to homogenise the resultant photochromic solution before spinning.
The photo-fatigue measurement methodology was developed, thus irradiating the photochromic system under the fluence of UV irradiance (the exposure time in seconds) and decoloration time to achieve the upper plateau of the typical curve of a photochromic cycle, as described by Solanki et al. for photochromic woven fabrics (photochromic prints) produced using screen-printing using the same photochromic pigment. 13 Photochromic prints photodegrade utilising the UV light source under continuous modes of measurement using the FOTOCHROM3 spectrophotometer in cyclic modes, with particular emphasis on the constant UV exposure pattern using spectroscopic data analysis performed by Solanki et al. 13 in their research on photochromic prints. Using Fourier transform infrared spectroscopy (FTIR), confocal Raman microscopy (CRM), scanning electron microscopy (SEM), and X-ray diffraction (XRD), this study looks at and reports on the physical and chemical properties of photochromic nonwovens. Furthermore, this study investigates the photo-fatigue resistance behaviour of photochromic nonwovens produced under two continuous UV irradiance modes: cyclic and long continuous. The photochromic nanofibrous form provides excellent photosensitivity, thus providing potential uses in optical rewritable storage devices and UV sensors based on colourimetry.
Materials and methods
Materials
The base substrate that inhibited the polymeric form’s photochromic pigment was poly (vinyl butyral) (PVB) (Figure 1(a).) (Mowital B 60H, Kuraray America Inc., USA; average molecular weight of 60,000 amu). Mowital is the trade name, with a capital B indicating the used butyraldehyde. The number refers to the degree of polymerization, and the suffix H suggests the degree of acetalization. The dynamic viscosity in 10% solution in ethanol is 160–260 mPa.s. The spirooxazine-based photochromic pigment Photopia Purple: 5-Chloro-1,3-dihydro-1,3,3-trimethylspiro [2H-indole-2,3′-(3H)naphth [2,1-b] (1,4) oxazine] (Figure 1(b)) was purchased in powder form from Matsui International Company, Inc., Japan, and 4-amino-2,2,6,6-tetramethylpiperidine (Figure 1(c)) was used as hindered amine stabiliser (HALS), purchased from Merck, Germany. (a). Polyvinyl butyral (PVB), (b). 5-Chloro-1,3-dihydro-1,3,3-trimethyl-spiro [2H-indole-2,3′-(3H) naphth [2,1-b] (1,4) oxazine], (c). 4-amino-2,2,6,6-tetramethylpiperidine.
Photochromic matrix solution preparation
The pilot study determined that the optimal concentration was a 10% weight solution of polyvinyl butyral (PVB) in ethanol (9:1 Et-OH: PVB; w/w). A poly (vinyl butyral) (PVB) polymeric solution with a molecular weight of 60,000 g mole−1 was diluted to 10% in ethanol (Et-OH). We used the photochromic pigment to create the photochromic polymeric solution. The pigment concentration range in polymeric solutions from 10 g.kg−1, 20 g.kg−1, 30 g.kg−1, 40 g.kg−1 and 50 g.kg−1 of 10% w/w of the utilised polymer to observe the photocoloration under its external stimuli. The range of HALS use is from 1%–1.5% of the weight of the used photochromic compound. 14 Therefore, to enhance the stabilisation of the photochromic system, the 4-amino-2,2,6,6-tetramethylpiperidine was added, and its concentration was adjusted to 1:10 of the weight of the utilised weight used for the pigment in production. The production process involved control over the spinning parameters. The chromic system was created utilising the electrospinning method, and a colour-changeable photochromic pigment called Photopia Purple was added to the prepared matrix solution with varying concentrations before the electrospinning.
Electrospinning of photochromic matrix solutions
The nanofiber structures were created utilising an electric field by wire-based electrospinning using the NAOSPIDER device (NS line 1WS500U) (Elmarco,CZ). A high-voltage source connected the string electrode (SE) and the collecting electrode (CE), which spun the photochromic polymeric matrix from the free surface. As shown in the diagram in Figure 2, the resultant nanofibers were collected on a spun-bond fabric that unwinds steadily towards the collector. Schematic illustration of the wire-based electrospinning.
The photochromic systems abbreviated as PVB_1PP (10 g.kg−1), PVB_2PP (20 g.kg−1), PVB_3PP (30 g.kg−1), PVB_4PP (40 g.kg−1) and PVB_5PP (50 g.kg−1). However, while carrying out the preliminary study, we observed the individual flakes and droplets on the collector with a higher pigment concentration; it was challenging to spin due to the dispersed solution. The pilot experimental study was carried out to overcome the limitations and optimise the spinning parameters. The electrospinning parameters used for the final spinning on the Nanospider device are the applied voltage of 40 kV, the distance between the electrode and the collector of 177 mm, the fabric uptake speed of 20 mm.min−1, the relative humidity of 50%, and the temperature of 23°C. We collected the resultant photochromic nonwovens on nonwoven fabric. The characterization of the photochromic systems and the photo-fatigue resistance behaviour of the produced photochromic systems have been reported in this work.
Fourier transform infrared spectroscopy
The chemical composition of the electrospun photochromic nonwovens was analysed using Fourier transform infrared spectroscopy (FTIR). The analyses were conducted in the range of 4000–500 cm−1 with a resolution of 4 cm−1 and 16 scans per sample, with three readings each at different positions of the samples. As the photochromic samples are too thin and very low in areal density, the photochromic nonwovens were folded and measured to record the spectra. We used a PerkinElmer Spectrum Two FTIR spectrometer for the experiment.
Confocal Raman microscopy
We collected the Raman spectra using Renishaw Raman spectroscopy. We used a rectangular glass plate to hold the sample for this test. We placed the sample in the holder. After adjusting the Raman instrument for accuracy, we chose the settings based on the sample type and information from published sources. The experiment parameters are as follows: We set the laser power to 1%, the accumulation to 5 or 20 iterations, the exposure time to 1 s, the laser wavelength to 532 nm (green), the grating to 830 I/mm (the default grating), the objective to 100x (for solid samples, we used the microscope to take pictures and then measured the spectra after focusing it), and the spectrum range to 2000 to 5000 cm−1. We adjusted the instrument using these parameters within the WiRE software, creating a baseline profile correction. Next, we carefully examined the samples under the microscope until we saw the focus and clear sample, after which we recorded the spectra and images in the software. The software rendered the microscopy images as screenshots added as supplemental data.
Scanning electron microscopy
A TESCAN Vega3 SB Scanning Electron Microscope (SEM) device examined the fibrous, layered, nonwoven forms. A layer of gold, 15 nm thick, was applied for sample preparation. The obtained images were processed using Image J software to determine the photochromic nonwoven typical fibre and bead distribution at 100x and 20x μm resolution scales. GraphPad PRISM 10 software was used to analyse and fit the received data.
X-ray diffraction
The D2 phaser XRD device from Bruker measured the diffraction signal using the photochromic pigment and the photochromic nonwovens. It employs the software to record the diffraction data in a .raw format file. The X-ray of magnitude 1.5418 Angstrom is produced in an evacuated tube, and it exits the tube and is incident on the samples, from which they are diffracted into the LynxEye XE-T detector. The beam passes through the slit width of 0.2 nm; the measuring start values are 10 2theta - 90 2theta, with an increment of 0.02 2theta. It tells us the beam’s angle; a wider slit corresponds to high energy with broader peaks, whereas a smaller slit gives less energy but better resolution. The XRD of photochromic pigment and photochromic nonwovens was conducted to observe the crystallinity changes in the nonwoven form.
Photo-fatigue resistance measurements using a FOTOCHROM3
We studied the photodegradation behavior of photochromic systems using a spectrophotometer known as FOTOCHROM3. The device measures fatigue behavior in a cyclic and continuous mode of UV irradiance, which includes a UV light source for activation and a visible light source for relaxation. The device exposes samples to UV and visible light sources indefinitely, with irradiation time settings set in seconds, minutes, or hours. The photochromic cycle consists of UV ON (the UV light source irradiating the sample) and UV OFF (the sample irradiated under the visible light source). The continuous irradiance mode predicts photochromic behaviour, such as photochromic compounds’ coloration and decoloration properties. You can configure these parameters using the CHROMADYNAMIK software. The FOTOCHROM3 device measured a photochromic cycle’s kinetic curve (Figure 3), providing reflectance data for color value calculation and further analysis. The data was fitted using a one-phase association model and analysed using GraphPad Prism 10 software, resulting in a one-phase association model and plateau. General schematic illustration of FOTCHROM3 spectrophotometer and the photochromic cycle curve.
The fatigue measurement scenarios used for the experiment under cyclic and continuous mode for the PVB_1PP and PVB_5PP are as follows: 6000sE:6000sD for five cycles for four readings; cyclic mode; and 20 cycles in one measurement for extended continuous mode. (0000sE:0000sD; where s = seconds; E = exposure phase; and D = decay phase of a photochromic cycle curve). These fatigue scenario measurements were used for kinetic measurements using FOTOCHROM3. We designed them based on pre-measurements, ensuring that the photochromic curve reached the stable upper plateau of the growth phase curve. We conducted cyclic and extended continuous measurements of growth and decay phases across five UV irradiance cycles. The environmental conditions were 20°C ± 2°C and 40%–55% relative humidity. The UV dosage of the UV LED light source was measured using a specific wavelength of 365 nm with 736 μW.cm−2 for the exposure phase.
Results and discussions
Fourier transform infrared spectroscopy
We folded and tested the photochromic nonwovens to obtain stretching and bonding data from the samples due to their thinness and low areal density. The observed change in absorbance values of the photochromic pigment and the nonwovens are shown in Figure 4. The peak at 1161 cm−1 validates the stretching vibrations of the spirooxazine functional group Cspiro-O bond, while the peak at 1361 cm−1 corresponds to the symmetric bending of the C-H bond. The peak at 1719.5 cm−1 for PVB corresponds to C = O vibration in nonwoven form, whereas in its pure form, the band is 1605 cm−1; the minor shift implies the stability of the photochromic pigment doped inside the nonwoven form, and at the peaks range between at 2895.25 cm−1 which correspond to the vibration of pigment symmetrically stretching of bonds C-H, and the linear dependency absorbance versus the concentration (Figure 4) of the pigment with R2 = 0.92, p-value = .0096, which indicates the data are significant. The abbreviations are photochromic pigment = PP and poly (vinyl butyral) = PVB. Transmittance curves of the photochromic pigment and the photochromic nonwovens (left side) and absorbance versus concentration dependency (right side).
Confocal Raman microscopy
We carry out Raman spectroscopy to obtain information about the depth and structures of photochromic pigment and photochromic nonwovens. Figure 5, where the changes occur, displays the obtained Raman intensity peaks of the photochromic nonwovens and powdered pigment. The photochromic pigment shows the C-H valence vibrations of the functional group at 2953.07 cm−1 and 2902.93 cm−1, corresponding to the C-H aromatic stretching. In the nonwoven form of PVB blank, the band at 2915 cm−1 in the Raman spectra is the symmetric stretching vibration of the CH2 groups in the polymer backbone. Raman spectroscopy of the photochromic pigment and the photochromic nonwovens.
Scanning electron microscopy
Figure 6 shows the photochromic pigment and produced photochromic nonwovens long, smooth, and uniform fibrous shapes. Nanofibers that are thin and flat are present. However, the smooth, flat, and fibre diameters in a specific range of fibre diameter distribution in nm are all visible in the SEM images. The separation of the utilised polymer and the photochromic pigment in its dispersed form could be seen visually after the photochromic solution experiment. From the magnification images of photochromic systems at 100 μm resolution, the critical finding is that, while using the optimized electrospinning parameters for PVB nanofiber, we found that, while the sample did not form beads in the absence of photochromic pigment, it did so when the pigment concentration used inside a photochromic polymeric matrix, leading to numerous beads formations and the aggregation of both the pigment and the used polymer, poly (vinyl butyral) (PVB). SEM images of the photochromic nonwovens and the control polymer at 100x: (a) Photochromic pigment (b) PVB_1PP (c) PVB_2PP (d) PVB_3PP (e) PVB_4PP (f) PVB_5PP.
We observe the formation of the bead and its combination in various sizes and shapes to form flowers and how the ellipsoidal beads adhere to the after-fibre formation. The production of the bead occurs during the electrospinning of the photochromic polymeric solution. The absence of beads in the electrospinning parameter for the control sample suggests that the photochromic dye was responsible for their formation. Given the low molecular weight of the polymer, the dye and polymer concentration, and the final solution’s viscosity, it is probable that the dye and polymer formed these beads and lumps in a solid form. To a greater extent, the solution’s elasticity is the attributed reason for such bead production. Beads are more likely to form in fluids with a short relaxation time or low extensional viscosity. After holding the solution to extend the time before spinning, we saw the pigment particle deposits in colloidal solution form at the bottom of the solution during the spinning period. Double-check and shake the prepared solution thoroughly before applying it to the electrospinning apparatus. The stretching force of the photochromic polymeric solution is equal to the charge density on the electrospinning jet. Such beads arise because of the insufficient elongation of the matrix solution’s viscoelastic solution, which is caused by the initial charge density. First, a non-homogeneous photochromic polymeric solution during the pigment-doping stage causes this bead formation; second, the electrospinning voltage changes the characteristics of the solution. The solution dispersed more as the amount of photochromic pigment inside the solution increased. Even after the solution was homogeneous, the colloidal suspension developed; it did so after it rested for a specific amount of time. After the bead separates, the charge concentration at the end of the beads ensures that the dots’ fibre distribution is even and uniform after the fibre length. The data obtained using the SEM images at a 20 μm resolution scale forms the measured sample. It depicts the size of the bead production in photochromic systems, which ranges from 5 to 15 μm. According to the obtained SEM image, the photochromic pigment has an average size of 12.40 μm to 5.56 μm at a 20 μm resolution scale. The average fibre distribution of the photochromic system ranges from 400 nm to 1200 nm.
X-ray diffraction
According to the acquired XRD results of photochromic nonwovens, the influence of the photochromic pigment inside the polymeric matrix with increased content can be seen (Figure 7). While poly (vinyl butyral) (PVB), which is entirely amorphous, is found at 18.27°, the photochromic pigment, which is crystalline, is found at 16.09°. We observed a single peak in the XRD data gathered for the photochromic nonwovens, and with time, it became less sharp and broader than the pigment peak. Every reading’s raw data was first smoothed using a second-degree polynomial with 20 neighbours. Next, we fitted the data using a Lorentzian (Cauchy) distribution, which displays Lorentzian peaks with a single maximum peak that varies with the length of the periodicity. According to the best fit, the centre-width peak values show a linearly decreasing trend with increased pigment concentration (Figure 7), with an R2 = 0.87 and a p-value = .0206, and the data are significant. Using Bragg’s equations, the length of periodicity was calculated from the position of the peak maximum using the X-ray wavelength intensity of 1.5418 Angstrom; the d spacing, the crystallite size, and the lattice strain were calculated and listed as shown in Table 1. 2theta v/s concentration of pigment of the photochromic nonwovens. XRD analysis of the photochromic nonwovens data.
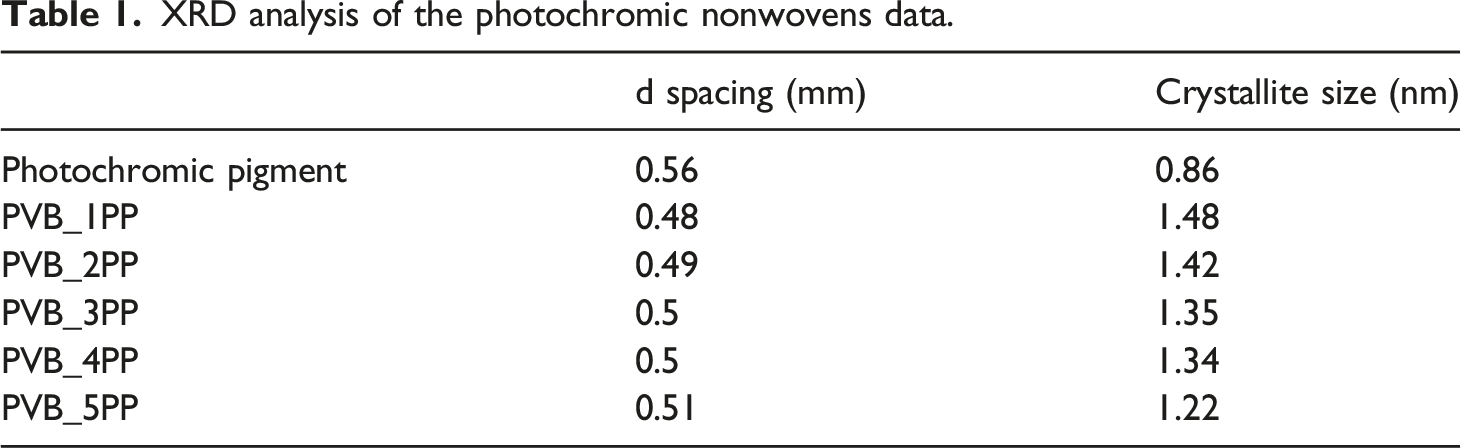
Photo-fatigue behaviour study of photochromic nonwovens
Photodegradation of photochromic nonwovens, a non-destructive process, involves the photoreaction between a polymer and a photochromic dye under UV light. This process initially speeds up the reaction, but reaching the photo-steady equilibrium state takes longer. More photo- and de-coloration time is required to achieve an ideal profile curve of a photochromic cycle. Photochromic compounds with chromophore species undergo molecular changes, transitioning from inert to coloured states. The colorability of photochromic materials is determined by detecting the change in reflectance values using a spectrophotometer called FOTOCHROM3. Oxidation is the leading cause of photochromic material deterioration. The FOTOCHROM3 device gives us the reflectance data changes to transform into colour value changes at the dominant wavelength for studying their fatigue behaviour. Photochromism causes a secondary reaction called fatigue, which gradually loses photochromic molecules due to photodegradation. The change in their reflectance values in inactive form (UV OFF) and active form (UV ON) modes of the photochromic systems is shown in Figure 8. Reflectance v/s wavelength of the photochromic systems.
Four main parameters were considered for the characterization of the coloured forms: the maximum absorption wavelength in the visible range (λmax) for the open form, the thermal fading rate (k), the colorability (K/Smax), and the fatigue resistance (t1/2). This study investigated photochromic systems’ fatigue behaviour and spectrokinetic parameters using cyclic and extended continuous modes. We used the constant mode for prolonged UV light source irradiation and outdoor sensing. The FOTOCHROM3 spectrophotometer was used to measure the photo-fatigue chromic behaviour of photochromic systems, which were irradiated continuously using natural daylight sources. The activating source’s low intensity allowed for a better study. The spectrokinetic analysis of a chromic system relies on the photochemical reaction and the gain of equilibrium or reaction in progress achieved after irradiating the chromophore with a specific UV light source to a particular wavelength, resulting in the observation of the induced photoisomer with longer half-life values.
Spectrokinetic data for the PVB_1PP chromic system.

Spectrokinetic data for the PVB_5PP chromic system.


Photo-fatigue resistance behaviour of the photochromic systems: Cyclic mode (left side) and Continuous mode (right side).

Photocoloration and its photodegradation PVB_5PP under the fluence of the UV source.
Conclusions
Durability and spectrum sensitivity are the main factors when evaluating the fatigue resistance of various photochromic materials. The study uses electrospinning to make photochromic nonwovens, testing their physiochemical properties and ability to resist photo fatigue in a nanofibrous structure. Sustained UV irradiation activates the chromophore, which is responsible for photostability. We successfully fabricated photochromic nonwovens using electrospinning with optimized spin parameters. The FTIR spectrum shows that both the functional group (Cspiro-O bond) of the photochromic pigment used for photochromic transitions and the acetyl group of the polyvinyl butyral polymer show a change in vibrations of the bonding. The linear dependency of the absorbance and the pigment concentration used in the photochromic systems. The confocal Raman microscope (CRM) confirms the pigment’s aromatic stretching, thus the pigment’s molecular depth and the photochromic nonwovens. The surface morphological SEM images confirm the bead formation in the photochromic nonwovens as the pigment concentration increases inside the photochromic solution matrix, leading to the non-homogeneity of the produced photochromic system. The pigment particles are non-uniform at different places in the produced nonwoven form. The size of the beads inside photochromic nonwovens usually varies from 5 to 15 μm, and the fibre diameter ranges from 400 to 1200 nm. The pigment’s XRD data shows its crystalline structure, and the pigment in the matrix gives the photochromic nonwovens their amorphous shape. In addition, the centre width of peaks (2theta values) of photochromic nonwovensshows linear decrease dependency with the used concentration. The photochromic system’s photodegradation behaviour shows a break in continuity using the cyclic mode of the photochromic systems, PVB_1PP and PVB_5PP; the % fading is 55.06% and 35.22%, respectively. Meanwhile, in extended continuous mode, it is 48.42% and 20.08%, respectively. Thus, it is recommended that the prolonged continuous measurement mode instead of cyclic modes be utilised to conduct photo-fatigue measurements of the photochromic systems.
Supplemental Material
Supplemental Material - Characterisation and photo-fatigue behaviour of UV-sensitive photochromic systems produced using electrospinning
Supplemental Material for Characterisation and photo-fatigue behaviour of UV-sensitive photochromic systems produced using electrospinning by Utkarshsinh Solanki, Martina Viková, Pavel Holec, Jakub Erben and Michal Vik in Journal of Industrial Textiles.
Footnotes
Acknowledgements
I acknowledge Dr Ali Tehrani, Department of Bioproducts and Biosystems, School of Chemical Engineering, Aalto University, Finland, for providing the opportunity to do my internship. I also acknowledge Dr Girish Chandra Tewari, Department of Chemistry and Material Science, School of Chemical Engineering, Aalto University, Finland, for providing the device for the XRD measurements.
Author’s contribution
Declaration of conflicting interests
The author(s) declared no potential conflicts of interest with respect to the research, authorship, and/or publication of this article.
Funding
The author(s) disclosed receipt of the following financial support for the research, authorship, and/or publication of this article: The authors acknowledge the project grant number SGS-2022-6039 for financial support from the Student Grant Competition of the Technical University of Liberec, Czech Republic.
Supplemental Material
Supplemental material for this article is available online.
References
Supplementary Material
Please find the following supplemental material available below.
For Open Access articles published under a Creative Commons License, all supplemental material carries the same license as the article it is associated with.
For non-Open Access articles published, all supplemental material carries a non-exclusive license, and permission requests for re-use of supplemental material or any part of supplemental material shall be sent directly to the copyright owner as specified in the copyright notice associated with the article.