
Abstract
Nowadays, electrically conductive textile materials are widely used also for sensing applications in addition to being used as antistatic, electromagnetic shielding, for creating smart textiles, etc. The main aim of this paper is to study the effect of tensile deformation applied on knitted fabrics on their electromagnetic shielding ability, electrical resistance, and porosity to gain knowledge for the construction of textile-based wireless strain sensors. For the experiment, silver-coated yarn was chosen to produce knitted fabrics with two different patterns and three levels of stitch densities. The uniaxial and biaxial deformation was applied to samples and at the same time, the change of electromagnetic shielding ability, electric resistance, and porosity of the sample set was evaluated. It can be summarized, that the vertical stretch has the highest positive effect on the electromagnetic shielding ability and the maximum shielding sensitivity is 12 % compared to other deformation types. In general, the electrical resistance decreases during increased stretch due to the increasing number of contacts between electrically conductive yarns, which causes a decrease in the contact resistance and also a decrease in total electrical resistance. The highest positive effect on the porosity of samples represents biaxial deformation. The finding that the overall shielding efficiency is positively influenced by the electrical conductivity of the sample and at the same time negatively influenced by the increasing porosity during tensile deformation was the motivation to construct a simple regression model for the prediction of the electromagnetic shielding ability of the sample during its extension.
Introduction
Textile is the second most crucial field in this world after agriculture for humans. Textile materials and structures have more comprehensive applications and use than only as clothing providing psychological and physiological comfort to humans in any climatic conditions. They have advantages like being flexible, more substantial, versatile, lighter, breathable, and tailored per requirement. Textile materials and composites are suitable for many applications based on their properties.
Currently, many electromagnetic shielding studies are using electro-conductive textile materials. Textile-based shields providing electromagnetic shielding are used more widely and commonly instead of metal screens and other traditional shielding materials because metal screening materials have many disadvantages, particularly high weight, corrosion problems, difficulty in adjusting the shielding effectiveness (SE), and limited mechanical flexibility. In contrast, textile materials are generally lighter (having lower density), more flexible, cheaper, 1 and in addition, they usually let air and water vapor through. Currently, many types of electrically conductive fibers, such as metal-coated fibers, metal fibers, carbon fiber-containing textiles, metal or conductive polymer-coated fabrics, etc., are available in the market.
In addition to the use of carbon fibers or metal fibers,2–7 coating fabrics/fibers with metals or conductive polymers represents another possibility to create electrically conductive fabrics/fibers while maintaining the desirable mechanical properties of the polymeric substrate. The commonly used metals including silver, nickel, and copper, and electroless plating are the most effective.8,9
Silver is an excellent electrical conductive metal with antibacterial, antimicrobial, thermal conductive, and biocompatible properties. The silver core weft yarn (Ag-coated PA filament core/cotton sheath) and silver staple fibre blended weft yarn (Ag-coated PA staple fibre/cotton fibre) was 3/1 twill weaved with cotton warp yarn was studied by Tohidi. 10 Fabric made of the core yarn has a relatively high SE of around 48 dB at 200 MHz frequency, and fabric made of the blended yarn has an SE of about 35 dB at the same frequency. The authors of the mentioned paper reported that the change in weft density significantly affects SE values for both kinds of fabrics.
Some studies reported that woven fabrics are more suitable for electromagnetic shielding applications. 11 However, besides the woven structures, which are interesting for their symmetrical grid-like structure, knitted samples are also often used for the EMI shielding wearable applications, because of their flexible structure. This unique property also predetermines their use as tension sensors. In the case of using electromagnetic radiation as an external stimulus, these sensors are wireless compared to traditional resistance-type textile sensors. Moreover, using knitting technology, it is possible to create special electrically conductive shapes surrounded by a non-conductive environment, which is also not possible by the weaving technique.
When studying the electro-mechanical behavior of electro-conductive textile structures, besides length resistance; the contact resistance is another interesting phenomenon that may affect the resulting electrical conductivity and related SE of the textile structure. The contact resistance is generated at the yarn–yarn interface. According to the contact resistance theory, 12 factors that predetermine the contact resistance are material resistivity, material hardness, number of contact points, and contact pressure between yarns.
The knit’s structure and pattern influence the knitted fabric’s deformation during stretching. The courses and wales are disturbed during fabric stretching, as seen in Figure 1. During wale-wise stretching (Figure 1(a)), the expansion of course at maximum (Cmax) and contraction of wale to a minimum (Wmin) is observed. During the course-wise stretching (Figure 1(b)), the wale extension until maximum (Wmax) and course contraction to a minimum (Cmin) occurs. During biaxial stretching of the knitted fabric, both the course and wale expand and are represented as course bias (Cb) and wale bias (Wb). The yarn contact points are shifting see a biaxial fabric stretching shown in Figure 1.13,14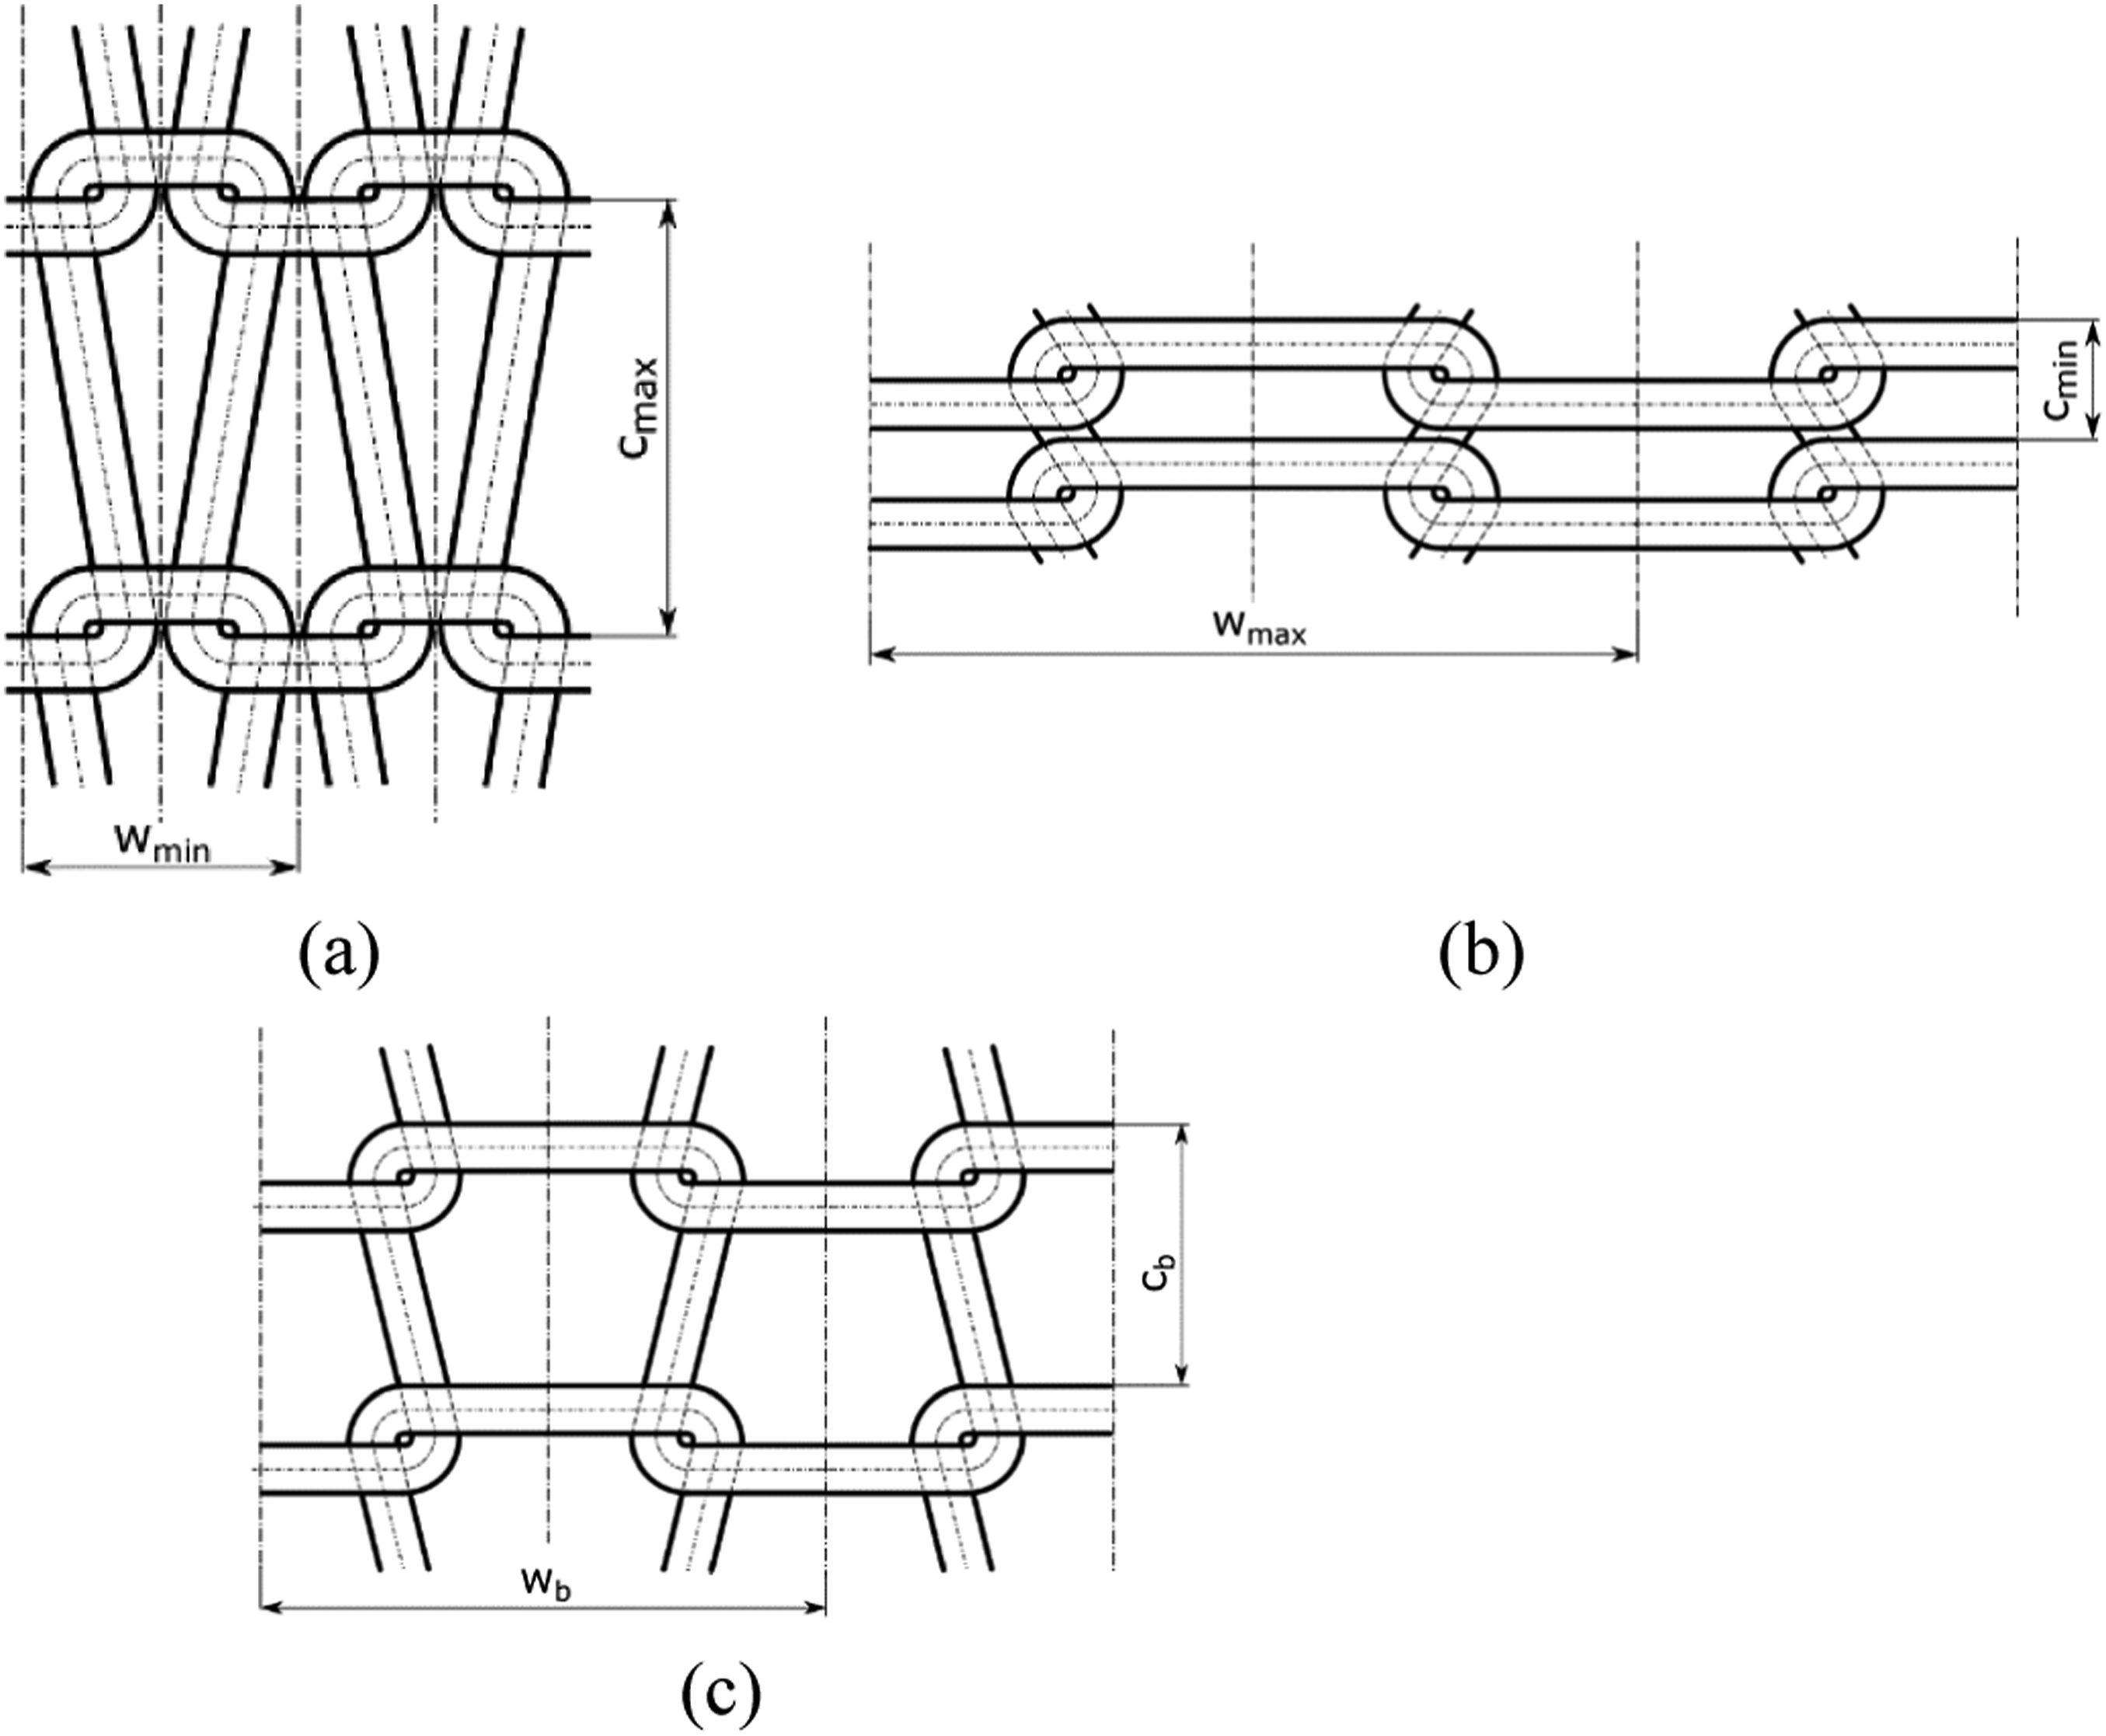
The course-wise extensibility of weft-knitted fabrics is well known. This phenomenon is given by the position of the interlacing points and the fact that the yarn is led through the knitting in the direction of the rows. When the knitted fabric is expanded in a course-wise direction, almost all yarn used to make the row is stretched. Meanwhile, the two legs of the loop limit the stretch in the wale-wise direction. When we compare the stretching of single jersey and 1 × 1 rib knitted fabrics in the direction of the courses, the 1 × 1 rib structure is significantly more stretchy, as noticed by Spencer. 16 Demboski 15 co-knitted the glass and polypropylene yarns using a 1 × 1 rib structure, and the fabric was stretched in uniaxial and biaxial directions to test its tensile strength, bending rigidity, and impact resistance. The tensile strength of the fabric in the wale direction was higher compared with tensile strength measured using the course direction stretching. During biaxial stretching, the wale direction exhibited more tensile stress than the course direction.
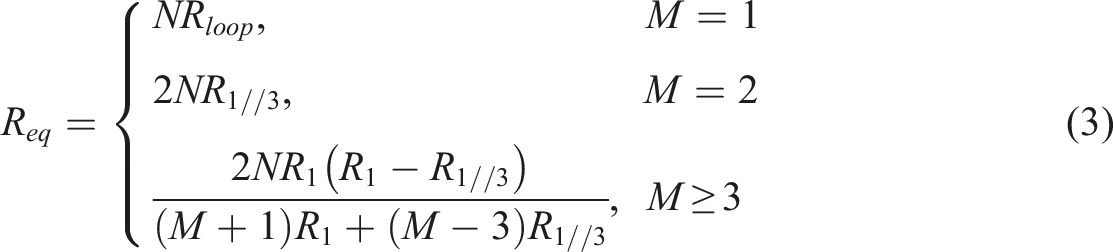
The resistive network model of the knitted fabric related to length resistance is given in the below equations. The conductive yarn electrical resistance (R) is directly proportional to the loop length (l), and resistance coefficient (k) and indirectly proportional to the cross-section area (A) of yarn concerning scaling exponential (β) according to equation (1) adopted from:
17

The fabric resistance also changes concerning the direction of the stretch and change in resistance is indirectly proportional to the EMI shielding. A wale-wise equivalent electrical resistance (R
eq
) changes with increasing number of wales according to equation (2):
17

Safarova 18 explored the electromechanical properties of conductive yarn, two overlapped conductive yarns and conductive crochet chain under unidirectional extension. Experimental results show that a change in the resistance of a textile structure due to contact resistance has a significant contribution to the sensitivity of the sensor in the low-strain region (higher yarn tension causes a decrease in total resistance), whereas length-related resistance has a significant contribution to the sensitivity of the sensor in the large-strain region. The same behavior was confirmed by Li, 19 who studied the unidirectional stretching of single jersey fabric made of Ag-coated PA yarn. It was noticed that the electrical resistance of the fabric decreased with increasing extensile force. An increase in the number of wales caused a decrease in the fabric’s electrical resistance values. Wang 20 also proved that the contact resistance and contact force in knitted fabric have an influence on fabric electrical resistance during fabric stretching. An increase in contact force causes a decrease in the contact resistance of the knitted fabric, which was proved by Holm’s electric contact theory. 21 Ehrmann 22 shows knitted fabric’s elongation-dependent and time-dependent electrical resistance in course direction. It was reported that the full cardigan with medium stitch density is more suitable for resistance stretch sensors among various knit structures. Tohodi 23 studied base fabric parameters on the electro-mechanical properties of conductive knitted fabrics. It can be summarized that the optimum loop length and the symmetrical fabric geometry are the most important parameters for the construction of strain sensors. Besides the knitted fabrics, Fang 24 studied the sensing performance of strain sensors using woven fabrics with different patterns.
There are lots of studies dealing with the dependence of stretching on the electrical resistance of textile conductive fabrics19,22,25–28 and conductive thread stitch fabrics, 29 whereas the yarn resistance has the main influence on the fabric resistance. 30 Nevertheless, the behavior of the electromagnetic shielding ability of easily deformable knitted fabrics during the deformation has not yet been investigated and described to the authors’ knowledge. This behavior is important both concerning the use of knitted fabrics as protective clothing (it could have a negative effect during wearing) and when using knitted structures for potential sensor applications.
This study aims to investigate the change in the electromagnetic shielding ability of knitted fabrics during their tensile deformation, whereas the basic types of tensile deformation were chosen for conclusive understanding. The motivation for this research was the knowledge of the fact that the electrical resistance of the fabric sample changes with the change in elongation and also that, in general, SE is inversely proportional to the electrical resistance of the fabric.
In this work, the three different densities of the knitted fabric were produced using a single jersey and 1 × 1 rib structure. The fabric structures were selected based on their specific mechanical properties. The prepared samples were tested for SE, electrical resistance, and porosity against the uniaxial and bi-axial directions of the fabric stretch to explore their possible use as wireless strain sensors, whereas the following assumptions were tested: - the structural parameters and physical properties of the knitted fabrics have a statistically significant effect on the SE level in the relaxed state, - uniaxial and biaxial tensile stress applied on the knitted fabric have a statistically significant effect on the level of SE, - uniaxial and biaxial tensile stress have a statistically significant effect on the electrical resistance of the knitted fabric, - uniaxial and biaxial tensile stress have a statistically significant effect on the porosity of the knitted fabric, - the dependence of SE on elongation can be described by a linear function (to meet the requirement of sensor applications).
Materials
Yarn parameters – mean values together with 95% confidence intervals of the mean.

The knitted fabrics were prepared at three different densities: low (L), medium (M), and high (H) and its microscopic images at 50x magnification are shown in Figure 2. The different fabric densities were achieved by changing the machine setting – by changing the knitting needles’ knock-over position. Moving the needle further downwards into the needle bed results in longer loops and, thus, low-density knitted fabric. The basic parameters of knitted fabrics are shown in Table 2. The knitted fabric was used for the examination of electrical resistance and electromagnetic shielding under unidirectional as well as biaxial extension. Also, the change in porosity of the samples during tensile stress was observed. Details about measurement methods are described in the Methods section. Microscopic images (50× magnification) of single jersey fabrics having: (a) low, (b) medium, (c) high density, and microscopic images of double jersey fabrics having: (d) low, (e) medium, (f) high density. Flat knitted fabrics parameters and their values.

Methods
Fabric properties
The fabric mass per unit area (GSM) [g/m2] was measured using the standard ASTM D 3776 and the sample size was 100 cm2. Fabric thickness (h) was measured using the thickness gauge [mm], as per the standard ASTM D1777 (knitted samples). The loop length of the fabric samples was calculated based on the Dalidovič geometrical model of the loop. 31 The average yarn diameter value obtained from image analysis of microscopic images of samples (ImageJ software) is 426 µm and it was used for loop length calculation.
Electromagnetic shielding effectiveness evaluation
SE of the sample set was measured according to the ASTM D4935-18, for the planar materials using a plane-wave, the far-field EM wave at the temperature T = 21°C, and the relative humidity RH = 54 %. SE of samples was measured over the frequency range of 30 MHz to 1.5 GHz. The set-up consisted of a sample holder with its input and output connected to the network analyzer. A shielding effectiveness test fixture (Electro-Metrics, Inc., model EM-2107A) was used to hold the sample. The design and dimension of the sample holder follow the ASTM method mentioned above. A vector analyzer Rohde & Schwarz ZN3 was used to generate and receive the electromagnetic signals. The standard mentioned above determines the shielding effectiveness of the fabric using the insertion-loss method. A reference measurement for the empty cell was required for the shielding effectiveness assessment. A “through” calibration with the help of the reference sample was made first. A load measurement was performed on a solid disk shape sample subsequently. The reference and load specimens must be of the same material and thickness. Both the reference and load samples geometries are according to the ASTM D 4935-18. The measurements were performed at five different places of the textile samples in a relaxed state because of the subsequent statistical analysis.
Electromechanical properties of fabrics
Electrical resistance measurement
The online measurement of the electrical resistance of the knitted fabric sample was done with an Arduino resistance circuit setup. In this case, the measurement of electrical resistance is based on a voltage divider with the known (Z
1
) and unknown (Z
2
) resistors (see scheme in Figure 3(a)) which has an output voltage (V
out
) that depends on the unknown resistance,
32
see equation (4): Experimental setup of the fabric attached in a biaxial device to measure (a) electrical resistance, and (b) electromagnetic shielding effectiveness.

The code in the MATLAB environment was created to calculate the unknown resistance from Ohm’s Law and to save readings in real time.
All free sides of the 14 × 14 cm square sample were clamped using metal hooks to the biaxial device. The T-shaped or cross-shaped samples were not used because the knitted samples were prone to unravel when cut into a T-shape,
13
which would affect the structure of the knitted fabric and consequently its behavior during tensile stress. The two edges of the fabric samples were connected with two probes from the resistance circuit board at a distance of 14 cm and the sample was stretched at a speed of 3.5 mm/sec to measure its electrical resistance until 25% fabric elongation. The sample deformation relied on the EN 13934-1 standard, which is intended for the determination of tensile properties of fabrics using a constant rate of extension. Climatic conditions were as follows: T = 21°C, and RH = 54 %. It was observed that the sample elongation limit according to the hook setup in the biaxial device varies depending on the density and structure of the fabric. Based on the stress-stain curves it was found that cracking and irreversible deformation of the sample occurs during the elongation above 25% of the original sample length for all samples, therefore it was decided to use 25 % elongation as a maximum elongation for all samples, and all stretching types, see stress-strain curves of single jersey fabric in medium stitch density shown in Figure 4, where the red square represents the studied range of stretching. It was proved also by microscopic analysis after the sample deformation, that there was no visual disturbance of the structure of the conductive coating on the surface of the yarns under this deformation region. While uniaxial stretching the electrodes were connected to the stretching direction for a measurement, using biaxial stretching, the probes are connected in the vertical direction of the sample, and the only wale way electrical resistance is measured. The resistance readings were recorded online using MATLAB software and then saved for further analysis. Figure 3 shows the experimental setup of a biaxial stretching device with a fabric sample to measure electrical resistance using two probe method (Figure 3(a)). Figure 2(a) shows the knitted fabric image marked with horizontal and vertical directions, whereas the horizontal direction represents the course-wise, and the vertical direction represents the wale-wise in the knitted structure. This designation (horizontal, vertical) will be used later in the text to show which direction of loading was used. Stress-strain curves for SJM fabrics: (a) wale-wise, (b) course-wise direction of loading.
Measurement of the electromagnetic shielding effectiveness
The semi-continuous measurement of electromagnetic shielding effectiveness (SE) of the samples was performed according to the coaxial transmission line method as per ASTM D 4935-18 standard during sample extension. The lower part of the coaxial SE tester was permanently located under the tested sample. The coaxial holder was placed on the surface of the fabric sample attached to the biaxial device for each measurement. The stretching cycle was programmed with Fabris 5K software. The stretching speed was 3.5 mm/sec and for every 5% elongation of fabric, the holders were paused for 30 s to measure the SE. The stretching process was continued until 25% elongation of the sample. Figure 3(b) shows the experimental setup of a biaxial stretching device with fabric having the upper part of the coaxial SE tester placed on the surface of the sample.
Sample porosity measurement
The pore area of the fabric sample during the biaxial stretching process was measured using the Nikon NIS element software as per internal standard number 23-107-01/01 based on the image captured initially at each stage of the elongation. The total open pore area value of the fabric called porosity was obtained by the NIS element image analysis and it was used for further analysis. The method of image analysis is based on the transmission of visible light through a material.
All three types of experiments were conducted using knitted fabrics differing in type (single, double) and density (low, medium, high) while applying uniaxial deformation at vertical and horizontal directions and biaxial deformation. Dependent properties were: sample electrical resistance, SE, and porosity. Three readings per sample were taken for each sample in each level of sample extension. The small sample size was caused by expensive raw materials - yarn and relatively time-consuming preparation of knitted samples with different machine settings. Statistical analysis of small samples was applied.
33
The mean value was estimated as the arithmetic mean of the two nearest values. The 95% confidence intervals for means were calculated according to the equation (5):
Results and discussion
In this section, the electromagnetic shielding ability of all knitted samples in a relaxed state is studied and discussed. Further, the strain sensitivity of the samples concerning SE results is discussed and SE is also compared with their electrical resistance, and porosity during all types of stretching.
Electromagnetic shielding of the knitted fabrics in a relaxed state
Electromagnetic shielding effectiveness of samples in a relaxed state is explored to demonstrate the influence of the structure and density of the knitted fabric on the resulting level of electromagnetic shielding efficiency in this section. The dependence of SE on frequency range from 30 MHz to 1.5 GHz for all samples is shown in Figure 5, whereas the mean values of SE from five measurements are shown. Electromagnetic shielding effectiveness SE [dB] versus frequency, f [Hz] (f = 30 MHz - 1.5 GHz) of the single jersey and double jersey samples.
The following findings can be summarized based on the frequency-dependent graph: SE of the single jersey fabrics almost linearly decreases with increasing frequency; SE of double jersey samples is almost constant on the whole frequency range; double jersey samples have a higher ability to shield electromagnetic field compared to single jersey samples; the higher sample density the higher SE. The SE of the SJL, SJM, and SJH fabrics is 47 dB, 48 dB, and 52 dB at 1.5 GHz. Scattered SE-frequency curves of double jersey are caused by the fact that the SE of these samples is close to the dynamic range of the measurement device. SE of DJL, DJM, and DJH samples is 62 dB, 64 dB, and 65 dB at 1.5 GHz frequency.
Samples SJL, SJM, and SJH (as well as samples DJL, DJM, and DJH) differ in density and other related properties (such as stitch density, areal density, thickness, and porosity) while maintaining the same pattern. As mentioned above the samples also differ in their electromagnetic shielding ability. The effect of these properties on SE in a relaxed state is compared and shown in Figure 6. The SE increases with an increase in stitch density of the SJ linearly. An increase in SE with stitch density is also observable for the DJ samples, but further stitch density increase (S >550 stitches/inch) seems to be no longer significant, see Figure 6(a). This phenomenon was expected because the content of the conductive component (conductive yarn) in the volume of the sample is crucial for the amount of SE. For some applications, the thickness and the weight of the sample could be limiting. That is why the comparison of SE to unit thickness and unit GSM of the sample was performed. The dependence of SE on sample GSM is shown in Figure 6(b) and it follows that the SE increases with increasing areal density for SJ and DJ fabrics. This phenomenon was expected based on theoretical assumptions. More mass of conductive material in the area associated with a smaller amount of pores is a prerequisite for a higher SE. Also, in this case, further increasing GSM for DJ samples (GSM >460 g/m2) no longer benefits SE. At high GSM and density, the fabric is compact enough that a further increase does not have a statistically significant effect on SE, which is following the percolation theory, that is when the volume is sufficiently saturated with a conductive filler, a further increase in the content of the conductive component does not affect the electrical conductivity, or SE. The thickness has almost no statistically significant effect on SE for SJ samples, and no or negative effect on SE for DJ samples (see Figure 6(c)). This effect is caused by the fact, that higher stitch density causes lower thickness for DJ samples. Dependence of SE at 1.5 GHz frequency on (a) stitch density, (b) areal density, (c) thickness, and (d) porosity of the fabric samples.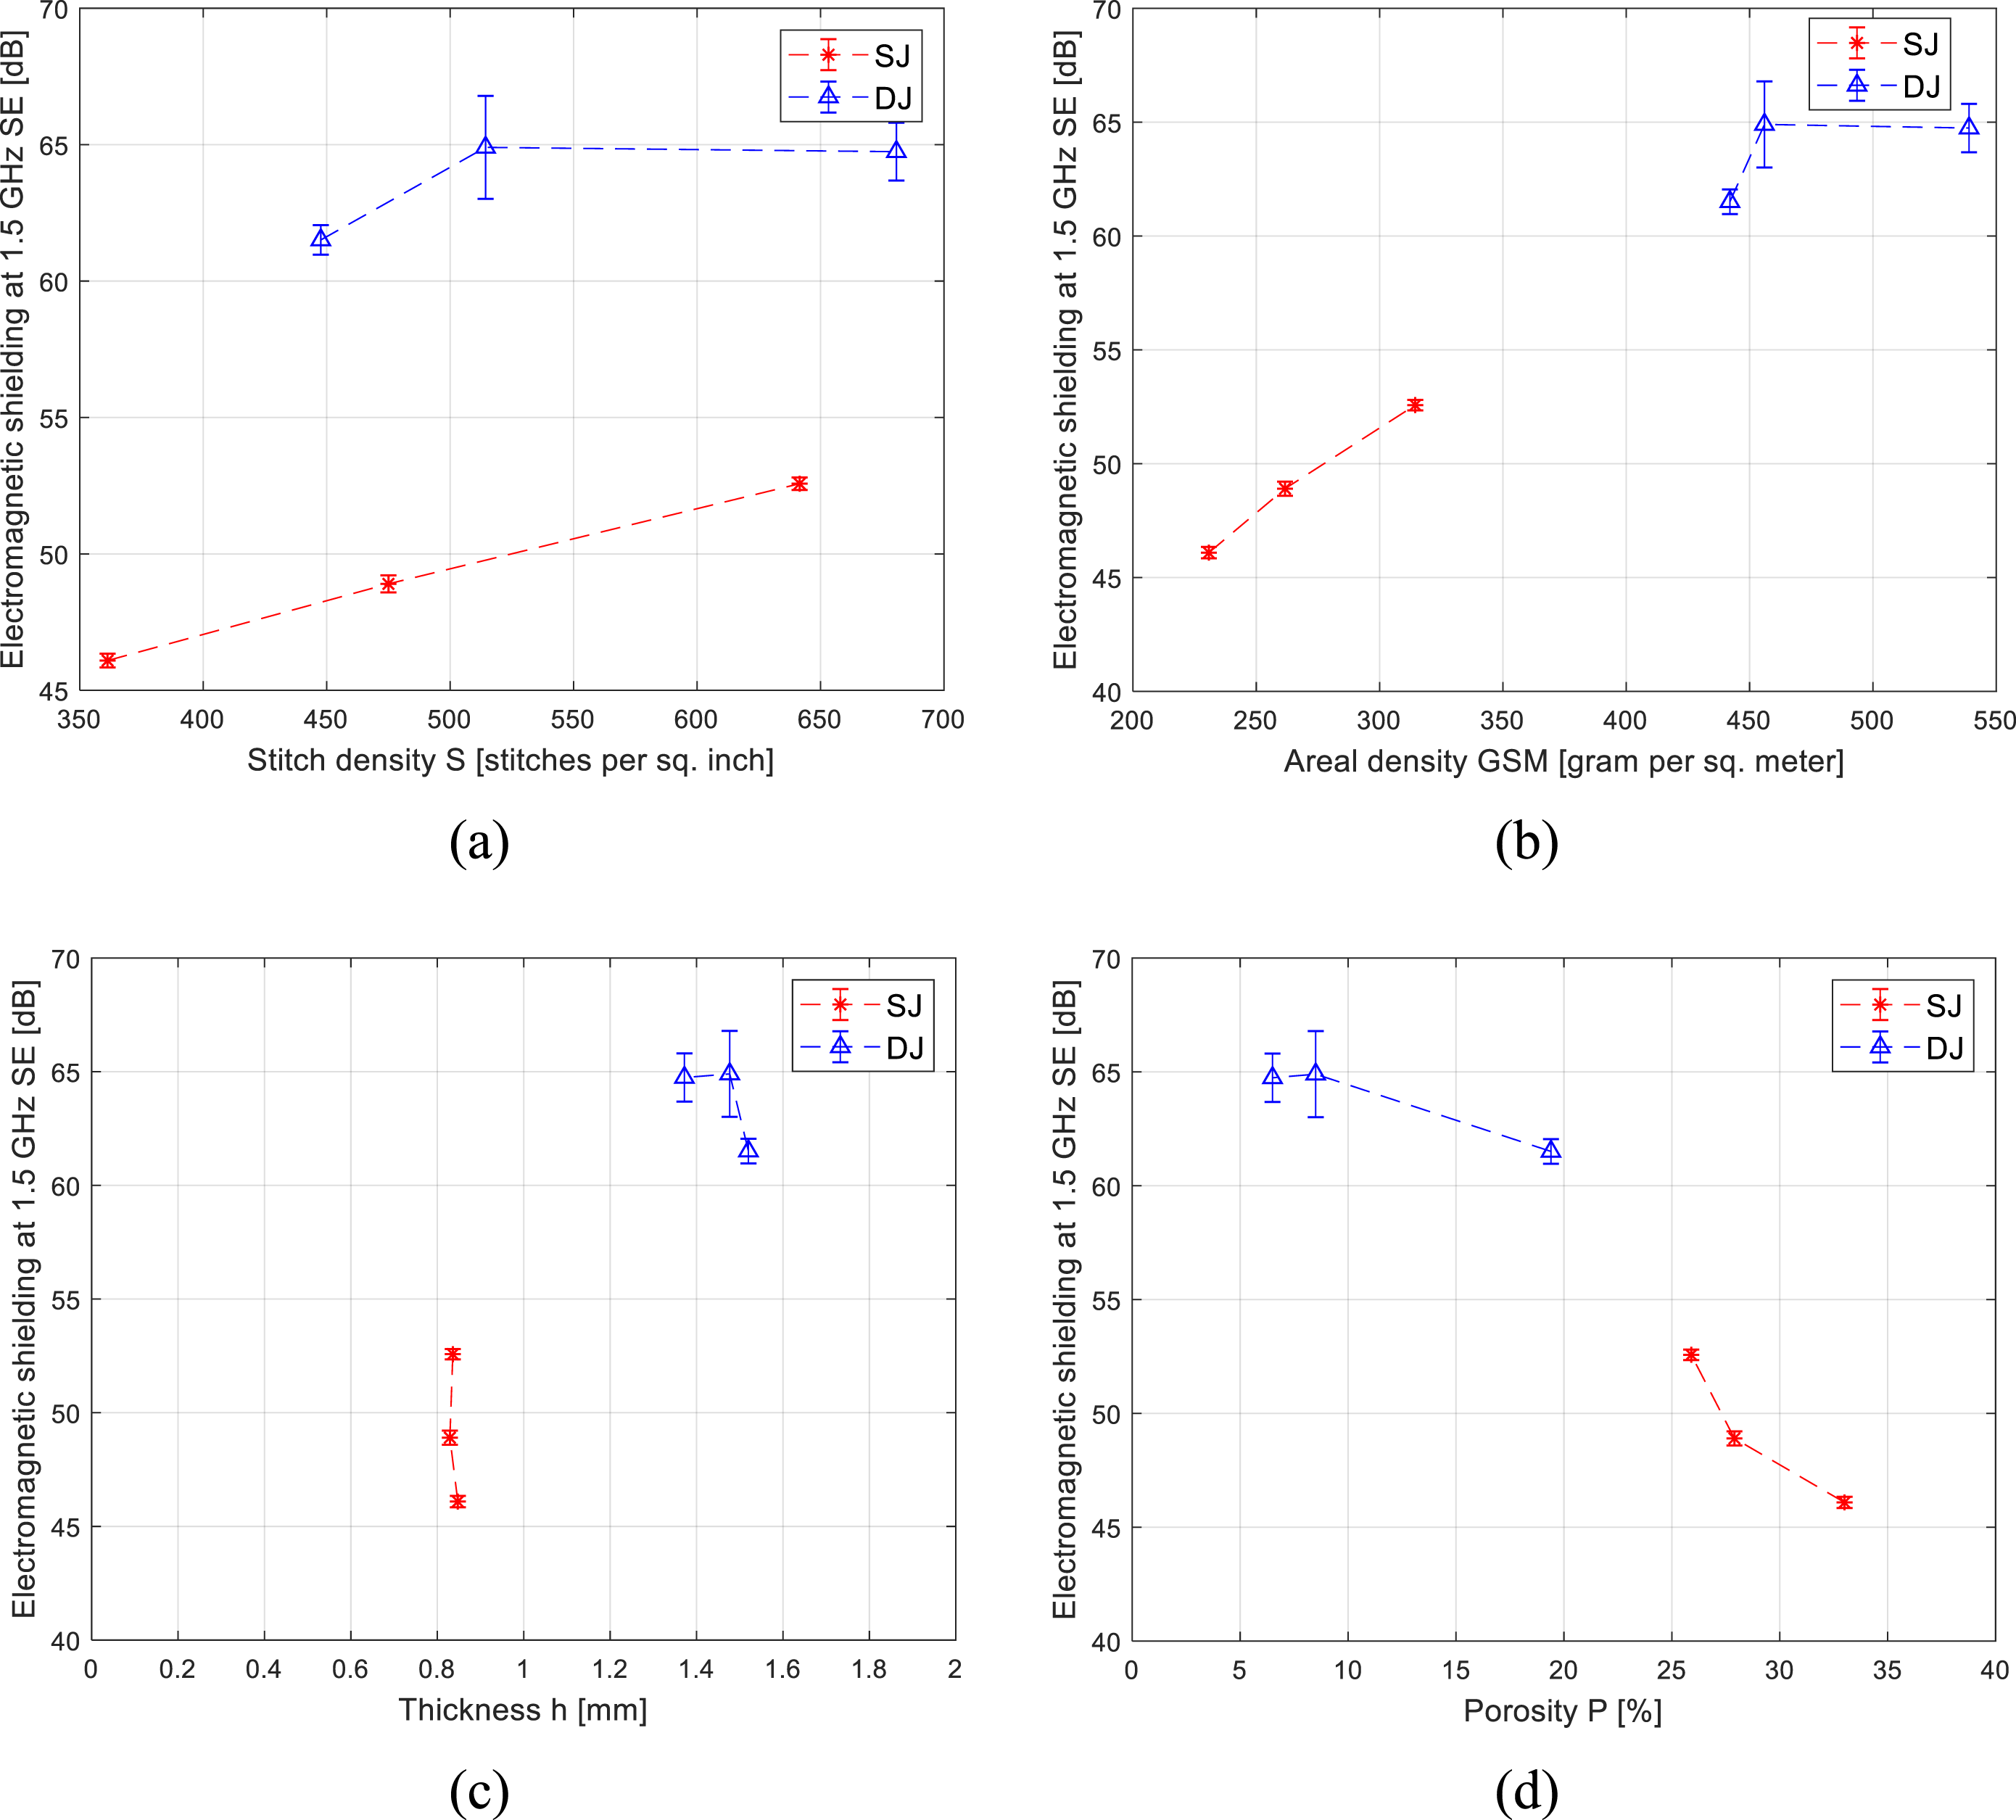
As it follows from the theoretical analysis of the penetration of electromagnetic radiation through the holes in the shield, the porosity of the fabric could play a very important role. The dependence of SE on porosity for SJ and DJ fabrics is shown in Figure 6(d). It can be seen that the theoretical assumption was confirmed: the more porous the fabric, the lower its SE. 34 Those results of samples in a relaxed state show the difference in SE with the fabric structure and its densities and these findings might be helpful to choose the suitable fabric for the strain-sensing application.
Analysis of knitted fabrics elongation on their electromagnetic shielding ability
To characterize the electromagnetic shielding response of the sensors applied to the strain force, the dependence of SE on elongation was measured. The sensitivity of the fabric sensor (SES) can be clarified by the factor of the electromagnetic shielding change, see equation (6): Elongation of fabric ε [%] versus SES [-] of (a) SJL, (b) SJM, (c) SJH fabric, and (d) all samples at vertical way elongation together with linear regression. Anova test results.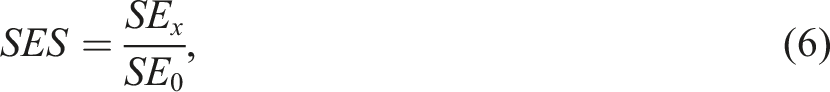


The dependence of SES on fabric elongation for DJ fabrics is shown in Figure 8. The dependence of SES on elongation has a different shape depending on the type of tensile stress (horizontal, vertical, both). During vertical direction of stretching the SE increases with increase in elongation almost linearly, but during horizontal and both directional stretching, the SE decreases initially (ε < 10%) and then increases with increase in elongation. When observing vertical deformation of the sample, it seems that the higher the sample density, the higher the slope of the line by which this dependence could be approximated. Using the analysis of covariance, it was found out that there is no statistically significant difference between the slopes of the approximation lines shown in Figure 8(d) for DJ fabrics. The increase in SE with increasing elongation of the sample during vertical elongation can be explained by the decreasing electrical resistance of the sample accompanied by an increase in sample SE which prevails over the negative effect of porosity. The initial decrease of SE at lower elongation (ε < 10%) during horizontal and both extension is probably caused by the loosening of the knit structure at the initial level of deformation accompanied by a reduction in the number of contact points and thus a reduction in electrical conductivity which negatively affects SE. For the higher elongations (ε > 10%) the effect of the contacts point predominates and an increase in SE can be observed with further extension of the sample. The DJ fabric’s dependence of SES on the vertical elongation of fabric is shown in Figure 8(d). Here, the linear increase of SES with an increase in fabric elongation in vertical direction was noticed. The predictability and correlation of SES on elongation for DJH, DJM, and DJL represented by its R
2
is 0.80, 0.98, and 0.87 respectively. The vertical elongation results are taken for further regression analysis to find out the correlation between explanatory variables. Elongation of fabric ε [%] versus SES [-] of (a) DJL, (b) DJM, (c) DJH, and (d) all samples at vertical way elongation together with linear regression.
Analysis of knitted fabrics elongation on their electrical resistance
It is known from theory, that the electrical resistance (ER) is indirectly proportional to the SE; which means the higher the electrical resistance, the lower the electrical conductance, the lower the shielding and vice versa. Figure 9 shows the dependence of electrical resistance on elongation for different types of elongation and SJ sample density. The electrical resistance of the SJL sample decreases with an increase in elongation at all directions as seen in Figure 9(a). The electrical resistance of SJM sample also decreases with increasing elongation at all elongation types, whereas the lowest decrease of ER on ε (ER drops only 0.1 Ω at 25 % elongation) is possible to observe for horizontal elongation, see Figure 9(b). Dependence of electrical resistance R [Ω] on elongation of fabric ε [%] for single jersey fabrics having: (a) low, (b) medium, and (c) high density.
The increase of ER in the initial level of tensile stress is probably due to the loosening of the knit structure accompanied by a reduction in the number of contact points. When studying SJH sample (see Figure 9(c)), the ER significantly decreases (approx. 0.6 Ω drop at 25 % elongation) only during vertical extension, the ER is almost constant with increasing horizontal and both way elongation.
The behavior of ER of DJ samples against the uni- and biaxial directional elongation is shown in Figure 10. DJL sample resistance increases initially and then decreases with increasing elongation at all directions of stretching as seen in Figure 10(a). The increase is probably caused by knitted structure loosening accompanied by a decrease in the number of contact points between electro-conductive yarns. The ER of the DJM sample behaves similarly to the DJL sample, only during horizontal elongation, the ER is slightly increasing (from 1.5 to 1.8 Ω at maximal elongation), see Figure 10(b). This increase could be caused by low expansion of the sample in the horizontal direction and the effect of length resistance seems to predominate. It seems that the ER of DJH is almost independent on elongation, which is probably due to the dense structure of the sample. In general it can be summized that these findings are in accordance with already published articles,18,19,26 while it can be expected that at a higher tension, the resistance would start to rise due to the geometric changes (yarn diameter d ↓, yarn length l ↑) of the stretched yarns, as well as due to cracking of the conductive coating on the surface of the yarns as outlined in author’s previous work.
30
Elongation of fabric ε [%] versus electrical resistance R [Ω] for double jersey having(a) low, (b) medium, and (c) high density.
Analysis of knitted fabric elongation on their porosity
The dependence of porosity on different types of elongation for SJ fabrics is shown in Figure 11. It was expected that the extension of the fabric will cause an increase the porosity in most of the cases and increasing porosity could negatively affect the sample shielding effectiveness. SJL, SJM, and SJH fabrics’ porosity increases with an increase in elongation at vertical, horizontal, and both directions as seen in Figure 11(a)–(c). Both ways elongation of the samples causes the highest change in porosity. It seems that horizontal elongation has the second-highest effect on porosity. In the vertical direction of stretching, the change in porosity is the smallest because the loops are tightly arranged at course-wise of the SJ structure and that is why it does not elongate much at this direction of stretch. The density of the fabric also affects the porosity; the higher the density, the higher the change in porosity against the elongation was noticed. The SJL, SJM, and SJH have a maximum difference in porosity of 16%, 18%, and 24% respectively during both ways stretch. At horizontal direction or course-wise, the knit loops are arranged loosely to elongate easily. The porosity is affected by the knit loop structures with respect to the direction of stretch. Dependence of open pore area P on fabric elongation ε [%] for single jersey having: (a) low, (b) medium, and (c) high density.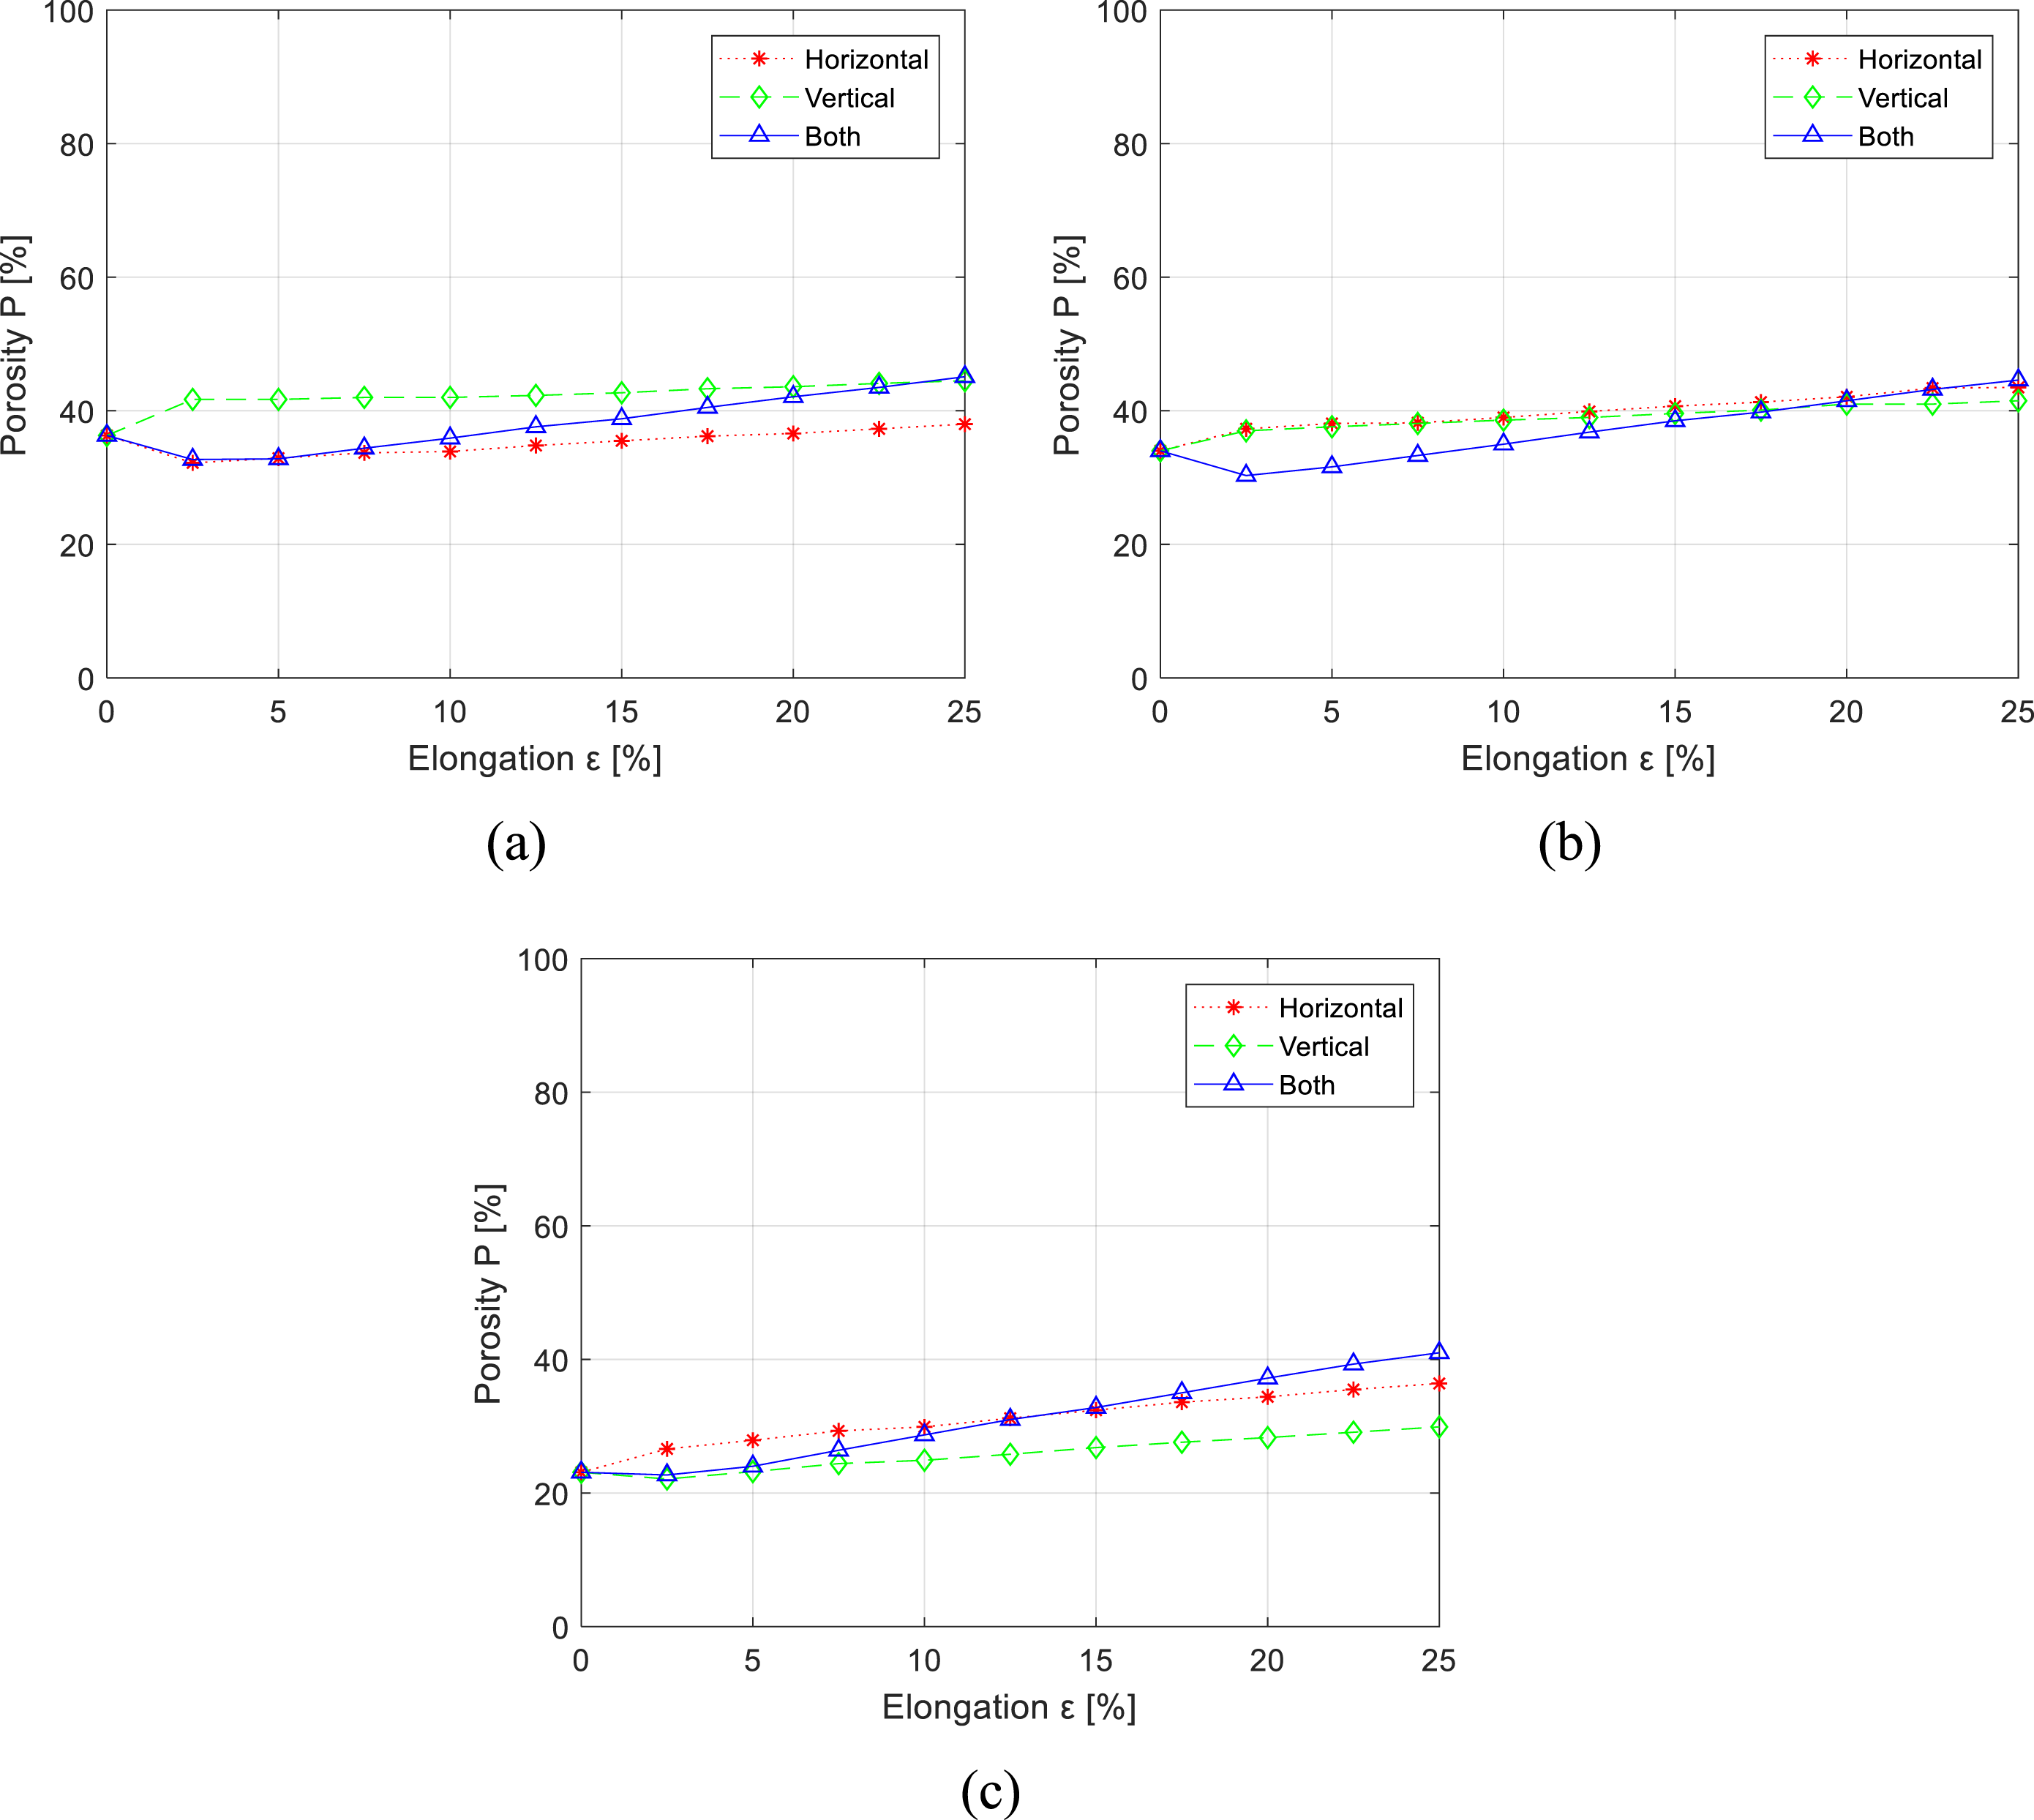
The dependence of porosity on all types of elongation for DJ fabrics is shown in Figure 12. DJL, DJM, and DJH fabrics’ porosity increases with an increase in elongation at vertical, horizontal, and both directions as seen in Figure 12(a)–(c). Elongation of fabric ε [%] versus open pore area P [%] for double jersey having (a) low, (b) medium, and (c) high density.
Both directions elongation causes the steepest porosity increase (ΔP ∼ 50 %), whereas the second highest effect on porosity has horizontal elongation. According to the porosity, the DJ structure behaves similarly compared to SJ samples. In general, the change in porosity in the studied range is smaller for SJ sample compared to the DJ sample set. The density of the DJ fabric also affects the porosity; the higher the density, the higher the change in porosity against the elongation. The DJL, DJM, and DJH have a maximum difference in porosity of 30%, 40%, and 48% respectively during both ways stretch. In horizontal direction or course-wise, the knit loops are arranged loosely to elongate easily. The porosity is affected by the knit loop structures concerning direction of stretch.
Empirical model building

Symbols and names.

The prediction ability of a regression model was characterized by the predicted coefficient of determination R2. The two main variables: x
1
= G, x
2
= P/P
0
were selected (see Table 4). The corresponding linear regressing has the form shown in equation (8):
The dependence between measured and predicted SE is shown in Figure 13. The linear regression between the SE predicted versus SE measured for SJ fabrics in Figure 13(a) follows a linear trend, and its coefficient of determination is 0.90 (corresponding to correlation coefficient r = 0.95), which means the linear model is suitable for predicting the SE value. The linear regression between the SE predicted versus SE measured for DJ fabrics in Figure 13(b) follows a linear trend, and its R
2
is 0.71 (corresponding to correlation coefficient r = 0.84), which means the linear model has a high positive
36
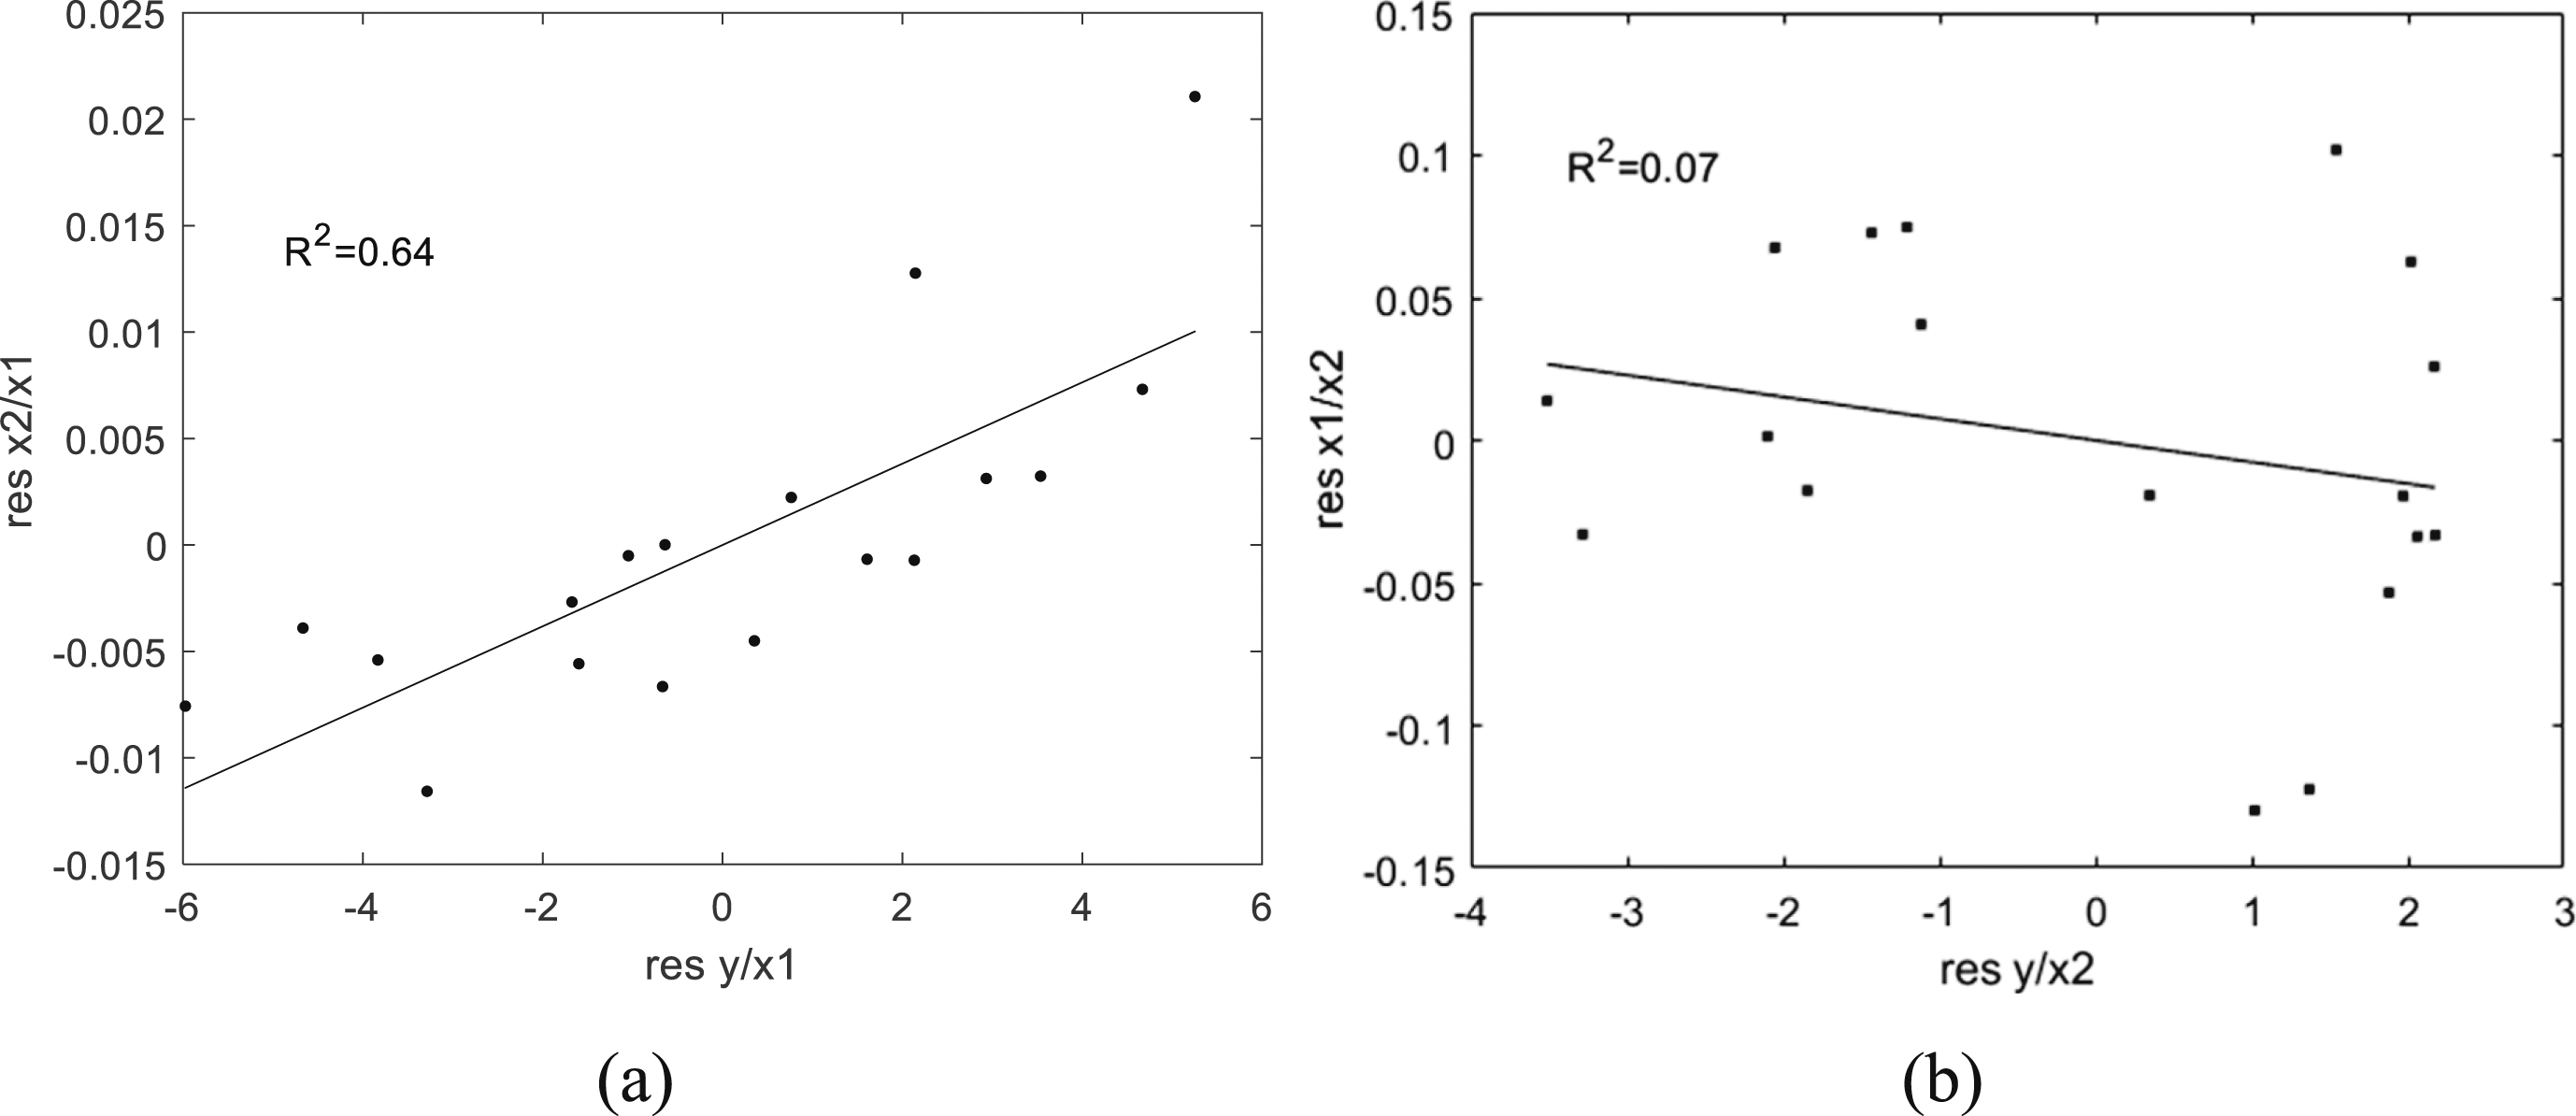
correlation to predict SE value. The coefficients for the linear regression model (Equation (8)) for both types of knit are shown in Table 5. Because the dependencies between measured and predicted SE are slightly curved and scattered (especially for the DJ fabric), the partial regression graphs were constructed and explored,
35
see Figures 14 and 15. Relation between measured and predicted SE using equation (8) for (a) SJ, and (b) DJ fabrics. Regression coefficients for regression model (Equation (8)) for SJ and DJ. Partial regression graphs for model (Equation (8)) (a) variable 1, (b) variable 2 for the single jersey sample set. Partial regression graphs for model (Equation (8)) (a) variable 1, (b) variable 2 for double jersey sample set.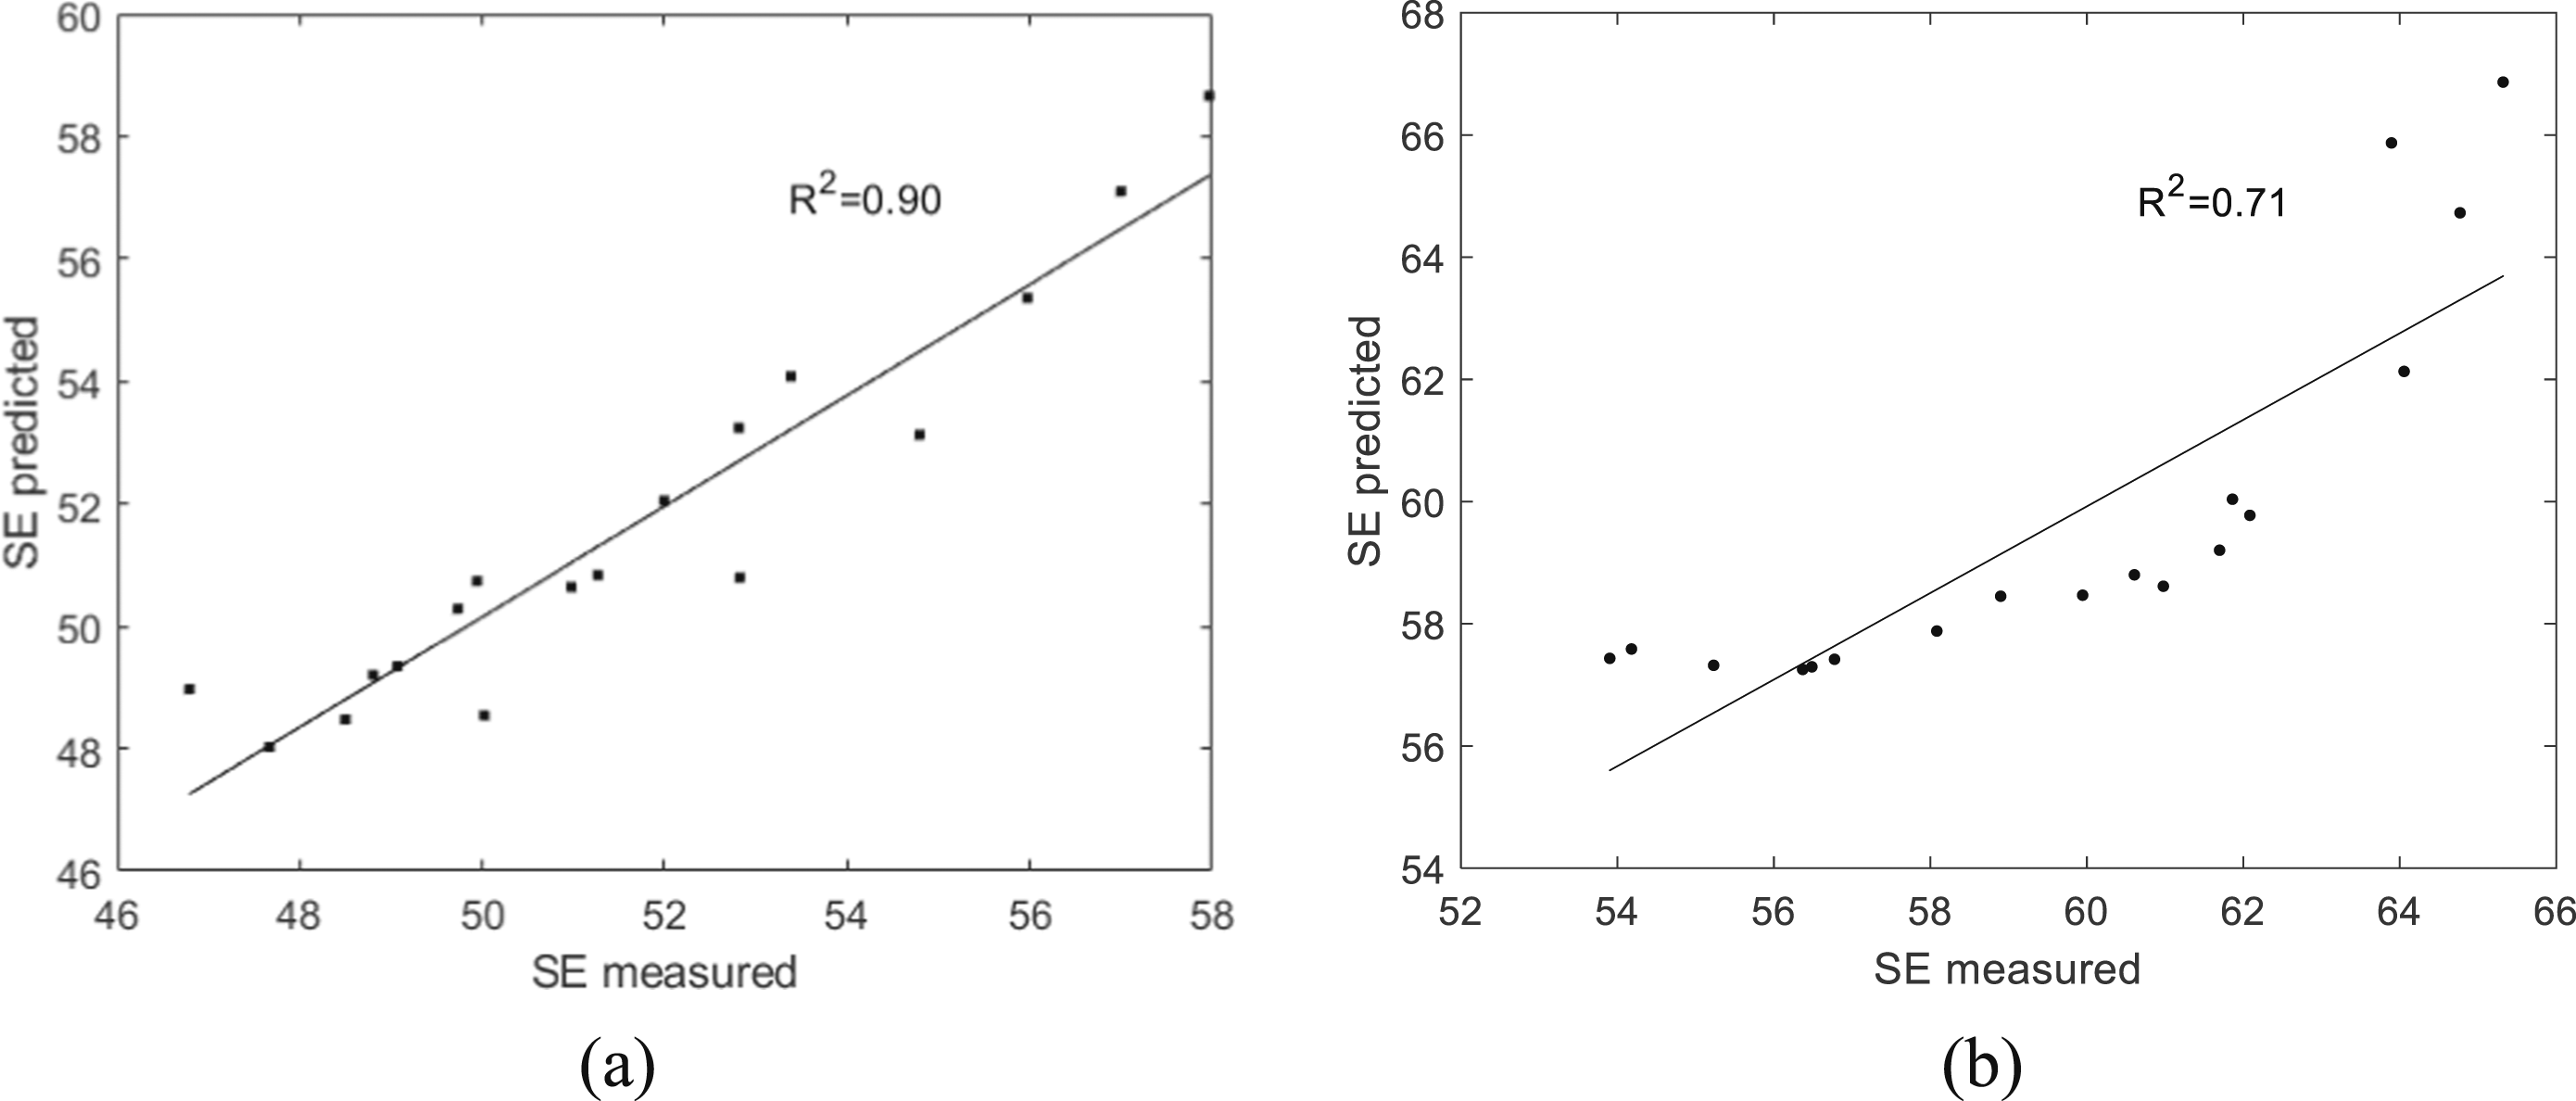


Due to the nonlinearity of the x
2
variable in particular the modified regression model was created using transformation of this variable. The model has the form (Equation (9)):
The corresponding coefficient of determination is 0.91 and 0.87 for single jersey and double jersey respectively. The relation between predicted and measured SE for this model is shown in Figure 16. The regression model coefficients are shown in Table 6. The regression model using transformation of the variable, leading to a maximum degree of linearity in the partial regression plot has higher predictability and it is recommended for modeling of the sensors made of electrically conductive knitted fabrics. Relation between measured and predicted SE at 1.5 GHz frequency using equation (9) for (a) SJ, and (b) DJ fabrics. Regression coefficients for regression model (Equation (9)) for SJ and DJ.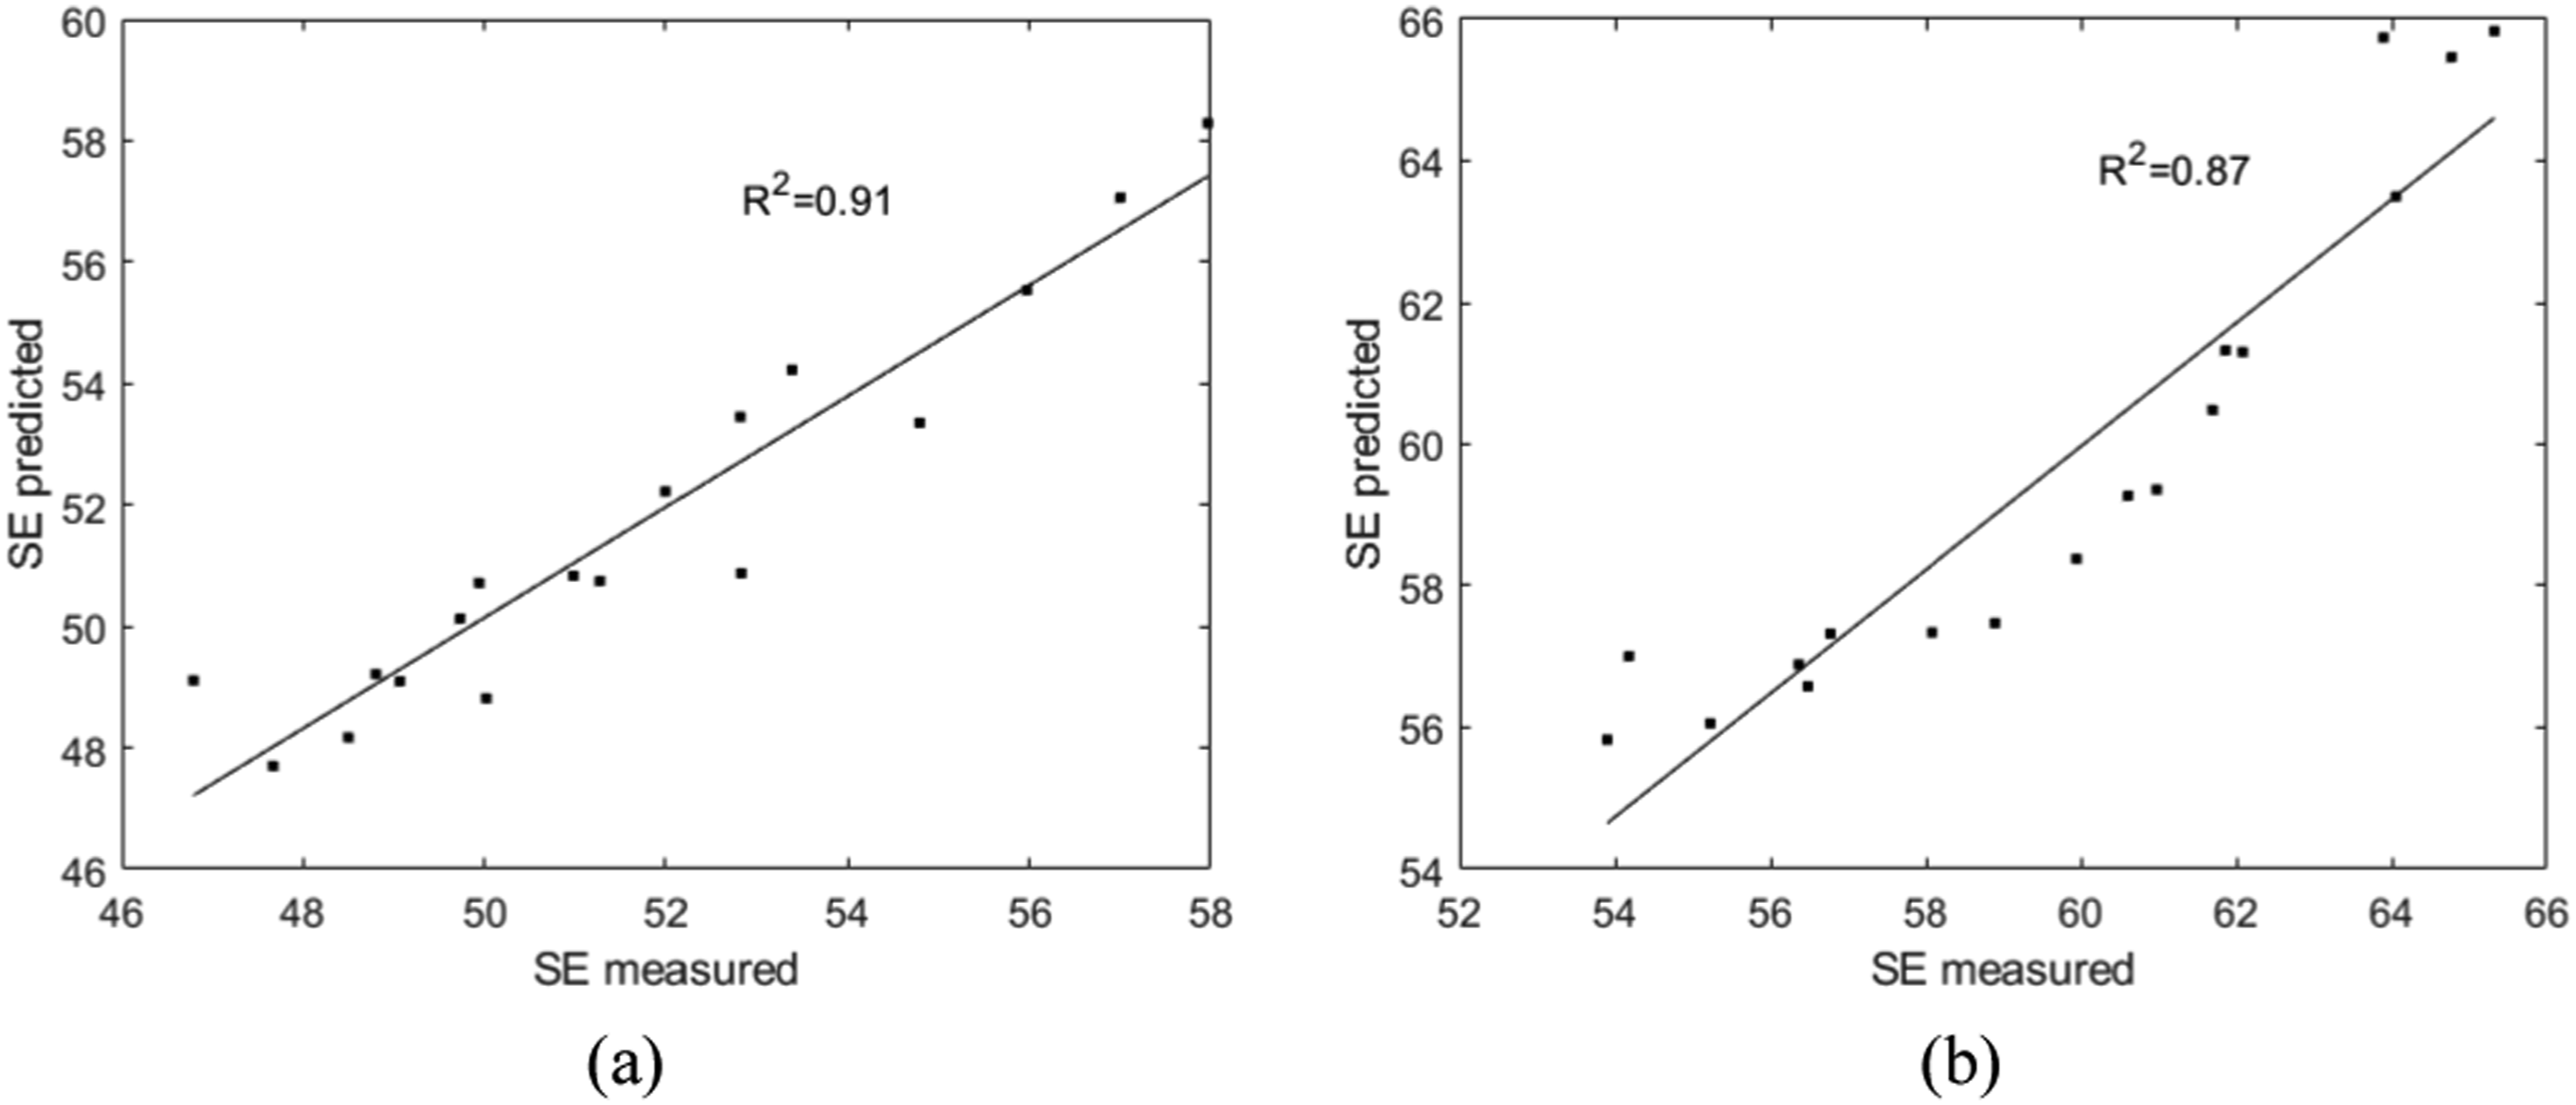

Conclusion
The main aim of this paper was to investigate the possibility of using selected knitted fabrics as wireless tensile strain sensors. As stimulus uniaxial and biaxial tensile deformation was used. As a response change in the electromagnetic shielding effectiveness of fabrics was tracked.
The single jersey and double jersey (1 × 1 rib) fabrics knitted using silver-coated yarn with three various fabric densities were analyzed for strain sensing ability, whereas electromagnetic shielding effectiveness, electrical resistance, and porosity were evaluated in the presence of different types of tensile stress.
In the relaxed state, the electromagnetic shielding ability of all samples was in the range of 42 – 65 dB for 1.5 GHz frequency, while the double jersey sample set showed higher shielding ability compared to single jersey fabrics. As expected it was confirmed that the stitch density of the fabric has a statistically significant positive effect on the electromagnetic shielding effectiveness of the fabric.
The single and double jersey fabrics’ electromagnetic shielding sensitivity versus elongation results reflect the strain sensitivity of the sensor. Based on this research, for the creation of sensors, it is recommended to use sensitivity changes in the wale-wise direction of the knitted fabric, where a linear trend was observed under this uniaxial tensile stress.
During the modeling of SE depending on the uniaxial tensile stress (wale-wise direction) of knitted samples, two regression models were introduced. As predictors, electrical conductance and gauge porosity (the porosity of the sample relative to the porosity of the sample in the relaxed state) of the sample at a given elongation were chosen. The corresponding coefficients of determination R 2 of this model are satisfactory, 0.91 and 0.87 for single jersey and double jersey respectively.
The proposed strain knitted sensor for wireless strain sensing is mainly focused on replacing the wired strain sensors, which are already used in structural health monitoring and wearable body moment measurements; also, it could be used in vehicle testing, structural health monitoring, and construction applications. This wireless sensor is cost-effective based on wire-free use. However, it should be mentioned that it is also necessary to investigate stretch recovery and cyclic tensile stress to verify all assumptions for the creation of sensors.
Footnotes
Declaration of conflicting interests
The author(s) declared no potential conflicts of interest with respect to the research, authorship, and/or publication of this article.
Funding
The author(s) disclosed receipt of the following financial support for the research, authorship, and/or publication of this article: This work was supported by the Ministry of Education, Youth and Sports of the Czech Republic and the European Union - European Structural and Investment Funds in the frames of Operational Programme Research, Development and Education - project Hybrid Materials for Hierarchical Structures (HyHi, Reg. No. CZ.02.1.01/0.0/0.0/16_019/0000843).