
Abstract
Resistance training is becoming increasingly important and widespread. Decomposition of the muscle loads applied is important for injury prevention and determining the load on the targeted muscles. In this study, a flexible textile PET (polyethylene terephthalate)/SP(Spandex) SWCNT (Single-walled carbon nanotube) stretch sensor was fabricated and attached at four locations: the elbow, brachioradialis/flexor carpi radialis, biceps brachii, and triceps brachii. The stretch sensors attached to the elbow can measure the angle of elbow flexion without an IMU 9-axis sensor using quadratic fitting. A Multi-Layer Perceptron (MLP) was used to decompose the muscle volume expansions of the 3muscle by angle. The model provided a good fit for all three muscles, with R-squared values ranging from Test set 0.98725 to 0.99815. Through one input and three ouput fitting, the muscle volume expansion quantities during the bicep barbell curl were decomposed and compared with data. The results showed that the brachioradialis/flexor carpi radialis muscle maintained 13% of the arm muscle volume up to 60°, then increased to 44% at 100°. The biceps brachii muscle steadily increased to 70% from 0° up to 60°, and then maintained 40% at 100° due to the volume increase of other muscles. The triceps brachii muscle maintained 9% of the arm muscle volume up to 90°, then increased to 20% at 100°. This study shows that muscle volume expansion can be easily measured with a non-body contact wearable device, unlike many existing contact methods for measuring muscle activity like EMG (electro-myography), etc. This study provides a novel approach for easily measuring muscle volume expansion and decomposition in wearable devices, which can indirectly indicate injury prevention and muscle loading in target areas through balance optimization among local muscles.
Keywords
Introduction
Healthcare, particularly fitness, is seeing an increase in the number of users owing to the growing interest in health and wellness. Among the many forms of exercise, isotonic exercise, also known as resistance training, has gained attention in recent years mainly due to its ability to improve strength, power, endurance, and muscle hypertrophy.1,2 Resistance training is one of the physical exercise that involves working against forces to increase muscle strength and size. 3 Force can be generated using body weight, free weights, machines, or resistance bands. Because of its effectiveness in improving overall health and fitness, resistance training has become a popular trend among fitness artists, athletes, and the public. 4
With the increasing interest in exercise, many studies have focused on measuring muscle activity to improve training methods and achieve optimal results. Various methods are used to measure muscle activity, including electro-myography (EMG), mechano-myography (MMG), sono-myography (SMG), and phono-myography (PMG). EMG is the most widely used method for measuring the electrical signals generated within the muscle to analyze muscle activity, including muscle activation and contraction patterns. 5 MMG measures the mechanical vibrations generated by muscle contractions, whereas SMG uses ultrasound to measure muscle displacement and analyze muscle activity. PMG measures the sound generated within the muscle to analyze muscle activity. EMG has a high signal-to-noise ratio but can be affected by the depth and location of the measured muscle. 6 Utilizing MRI (Magnetic Resonance Imaging) to measure muscle volume is accurate, but it cannot be performed during exercise execution. Furthermore, it has the limitation of only being measurable before and after the exercise.7,8 Real-time monitoring of muscle activity during exercise is difficult using the MMG, SMG, PMG, MRI methods because of the complexity of the equipment required and the need for numerous devices.9,10 Although sensors capable of measuring muscles using graphene and PDMS have been developed, 11 they still remain underutilized as wearable garments due to issues such as discomfort during wear and the requirement of attaching rigid devices. Furthermore, most of the research has focused only on aerobic exercises such as walking and cycling.12,13 Also It is limited to the classification of breathing and finger movements using textile sensors.14,15 Research has been extensively conducted and commercialized in exercise fields where breathing is crucial, such as walking and cycling. 16 However, there is a lack of research specifically related to strength training, also known as resistance training. To overcome these limitations, researchers have proposed various new techniques for analyzing muscle activity.
Muscle function and athletic performance are heavily influenced by two interrelated phenomena: muscle contraction and muscle volume changes.
17
During contraction, the actin filaments slide past the myosin filaments (Figure 1), resulting in the shortening of muscle fibers and the development of tension.
18
This process is mediated by the binding of myosin heads to actin sites, which undergo a series of conformational changes to generate the force necessary for filament sliding.
19
Muscle contraction involves the shortening of muscle fibers and the generation of force, which can lead to the expansion of muscle volume owing to increased blood flow to the tissue.20,21 Volume expansion is important for muscle growth and repair. By measuring volume expansion, it is possible to predict the spatial decomposition of muscle loads. Muscle contraction and sliding filament.
The relationship among agonist, synergist, and antagonist muscles is a critical component of muscle function during exercise. 22 Agonist muscles are responsible for initiating movement, whereas synergist muscles assist in exercise and stabilize joints. Antagonist muscles act in opposition to agonist muscles, providing resistance to exercise and helping control speed and range of motion. Understanding the interplay between these muscle groups is essential to designing effective exercise programs, preventing injuries, and optimizing performance.23,24 An example of this relationship can be observed during biceps barbell curl exercises. The bicep barbell curl exercise is a commonly used resistance training exercise that primarily targets the biceps muscle. 25 During this exercise, several muscles are recruited to assist arm flexion, with the biceps brachii serving as the agonist and the brachioradialis and flexor carpi radialis acting as synergists. 26 However, several muscles act in opposition to the biceps muscle and are known as antagonists, such as the triceps brachii. 27
This study aimed to measure muscle volume expansion during biceps curl exercises at different angles using stretch sensors. It involves flexion of the elbow joint, resulting in contraction of the biceps muscle. As the muscle contracts, there is an increase in tension and expansion of muscle volume, which is commonly observed during exercise. 25 Prior studies have addressed measurements related to muscles such as EMG, MMG, SMG, PMG, and MRI. However, these methods require direct contact with the body, come with equipment limitations, and often involve the use of multiple devices. In this study, the advantage lies in using a flexible sensor that enables easy non-contact measurement through wearable technology. The use of stretch sensors allows the precise measurement of muscle volume expansion at different angles during exercise. Understanding the relationship between muscle contraction and volume expansion can provide insight into the mechanisms underlying muscle growth and function, which can inform the development of effective training programs for athletes and individuals seeking to improve muscle strength and size. It can be easily obtained in wearable form without the need for additional equipment.
Materials and methods
Sensor fabrication
The E-band (KOLON Co., Ltd, Seoul, Republic of Korea) is a type of fabric consisting of PETSP (80:20) woven with spandex and polyester fibers. The e-band is woven using a knit weave, where threads are interconnected in loop formations, creating a structure imbued with elasticity and stretchability. These fibers possess both elasticity and resilience, enabling the elastic band to stretch and subsequently return to its original size. This characteristic allows for a comfortable fit on the user's body, providing comfortable wear during various exercises and activities. The fabric contained 20% rubber fiber (spandex) with a multifilament structure between the PET fibers. With the advantages of a good elasticity recovery rate and low hysteresis owing to the spandex, the E-band is comfortable to wear as a smart wearable device. It can be used as a stretch sensor through the coating and padding processes. Figure 2 shows the fabrication of the stretch sensor. Single-Walled Carbon Nanotubes (SWCNT) is a cylindrical carbon nanostructure. It exhibits excellent conductivity and is commonly utilized in creating conductive sensors from textiles.
28
SWCNT ink (0.1 wt%) is stirred for at least 1h in an ultrasonic machine at a spin speed of 1000 rpm to avoid the incorporation of air bubbles and ensure uniform distribution on the surface of the fabric. The E-band was immersed in 0.1 wt% water-based SWCNT for 1 min, and conductive particles were penetrated through a dipping padding machine (DAELIM Lab., Seoul, Republic of Korea). Afterward, the excess water in the fabric is removed with a two-way drying machine (DAELIM Lab., Seoul, Republic of Korea) with temperatures ranging from 80°C to 100°C for 5 min, and the speed of the circulation fan is 1500 rpm. Finally, the fabrics were incubated at room temperature for 1 h. The fabrication process of the SWCNT-PET/SP stretch sensor and arm sleeve.
Figure 3 shows textile structure. It was examined using an LCD Digital Microscope (PS-EM306, PS Co. LTD, china). It was possible to observe the SWCNT particles to a certain extent, and the presence of span yarn in the center of the knit structure suggested the potential for strong elasticity. A SEM(Scanning Electron Microscope) (Gemini SEM 300 from ZEISS Co. Ltd, Oberkochen, Germany) was used to evaluate the structure and surface morphology of the SWCNT-coated E-band. SEM microphotographs from 1 k to 2 k magnification of coating samples are show in Figure 3. As can be seen, the SWCNTs were well dispersed around the surface of the filament yarn. The SWCNT PET/SP stretch sensor image (a) LCD Digital Microscope (b) SEM
Figure 4 shows the method of fabricating a sleeve device to measure muscle volume expansion. The arm warmer (Nike, Portland, USA) is an arm sleeve consisting of PET/SP (88:12), which has a material composition similar to that of the E-band. This sleeve is strong because it has two stitches and feels comfortable while exercising because it can quickly remove sweat and moisture. Stretch sensors were attached to the maximum expansion points of the arm muscles.29,30 The brachioradialis/flexor carpi radialis, biceps brachii, and triceps brachii muscles have three sensors attached perpendicular to the direction of the muscle fibers. The elbow joint angle was measured by attaching a stretching sensor to the elbow. To prevent the sensors from being stretched when the sleeve was worn and account for arm size variations among individuals, one end was fixed with a PU(PolyUrethane) film, while the other end was attached in a Velcro format. PU has high elasticity and tensile strength, allowing it to securely fasten the strain sensor. Velcro also offers strong adhesion, preventing it from coming off during muscle expansion. The method for fabricating a sleeve device to measure muscle volume expansion.
Data acquisition protocol
The exercise involved bicep barbell curls for 60s, with a 1-min rest, and the process was repeated three times. To compare muscle volume expansion under different grip strengths, the experiment was conducted under the same conditions after adjusting the grip strength to 22.05 lb (10kg) and 66.14 lb (30 kg) using a dynamometer. An IMU 9-axis sensor (E2BOX, Seoul, Republic of Korea) was used to measure the angle of the elbow joint during the exercise. However, there is a potential issue with the gimbal lock when the Euler angle moves more than 180°, which can cause a loss of information about the orientation of the sensor. To prevent gimbal lock during the exercise, the range of motion was limited by lifting the arm from 0° to 100° relative to the starting position.31,32 Figure 5 shows the names of the muscles and the angle of the elbow during the biceps barbell curl. Biceps barbell curl exercise movement and muscle names.
To measure the angle using only the stretch sensor without the nine-axis IMU 9-axis sensor, a stretch sensor was attached to the elbow. Figure 6 shows the process of muscle volume expansion and decomposition. The stretch sensor measures the change in voltage when the sensor is stretched and can be used to estimate the angle of the elbow joint. The sampling frequency of the IMU 9-axis and stretch sensor was 33 Hz, and to remove the noise inherent in the fabric, a low-pass filter (LPF) with a cut-off frequency of 3 Hz was applied as a pre-processing step. A function is obtained by fitting the data from the stretch sensor voltage measured at the elbow and converting the angle to the Euler angle data from the IMU 9-axis sensor. In this research, data from the stretch sensor was collected using Arduino BLE (Bluetooth Low Energy) for data acquisition. Four channels were employed in the stretch sensor configuration, with each corresponding fixed resistor set to 10 kΩ based on the voltage division principle. Using this function, the voltage of the stretch sensor was directly converted into an angle and input as data to a Multi-Layer Perceptron. The output modeled the muscle volume expansion of the three muscle areas in a 1:1 ratio and analyzed the decomposition of the muscle volume expansion by fitting it in a 1:3 ratio. Process of the muscle volume expansion decomposition. (a) block diagram of equations for the stretch sensor attached to the elbow and the IMU 9-axis sensor (b) block diagram of multi-layer perceptron (c) block diagram of muscle volume expansion decomposition.
Multi-Layer perceptron
Accurate fitting is crucial for analyzing the decomposition of muscle volume expansion. Therefore, we utilized a Multi-Layer Perceptron (MLP), a type of artificial neural network for handling complex nonlinear relationships and achieving high accuracy in data fitting.
33
MLP consists of multiple layers of perceptrons, which are mathematical models that simulate the behavior of neurons in the brain.
34
Each perceptron uses a weighted sum of the inputs and applies an activation function to produce an output.
35
The outputs from one layer of perceptrons become the inputs to the next layer, and this process continues until the final output is produced. MLP can learn from input-output pairs and adjust the weights between perceptrons to minimize the error between the predicted and actual outputs.
36
It sets the training function to Levenberg-Marquardt backpropagation and creates a network with 10 neurons in each of the two hidden layers. The data were then divided into training, validation, and testing sets in a 70:15:15 ratio. The network is trained using the "train" function with a maximum of 1000 epochs, a goal of 0, and a learning rate of 0.01. The network was then tested on the training data, and the MSE (Mean Squared Error) was calculated. MSE is a metric that calculates the average of the squared differences between actual observed values and predicted values. A lower MSE indicates that the model performs better in making predictions. The equation represent the calculation of a MLP. (1) represent input layer. (2) and (3) represent the calculation of weight and biases for the Hidden layer. (4) represent the Output layer.


Results
Characterization of the stretch sensor
Stretchability and sensitivity
Stretchability and sensitivity were tested in a laboratory using a customized UTM. Figure 7 shows the resistance-stretch relationship of the sensor sample. The structure of the PET/SP fabric is one of the main reasons for the high stretchability (yield point, εy ≈ 50%) of the resistive type of sensor reported in this research. The elasticity of the E-band did not reach saturation until the sensor was 50% complete.
28
The average strain measured by the stretch sensors was less than 30% during bicep barbell curls with the sleeve device. This suggests that stretch sensors are sufficient for measuring muscle volume expansion during exercise. As the length of the stretch sensor increased, the resistance also increased. The Gauge Factor (GF) is an index that measures the sensitivity of a stretch sensor by resistance change/length change. The GF of the stretch sensor (40 × 40 mm) was 50.48. Based on the calculated GF values, the stretch sensor is sensitive and suitable for the applications in this study. Characteristics of the stretchability and sensitivity.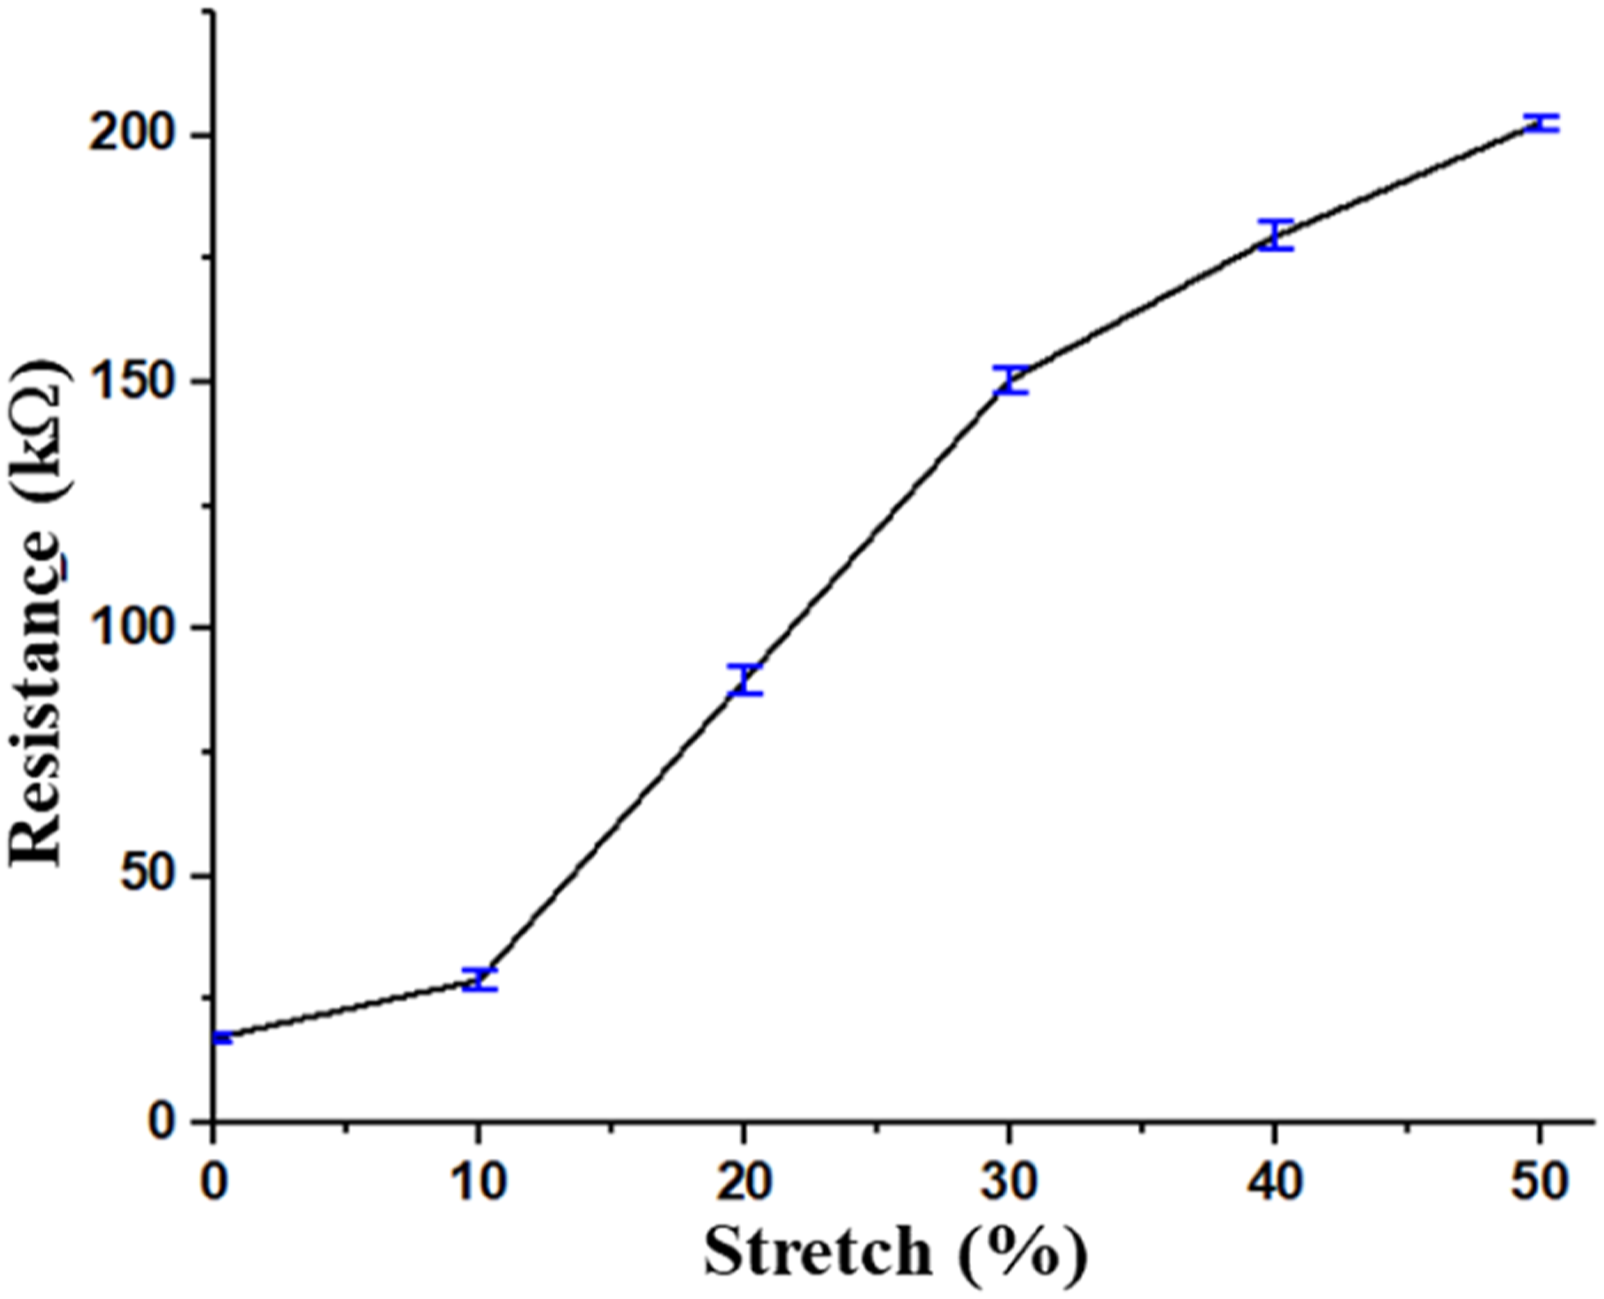

Durability
The stable electrical functionality and mechanical integrity of the stretch sensor during stretching/releasing cycles are defined as dynamic durability. This durability is affected by the fatigue and plastic deformation of the PET/SP fibers under high stress, which can damage both the PET fibers and the sensing nanomaterials (SWCNTs). A customized UTM was used in the laboratory to test the durability of the tension tests. The fabric surface remained intact even after 1000 stretching/releasing cycles, indicating that the sensor’s performance was not affected by repeated stretching below 50% within 1000 cycles. Figure 8 shows the uniform resistance of the samples obtained by controlling the stretch of the UTM machine. Resistance changes of less than 10% were observed in all the samples after 1000 cycles at 50% tension. Characteristics of the durability.
Measuring angles using stretch sensors
The stretch sensor is inversely proportional to its cross-sectional area and directly proportional to its length (6). A stretch sensor was attached to the elbow strain, which increased its resistance when lifting the arm and contracted and decreased its resistance when lowering the arm. According to the voltage divider rule (7), when the current is constant, the voltage across the sensor increases with the resistance. The fixed resistance is 10kΩ, and the variable resistance is the resistance of the stretch sensor. As shown in Figure 9, the Euler angle of the IMU sensor was converted from 0 to 360° and fitted with a quadratic function. During the biceps barbell curl, the stretch sensor voltage and IMU angle were related by the function Fitting quadratic function to the relationship between the Voltage of the stretch sensor and the angle of the IMU 9-axis sensor.


Multi-Layer perceptron regression
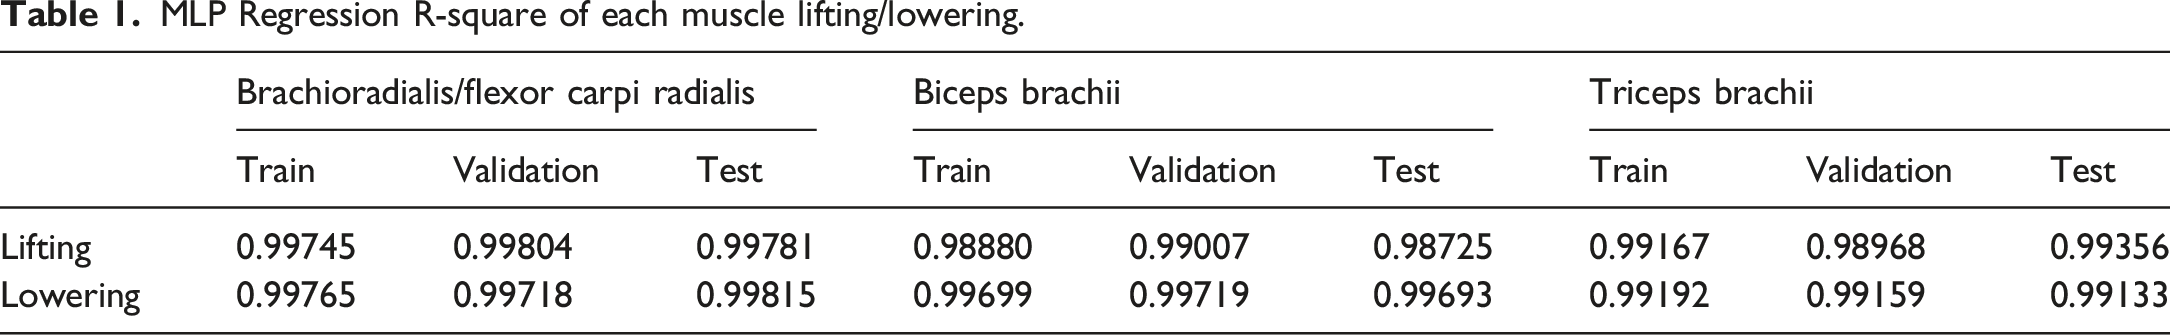
Angle data were obtained by attaching a stretch sensor to the elbow using a premade function. The angle data were input into an MLP model, with the target outputs being the brachioradialis/flexor carpi radialis, biceps brachii, and triceps brachii muscles. This MLP regression was trained by fitting the angle and each 3 muscles in a 1:1 ratio. Figure 10 shows the linear regression analysis results with the correlation coefficient R for each muscle during lifting and lowering with a grip strength of 22.05 lb (10kg). The horizontal axis represents the expected output (Target) and the vertical axis shows the values obtained by each topology. R-squared is a statistical measure that represents the proportion of the variance in the dependent variable that can be explained by the independent variables in the model. It ranges from 0 to 1, with a higher value indicating a better fit of the model to the data. Table 1 shows the R-squared values for each muscle during lifting and lowering of the arm. Overall, the model provided a good fit for all three muscles, with R-squared values ranging from Train set 0.98880 to 0.99765, Validation set 0.98968 to 0.99804, and Test set 0.98725 to 0.99815. The high R-squared value provides evidence of the effectiveness and reliability of the model. These results demonstrate the effectiveness of using MLP to predict muscle volume expansion based on elbow angle data. MLP Regression (a) brachioradialis/flexor carpi radialis-lifting (b) biceps brachii-lifting (c) triceps brachii-lifting (d) brachioradialis/flexor carpi radialis-lowering (e) biceps brachii-lowering (f) triceps brachii-lowering. MLP Regression R-square of each muscle lifting/lowering.
Decomposition of muscle volume expansion
The voltage of the sensor increased owing to the expansion of muscle volume. The MLP model was trained at a 1:1 ratio for each muscle. Figure 11 shows the volume expansion of the brachioradialis/flexor carpi radialis, biceps brachii, and triceps brachii muscles at different angles during the lifting and lowering of the arm fitted with a 1:3 ratio using this model. This was consistent, regardless of grip strength. However, with higher grip strength, the biceps brachii and triceps brachii muscles showed greater volume expansion. While there was a minor muscle volume expansion observed, both lower (22.05lb) and higher grip (66.14lb) strengths demonstrated similar patterns of volume expansion. When the arm is lifted, the agonist (biceps brachii) muscle initiates muscle volume expansion first, while the synergistic (brachioradialis/flexor carpi radialis) muscles begin to rapidly expand from around 60°, assisting the biceps brachii. The antagonist (triceps brachii) muscles show minimal expansion initially but help prevent strain on the joint starting from around 90°. Similar results were obtained when the arm was lowered. The muscle volume expansion was decomposed at 10° intervals during the bicep barbell curl from 0 to 100°. Figure 12 depicts muscle volume increase during a biceps barbell curl exercise performed with lower grip strength and higher grip strength. The relationship between angle and voltage (muscle volume expansion) - lower grip (a) biceps barbell curl lifting (b) biceps barbell curl lowering. Rescale graphs of the brachioradialis/flexor carpi radialis, biceps, and triceps muscles at 10° intervals. (a) biceps barbell curl lifting-lower grip strength (b) biceps barbell curl lifting lowering-lower grip strength.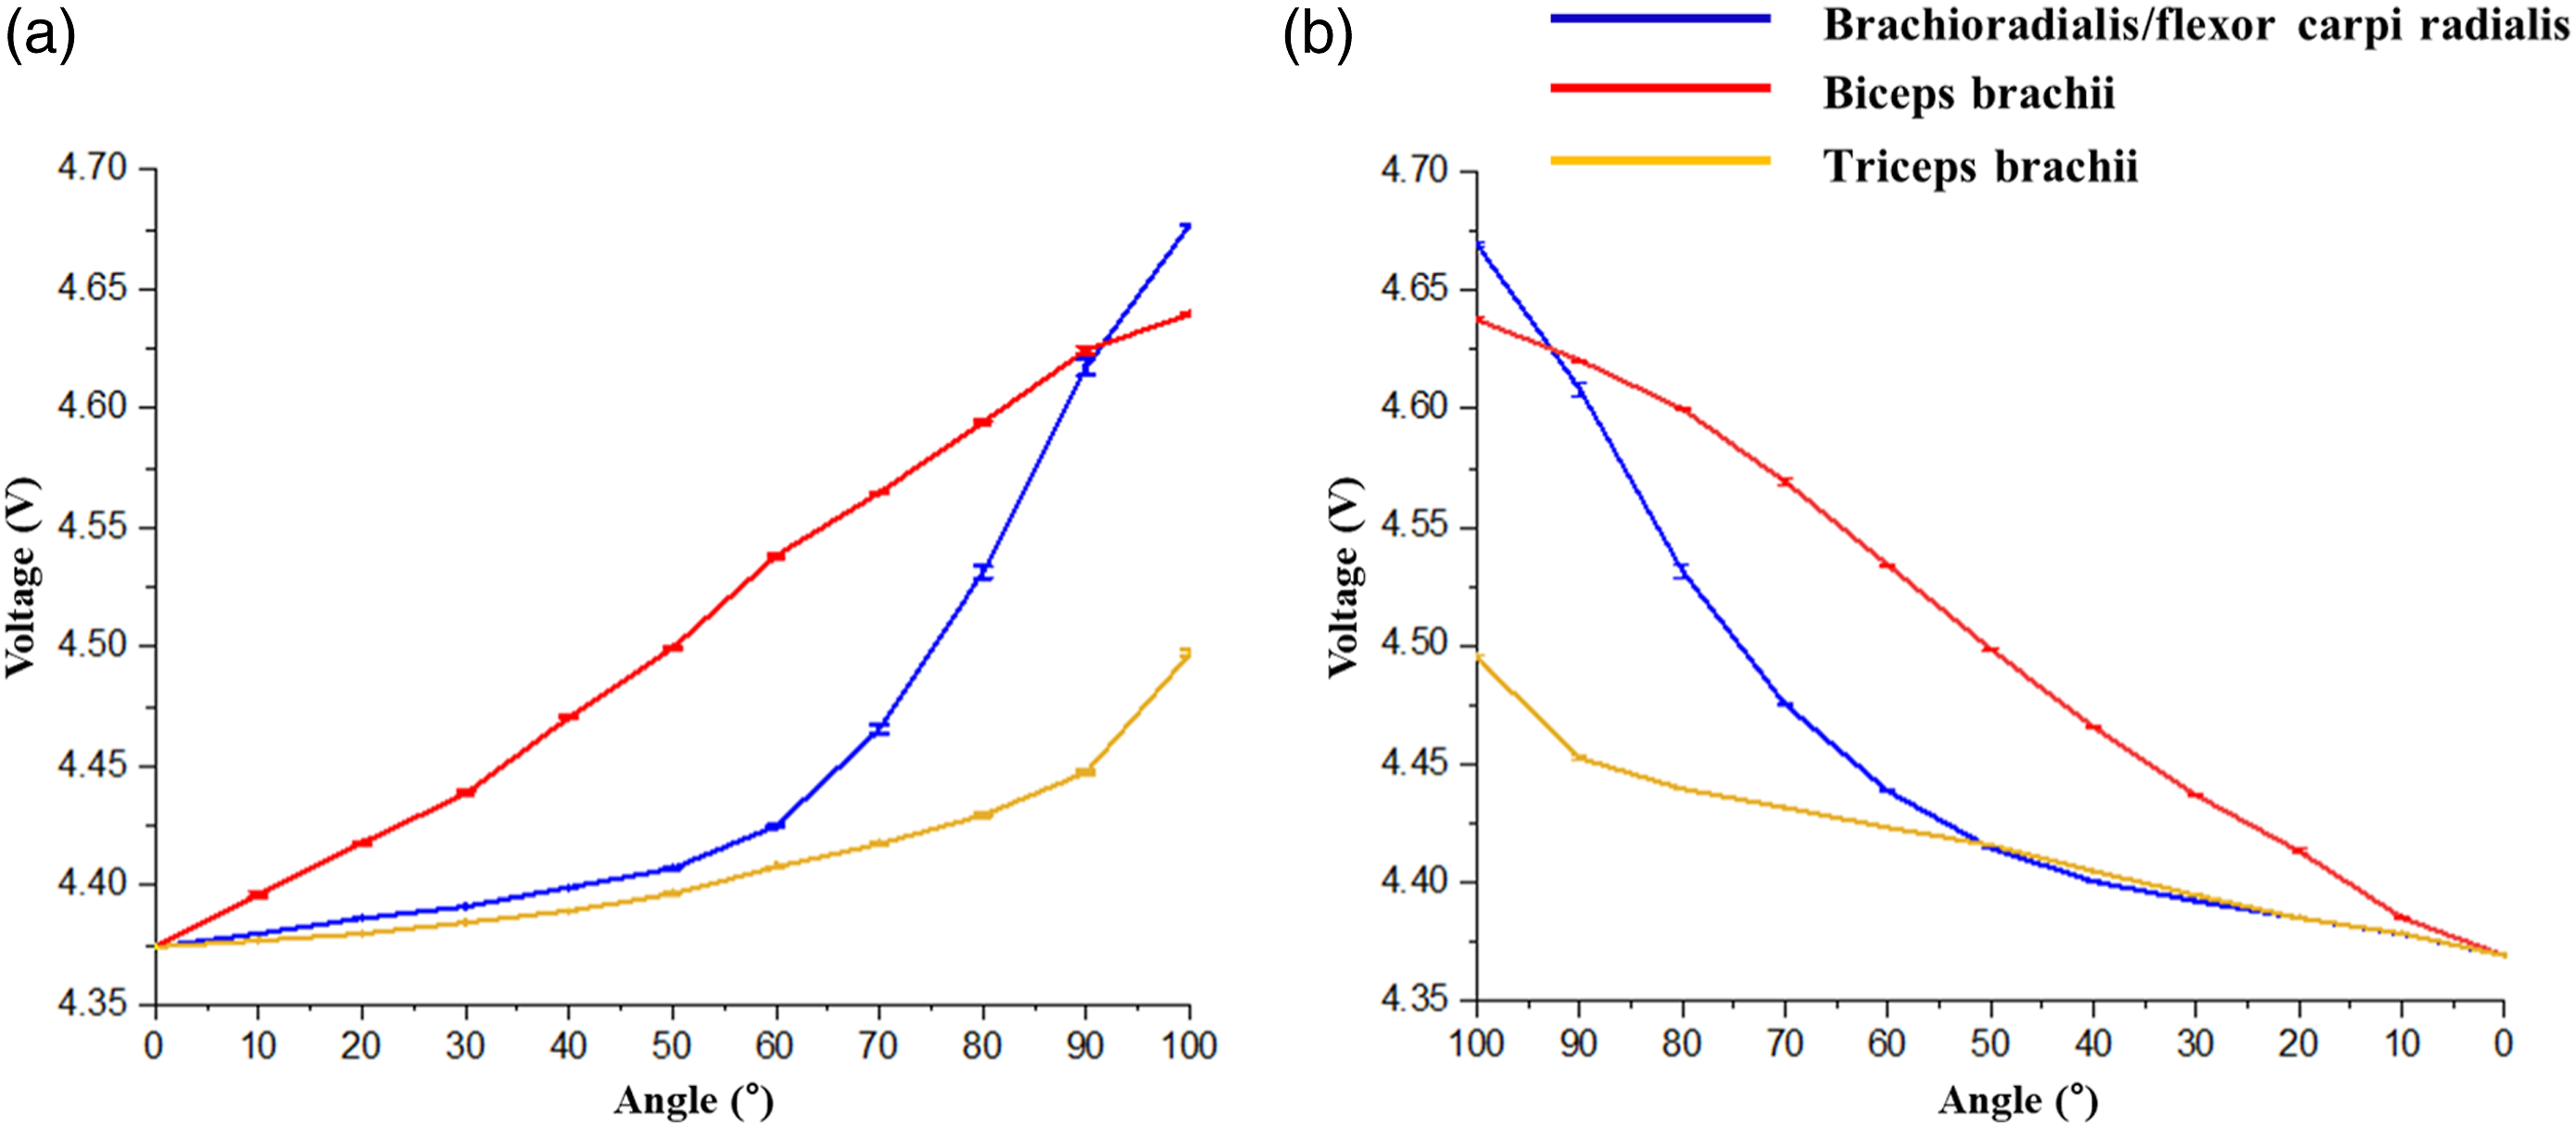

Figure 13 shows the decomposition of muscle volume expansion. At an elbow angle of 10°, the biceps brachii muscle showed a similar rate of expansion of approximately 70%, regardless of grip strength, whereas the triceps brachii muscle showed a significantly higher rate of expansion with higher grip strength, and the brachioradialis/flexor carpi radialis showed relatively low expansion. At the elbow’s peak angle (100°), the rate of muscle volume expansion was similar regardless of grip strength. When the elbow was lowered from 100°, the rate of expansion decreased similarly. At the lowest point (10°), the expansion rate of the brachioradialis/flexor carpi radialis muscle was relatively low with higher grip strength. Although the overall shapes of the graphs were similar regardless of grip strength, there were differences in the brachioradialis/flexor carpi radialis, and triceps brachii muscles between the beginning and end of the exercise Table 2. Decomposition of muscle volume expansion rate (a) biceps barbell curl lifting-lower grip strength (b) biceps barbell curl lowering-lower grip strength (c) biceps barbell curl lifting-higher grip strength (d) biceps barbell curl lowering-higher grip strength. The voltage difference based on the angle between a low grip and a high grip.

Conclusions
This research fabricated a SWCNT-PET/SP Stretch sensor that enables the measurement of muscle volume expansion in a wearable form. We attached a stretch sensor to the elbow to obtain the arm angle during the biceps barbell curl using an IMU 9-axis sensor and derived the relationship equation. Using the MLP, we identified the relationship between the volume expansion of the brachioradialis/flexor carpi radialis, biceps brachii, and triceps brachii muscles for each angle with a high R-square and decomposed it. Understanding the relationship between agonists (biceps brachii), synergists (brachioradialis/flexor carpi radialis), and antagonists (triceps brachii) during exercise is crucial not only for injury prevention but also for identifying the targeted area of the body. Although various methods are available for measuring muscle activity, this study proposes a simple method for measuring muscle activity in a wearable device. The results of the decomposition of muscle volume expansion showed that the brachioradialis/flexor carpi radialis slightly expanded up to 60° and rapidly expanded thereafter, whereas the biceps brachii muscle volume steadily increased from 0 to 100°, and the triceps brachii muscle volume slightly expanded but increased rapidly from 90°. Although the decomposition of muscle volume expansion was similar with and without grip strength, the brachioradialis/flexor carpi radialis muscle expansion was relatively low at the initial (10°) and final (10°) angles during lifting and lowering with grip strength. This finding provides insight into the activation patterns of these muscles during bicep curls, which could be useful for athletes and individuals seeking to target specific muscles during workouts.
Footnotes
Declaration of conflicting interests
The author(s) declared no potential conflicts of interest with respect to the research, authorship, and/or publication of this article.
Funding
The author(s) disclosed receipt of the following financial support for the research, authorship, and/or publication of this article: This work was supported by the Korea Institute for Advancement of Technology (KIAT) grant funded by the Korea Government (MOTIE) (P0012770, The Competency Development Program for Industry Specialist).