
Abstract
In this study, the authors proposed a method to fabricate a resistive stretch textile sensor from polyester spandex (PET/SP) fabric and commercial single-walled carbon nanotube (SWCNT). In addition, we designed and trained a one-dimension convolutional neural network to classify four resistance workouts, which employed data acquired from the proposed sensor as the input. To figure out the most appropriate PET/SP sample for the deep learning application, we investigated morphologies and characterization of three samples in distinct conditions of the coating process. Data acquired from the proposed sensor illustrated the significant difference between activated and non-activated muscle groups in each specific exercise. With the PET/SP sample which met the requirements of the application, after 100 epochs, the deep learning model achieved 97.2% training accuracy and 90% test accuracy. This study demonstrates that the SWCNT-coated PET/SP stretch textile sensor can be utilized effectively to track the activity of forearm muscles during resistance training. Other than that, the proposed 1D-CNN, with the advantage of training time and computational cost, is able to classify time series data with high performance and thus can be applied widely in various deep learning applications, especially in the healthcare and sports industries.
Keywords
Introduction
Resistance training, or strength training, is an intense practice of loads, body movements, and velocities to improve strength power, endurance, and hypertrophy of muscles.1,2 Nowadays, resistance training has become a trend because of its health-related benefits.3–6 For beginners, creating a resistance training program is to build strength and muscle mass safely and effectively. For individuals with specific goals, developing resistance training plans helps improve posture or increase upper body strength. Consequently, various methods have been proposed to appraise the effects of resistant training by some metrics. McBride, et al. evaluated several metrics such as volume load, time under tension, maximum dynamic strength volume load, and total work, to determine the volume of resistance exercise. 7 Jung, et al. employed infrared thermal images and heat maps to detect muscle activation. 8 Another study was carried out to examine the correlation between a metric called resistance training density and a marker of metabolic stress. 9 However, these methods still presented some drawbacks due to the time-consuming procedure and special requirements of equipment.10–13 Other than that, they are not suitable for muscle activity in real-time and thus, not applied widely in practice.
During resistance training, muscle contraction consists of three types: isometric contraction, concentric contraction, which causes an increase in muscle size horizontally, and eccentric contraction, which decreases the muscle size horizontally (Figure 1). Therefore, much research has been conducted to evaluate the relationship between muscle activation and muscle contraction.6–8,14,15 One of the most common methods to gain information about muscle is measuring electromyography signal (EMG). Nevertheless, the EMG test requires either skin-adherent or needling electrodes to acquire data, which is not suitable for monitoring muscle activities during applications in training. A study showed that a combination of textile stretch sensors and spandex fabric could track the limb motions and reflect the difference in terms of the cycle of motions in various exercises, thus presenting some machine learning models to classify them. However, this method was not effective when classifying exercises that have similar movement speeds. Li, et al. designed a wearable stretch sensor capable of tracking human joint motions,
16
based on a triboelectric nanogenerator. However, the sensor was mounted into the shirt and had direct contact with the skin, which may cause discomfort to the users. The sensor fabrication process involved a lot of complicated technologies such as 3D printing, flex-printed circuit boards, and other assembly materials. Three types of muscle contraction during resistance training and the state of muscle during each type.
Recently, the need to monitor muscle activation during workouts and physical activity has increased because of its benefits.17–20 It can be employed to evaluate the effectiveness of different types of exercise equipment and workout programs. Additionally, it develops a database of muscle activation patterns that can be served in research to determine the correlation between muscle activity and overall body strength. Therefore, in this study, the authors aimed to develop an arm sleeve that deployed stretch sensors to detect forearm muscle activation during resistance training. Data were acquired from three stretch sensors attached to the arm sleeve during four forearm muscle exercises which are: Wrist Curl, Biceps Curl, Seated Barbell Triceps Extension, and Dumbbell Kickback. To evaluate the performance of the proposed methods, a deep learning model was trained and tested on the pre-processed data for the classification of the exercises based on the activation of the forearm muscles during each workout.
Materials and methods
Materials - sensor fabrication
In this study, the author fabricated the stretch sensor by converting polyester spandex fabric in the form of a band into conductive fibers by coating it with the commercial single-walled carbon nanotube (SWCNT) with the SWCNT-weight percentage of 0.1% and the SWCNT diameter ranges between 1.1 and 1.4 nm (KORBON Co., Ltd, Korea). Polyester spandex (PET/SP) fabric with a ratio of PET and SP of 80:20, respectively, is a good choice for sportswear
21
due to its high durability and ease to wash. The fabrication procedure to coat PET/SP fabric with SWCNT is illustrated in Figure 2. To turn the fabric into conductive material, 12 PET/SP samples with various lengths (from 40 mm to 100 mm) were soaked in 100 mL of the commercial SWCNT liquid for 15 min. Next, they were padded by a vertical padder machine for the extraction of water before being heated by a two-way drying machine at the temperature of 100°C machine for 10 min. The samples were then attached on an arm sleeve (Lightweight running sleeve, Nike, Portland, OR, USA). Each SWCNT-coated sample (or the stretch sensor) was placed on the arm sleeve so that when it is worn, the sensor could cover the target muscles’ length horizontally, thus tracking the muscle activation effectively. Because of that, the lengths of three stretch sensors for three groups of target muscles (1) brachioradialis and flexor carpi radialis muscle, (2) biceps brachii, (3) triceps brachii were chosen as 40 mm, 85 mm, and 55 mm, respectively. The fabrication process of the SWCNT-PET/SP Stretch sensor and arm sleeve.
Data acquisition protocol
To evaluate the characterizations and the performance of the proposed stretch sensor, a participant was asked to wear the fabricated arm sleeve and perform four forearm muscle exercises: Wrist Curl, Biceps Curl, Seated Barbell Triceps Extension, and Dumbbell Kickback, which are inlustrated in Figure 3. Each workout was carried out 10 times, and a 1-min rest was taken after each workout. During Wrist Curls, the participant held his right arm stably and only curled his wrist upward slowly (a2), then extended his wrist downward at the angle of 90° compared to the initial position (a1). Performing Biceps Curl, the participant stood with his arms straight by his sides and only moved his forearm. He curled his arm towards him (b1), paused for 2 s, and lowered it slowly (b2). To carry out Seated Barbell Triceps Extension, the participant had to sit on a chair with two hands close together and palms facing the floor. He first lifted the barbell over his head by extending his arms fully (c1) and then lowered it by bending his elbows so that his hands were behind his head, without moving his upper arms (c2). For the last exercise, Dumbbell Kickback, at the initial state, the participant tucked his right upper arm close to his torso and bent at the elbow to form a 90-degree angle with his upper arm and his forearm (d1). Next, he only moved his arm from the elbow by raising the dumbbell towards his backside until his arm was fully extended (d2). Lastly, he paused for 2 s and brought the dumbbell back to the position (d1). Figure 3 Illustration of performance of four workouts and the corresponding states of muscle contraction (a1) Wrist Curl (concentric contraction), (a2) Wrist Curl (eccentric extension), (b1) Biceps Curl (concentric contraction), (b2) Biceps Curl (eccentric contraction), (c1) Seated Barbell Triceps Extension (concentric contraction), (c2) Seated Barbell Triceps Extension (eccentric contraction) (d1) Dumbbell Kickback (concentric contraction), (d2) Dumbbell Kickback (eccentric contraction).
Data preprocessing
Normalization in statistics is a transformation that transforms data to be on a similar scale. In this study, each forearm exercise was recognized by the difference in amplitude of data acquired from three sensors corresponding to three different interested groups of forearm muscles over a time window. Figure 4 illustrates the anatomy of forearm muscles. Anatomy of the forearm muscles in the human with target muscles illustrated only.
Specifically, when the practitioner performs the Wrist Curl exercise, the brachioradialis and flexor carpi radialis muscles are activated the most. While during Bicep Curl, the primary muscle groups engaged are the biceps brachii muscle and a group of muscles from the elbow to the wrist, which are brachioradialis, flexor carpi radialis, palmaris longus, and flexor carpi ulnaris. In the Seated Barbell Triceps Extension exercise, both triceps brachii muscle and triceps brachii muscle are employed. Lastly, the Dumbbell Kickback exercise targets three heads of triceps muscles in the back of the trainer's arms, which are the lateral head, medial head, and long head of triceps brachii.
Due to the variety in sizes of the interested groups of muscles, three sensors have different lengths, which results in different scales of resistance values. Therefore, the data acquired was normalized before being fit into the deep learning model. The whole data set contains 64 sets, and each set concludes with three time series corresponding to three channels. In each set, the standard score

The standardized data set has a mean of 0 and retains the shape properties, which are the same skewness and kurtosis, of the raw data set. Figure 5 shows the raw signal acquired by the stretch sensor and the outcome of the normalization process. Normalization highlights the difference in the amplitude of data from each channel. Especially, this step is necessary when data is collected from a variety of participants with different hypertrophies of muscles. Data acquired by the stretch sensor before and after the normalization process.
Classification of forearm muscle exercises
In this study, a 1-D convolutional neural network (1D CNN) was deployed to classify the normalized time series data into four classes, which are four exercises: Wrist Curl, Biceps Curl, Seated Barbell Triceps Extension and Dumbbell Kickback, based on the patterns of the activations of three group of muscles during the workout – the group of brachioradialis, flexor carpi radialis, palmaris longus and flexor carpi ulnaris, the group of biceps brachii muscle, and the group of triceps brachii muscle. Recently, 1D CNNs has attracted a lot of attention due to their advantages over 2-D Convolutional Neural Networks (2D CNN) such as less complicated computation under analogous network, configuration, and hyperparameters; shallower architectures that are easier to train and execute; low hardware setup and low cost, which is suitable for a variety of applications.22–25
Like the conventional 2D CNNs, the input layer of the 1D CNN is a passive layer that receives the 1D signal. Because each set consists of three time series, the size of the input layer is 3. Overall, the 1D CNN model architecture employed in this study is illustrated in Figure 6. The model has two blocks of a 1-D convolution layer, an activation function, a layer normalization layer, and a dropout layer. The input time series is followed by the convolution 1D layer with the size of 24*3*1, specifically, the layer consists of 24 filters with the size of 3-by-1. Each filter in this layer implements a sequence of convolutions, and the sum of these operations is passed through the activation function, which is Rectified Linear Unit function, or ReLU for short. The activation function performs the task of evaluating whether the input to the network of each neuron is important or not, thus deciding to activate the major nodes only. ReLU function calculates and returns the value provided as input, and the value of 0 if the input is equal to or less than 0. The name of the function implies that it is linear if values are positive, yet nonlinear as it is output as 0 for negative values. Next, the layer normalization layer was utilized to normalize the activations of the previous layer. Specifically, in this layer, a transformation is applied so that the mean activation within the point remains to be close to 0, and the standard deviation is close to 1.
26
To prevent overfitting, some neurons of a layer are randomly deactivated by the dropout layer, with a dropout probability of 0.5 in this study. This dropout layer functions like a mask that randomly sets some neurons’ input to zero or nullifies them. The rest of the inputs are scaled up such that the sum of all inputs remains the same.
27
After two blocks, a 1-D global average pooling layer is used to transform the output of the 1-D convolution layers to a 1-D vector. The output of this layer is mapped to a vector of different probabilities by a fully connected layer with the output size of 4, which is the number of classes, followed by a softmax layer and lastly a classification layer. A softmax layer applies a softmax function, also called the normalized exponential function, to the input. By definition, this function takes a vector The architecture of the 1-D convolutional neural network model in this study.The input is a time series with the size of 3, the output has four neurons. The whole model consists of two blocks, each block has one convolution layer.

As mentioned above, the whole data set contains 64 sets, each set consists of three time series corresponding to three channels. These sets were split into training sets, validating sets, and test sets with the numbers 36, 8, and 20, respectively. Each set has 720 observations and the number of the sets for all four classes is the same to ensure the balance of the whole data set.
The network model architecture was defined in MATLAB software (R2021b, Mathworks Inc., Natick, MA, USA) and then trained by fine-tuning with an initial learning rate of 0.01 with the Adam optimizer and batch size of 72 for 100 epochs.
Results
Morphology of the textile sensor
The morphologies of the PET/SP fiber before and after being coated with SWCNT are illustrated in Figure 7. In which, Figure 7(a) is the scanning electron microscopy (SEM) image of a PET/SP yarn before the coating process with a smooth surface, while in Figure 7(b), it can be seen that the surface of the yarn is evenly covered with SWCNT. Evenly covering the fabric with SWCNT is important because SWCNT plays a role in creating electronic properties for the non-conductive fabric, thanks to its nano-sized electrical interface with a diameter of only a few nanometers.
28
(a) The morphology of the pristine PET/SP sample, (b), (c) The morphology of the SWCNT-coated PET/SP sample.
Simultaneously, the authors examined the correlation between the coating times, which is the time that the fabric was soaked in SWCNT, and the resistance of the coated samples. Specifically, two PET/SP samples with the same dimension of 10mm width by 100mm length were dipped in the SWCNT liquid for less than 5 min (denoted as sample 1) and 15 min (denoted as sample 2). After the coating process, the resistance values of sample 1 and sample 2 are approximately 80 kΩ and 15 kΩ, respectively. Though the coating process only creates a physical bond between SWCNT and the fabric, the result shows that if the coating time is sufficient, it will help enhance the conductivity of the PET/SP samples. According to the results of this experiment, the authors chose the PET/SP samples which were coated for 15 min for further assessments of their characteristics and the fabrication of the arm sleeve for the motion tracking application.
Characterization of the fabricated sensor
Hysteresis and Gauge factor
The hysteresis of a resistive strain sensor is demonstrated by the difference in the electrical resistance performance of the sensor when it is stretched and relaxed. To examine this correlation, the authors carried out a dynamic test that analyzed the linear regions based on data acquired from ten cycles of stretch and relaxation. In this test, the starting position of the sample is at 0% strain. The sample is stretched and released ten times, from 0% strain to 50% strain, at a speed of 2 mm/s. The hysteresis of the proposed sensor in the last cycle is plotted in Figure 8. The maximum hysteresis is computed by fitting a third-order curve to the data acquired from the dynamic test and then defining the maximum difference between the two curves. According to the outcomes, the maximum hysteresis of the SWCNT-coated stretch sensor in the dynamic test is approximately 13%, after 10 cycles. Hysteresis of the SWCNT-coated stretch sensor at the tenth cycle of the dynamic test.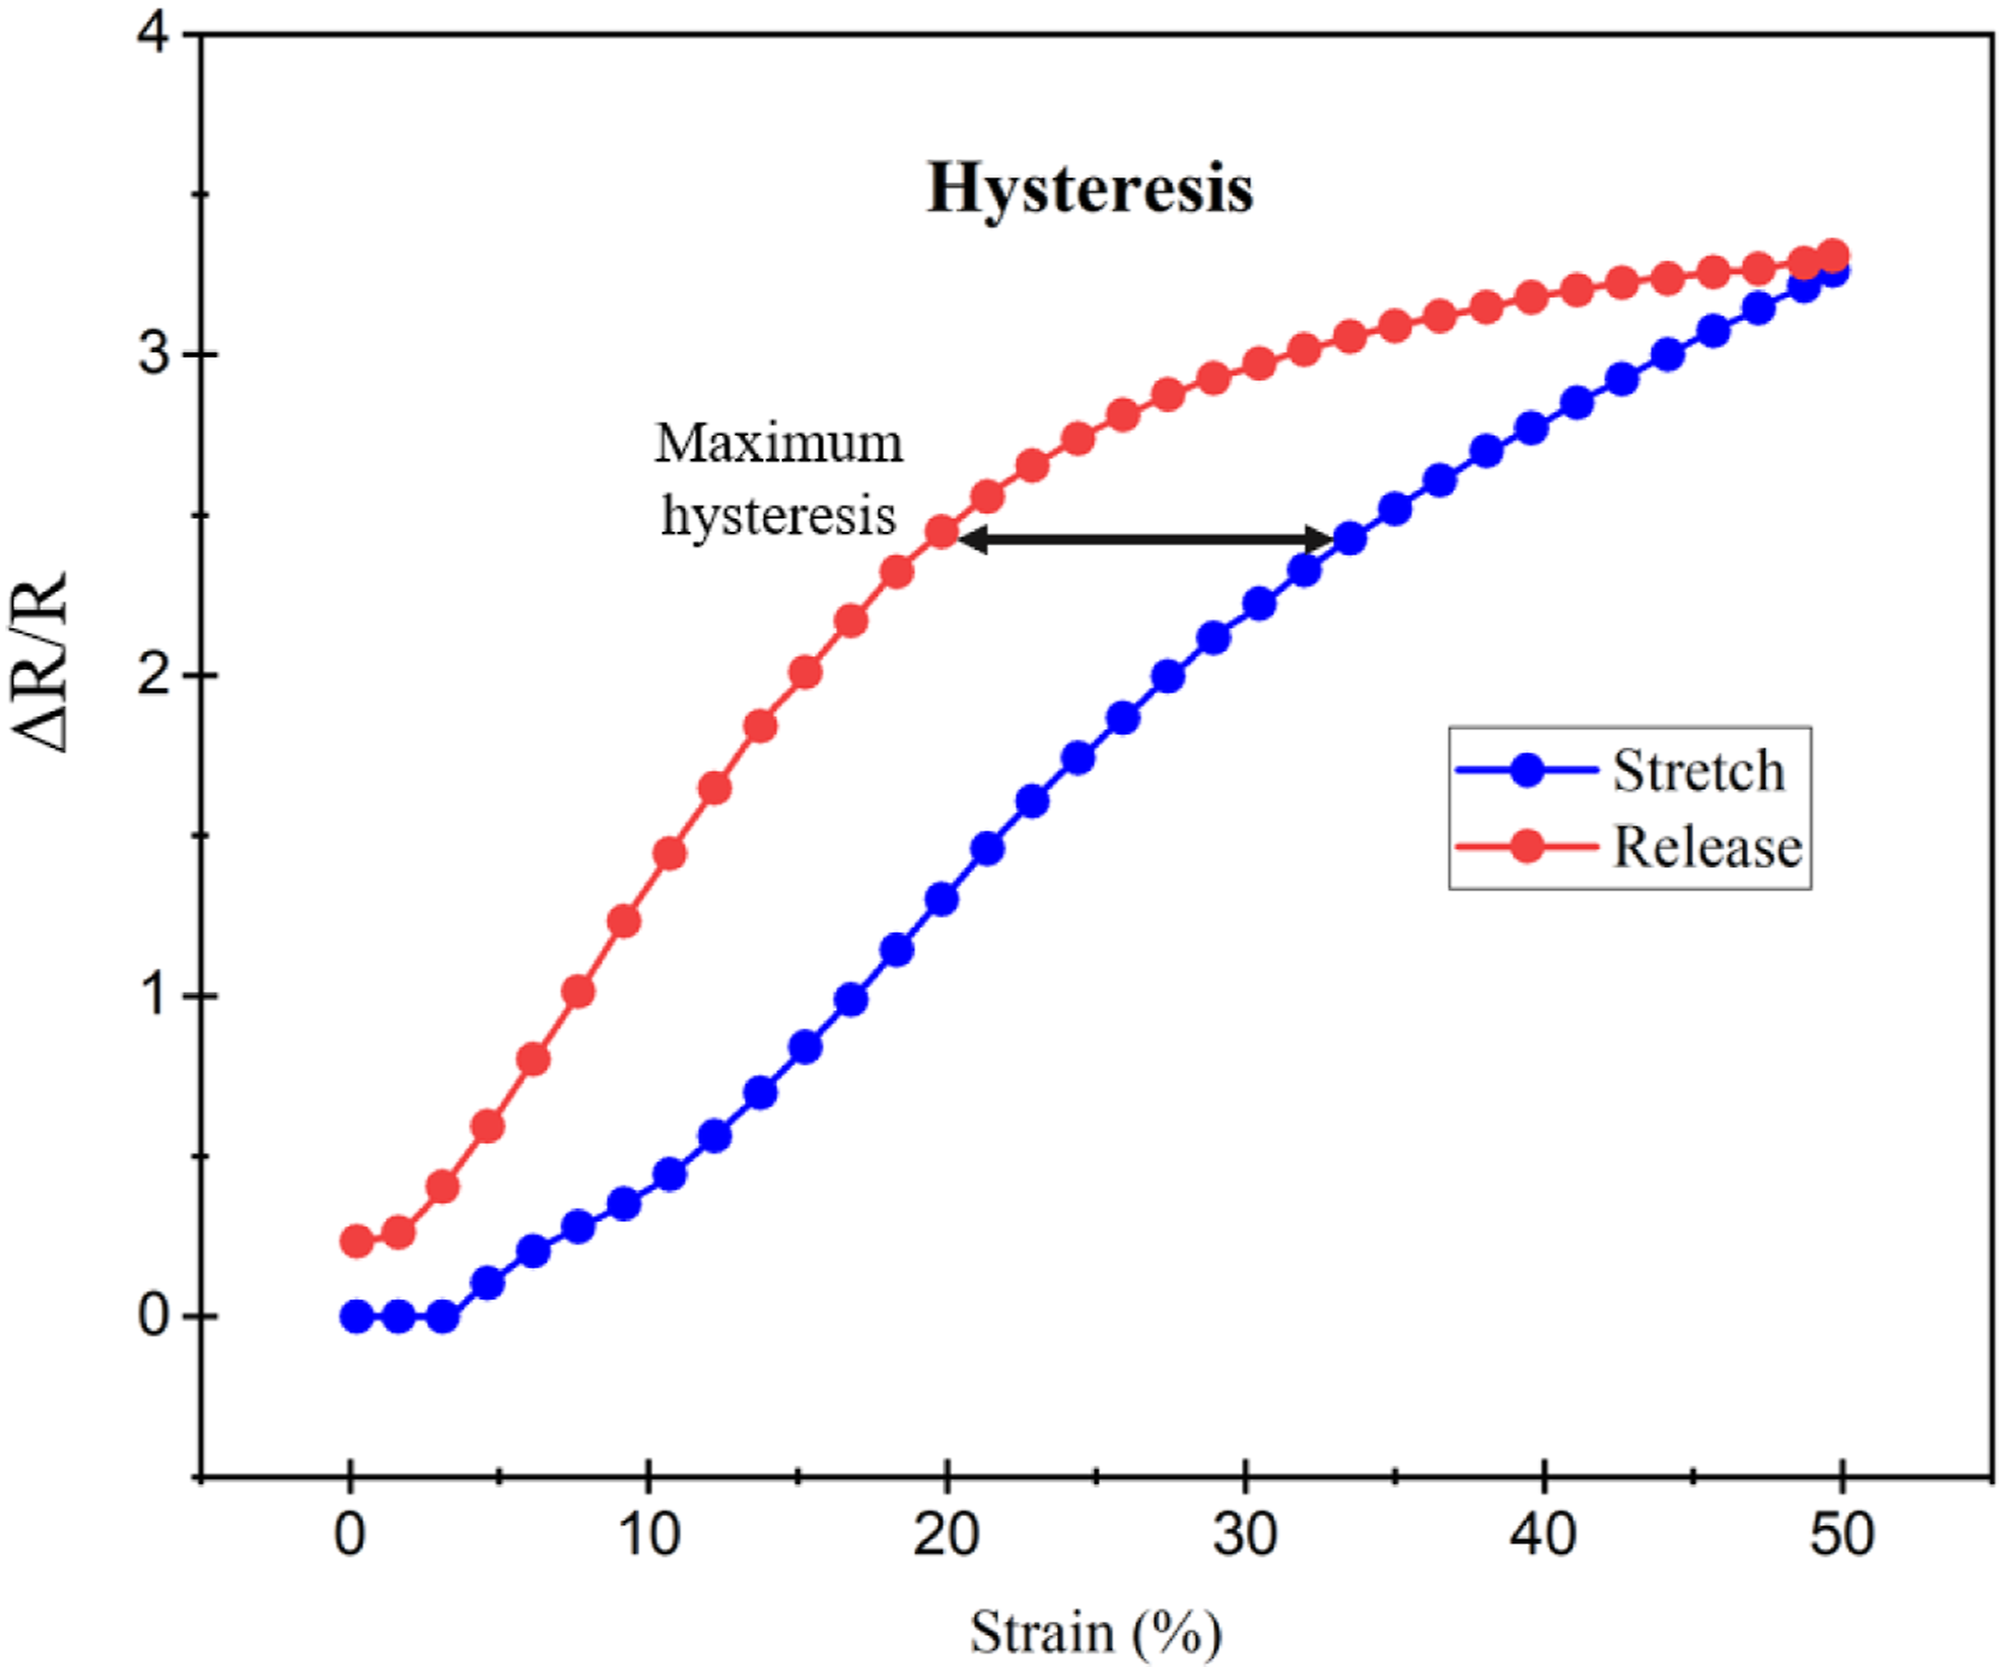
Gauge Factor (GF) is the ratio of relative change in electrical resistance (ΔR) to the mechanical strain (

Durability
In this section, the authors evaluated the durability of the proposed sensor. Similar to the hysteresis assessment, a dynamic test was performed by a universal testing machine. However, the test was carried out for 2000 cycles, from 0% strain to 50% strain, at the speed of 40 mm/s, with the results illustrated in Figure 9. Resistance changes of the proposed sensor during 2000 cycles of stretching and relaxing.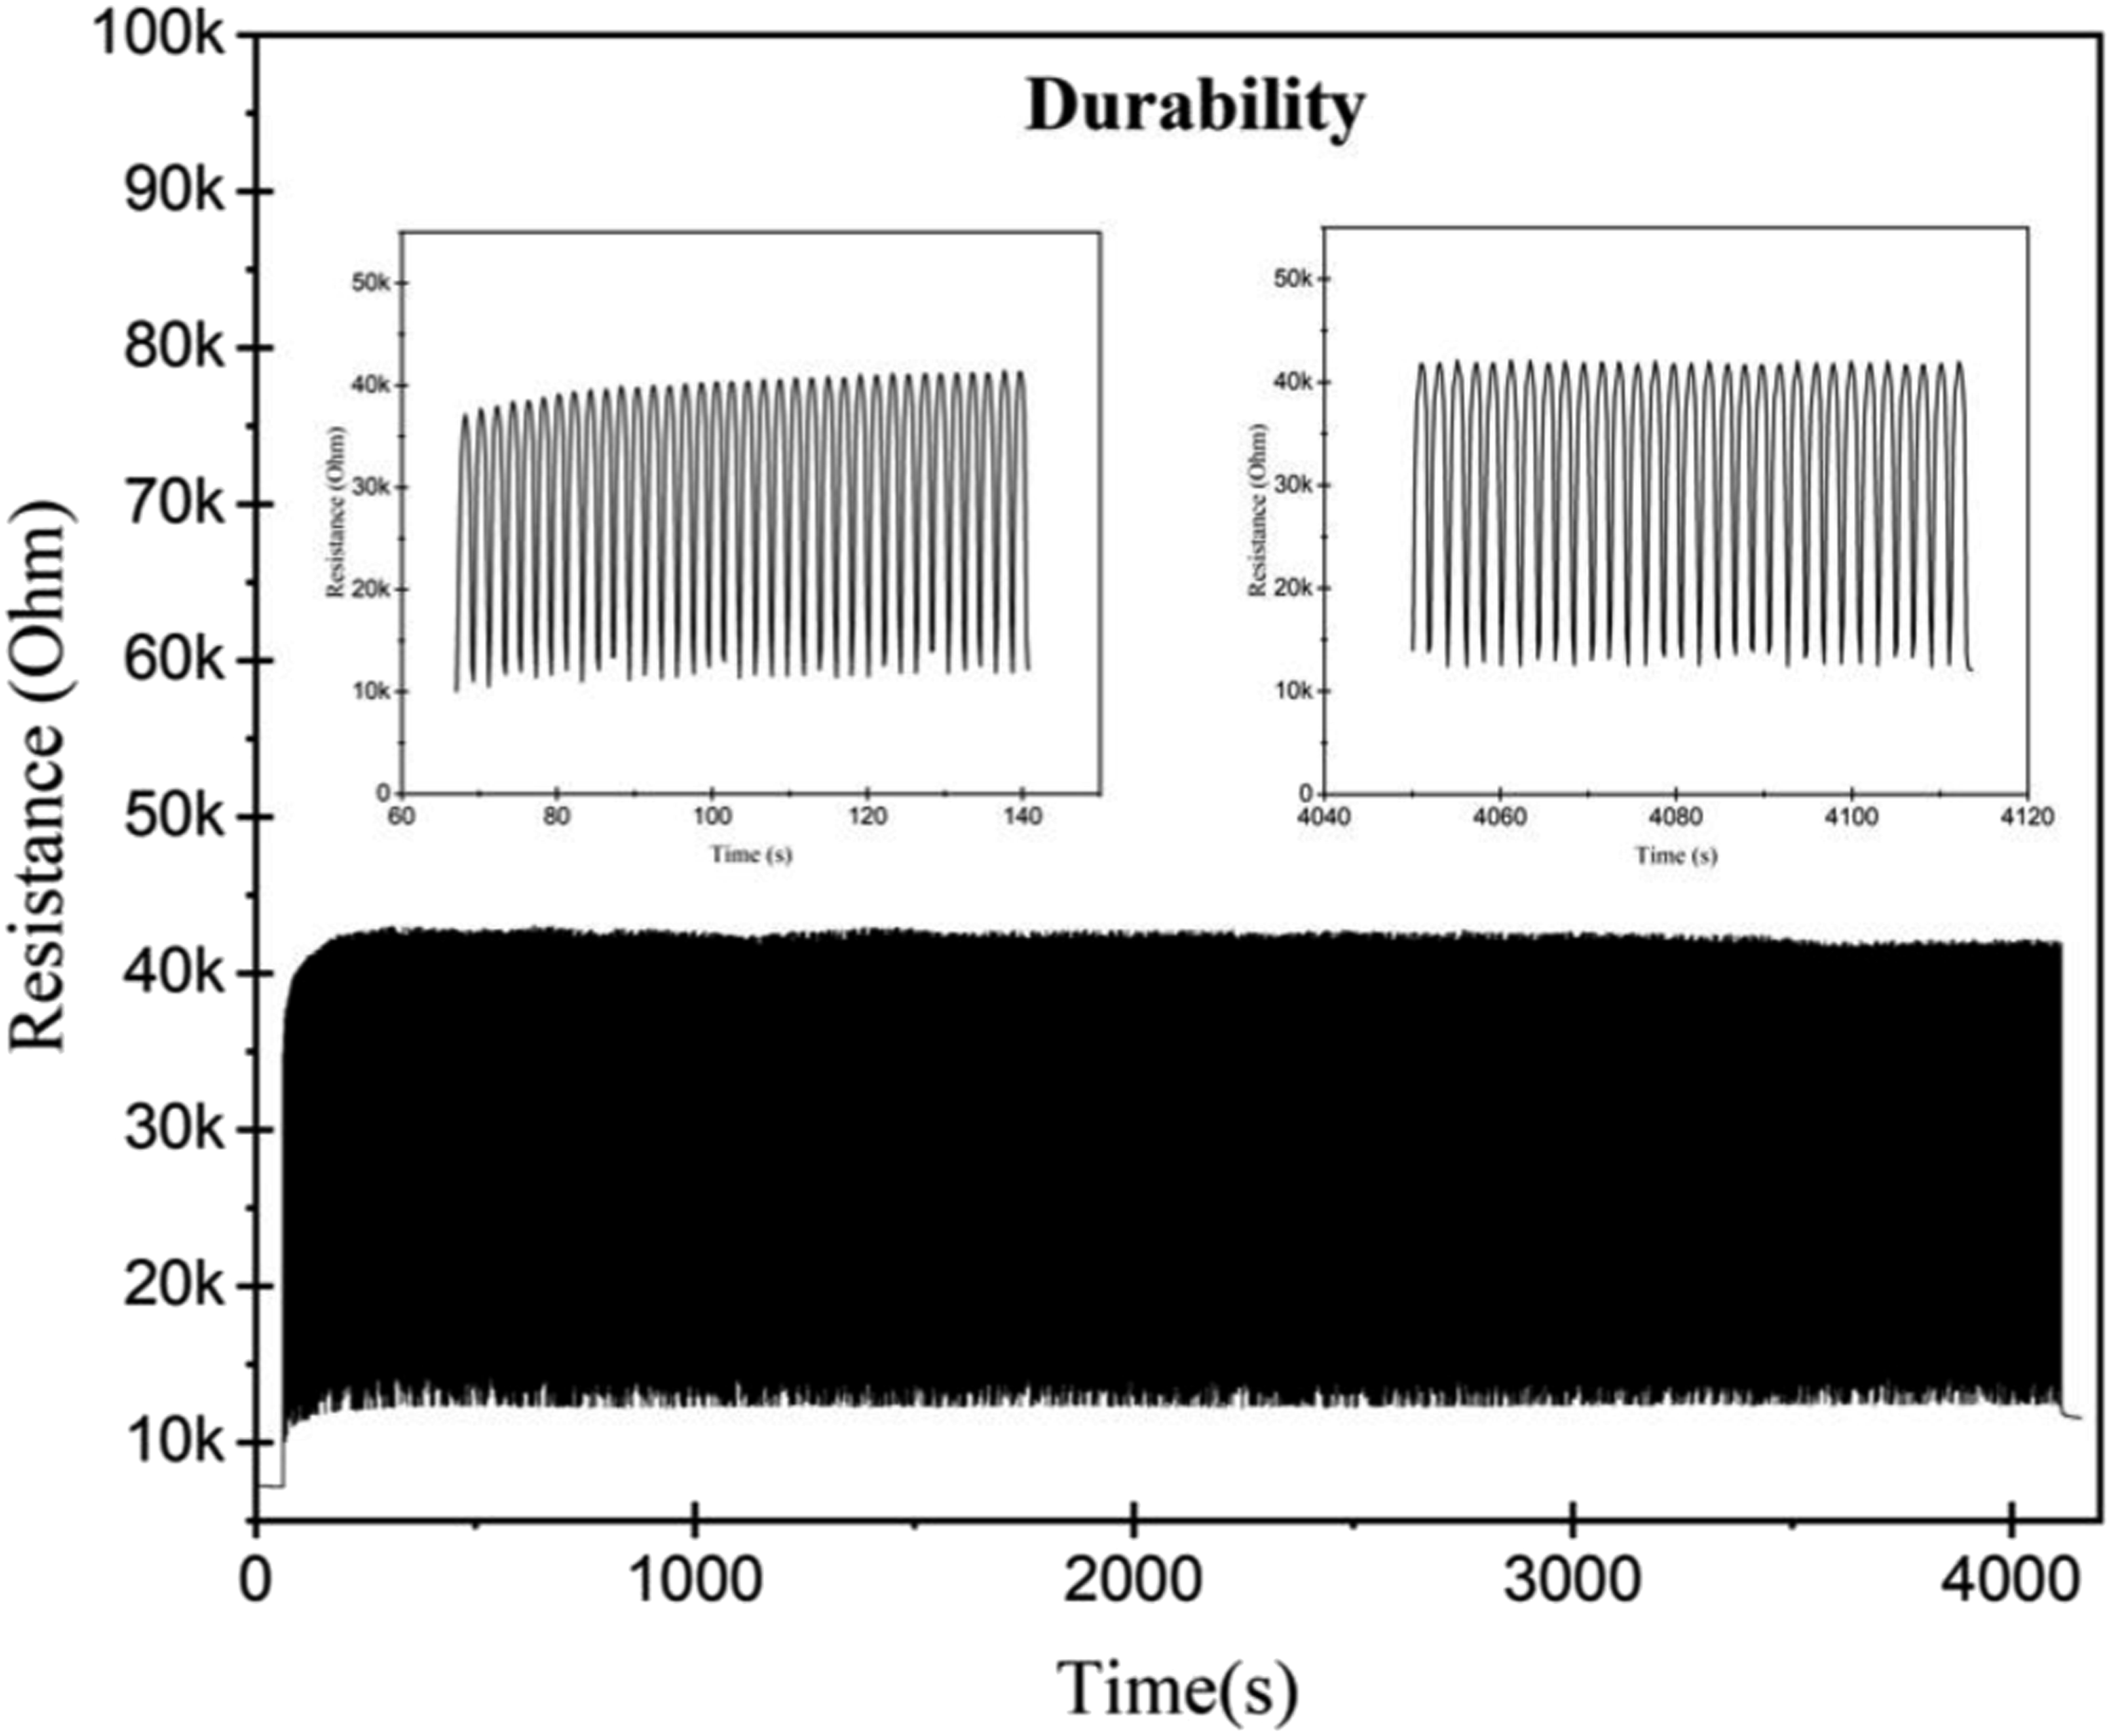
Figure 9 demonstrates the durability of the SWCNT-coated sensor after the dynamic test for 2000 cycles. The result above shows that after 20 cycles since the dynamic test began, the proposed sensor started to work stably, and this performance remained after 2000 cycles. In practice, the sensors attached to the arm sleeve are covered by polyurethane (PU) films, which helps protect the sensor during use and washing on a daily basis without diminishing the performance of the sensors. 29
Responsiveness
The responsiveness of a stretch sensor reflects how fast its electrical resistance response is to the physical change (both stretching and relaxing state states). For the applications of tracking human motions or muscle activity, responsiveness indicates how quickly the sensor responds to the movements. To evaluate this metric, the author carried out a static test and defined the response time when the state of the sensor was changed from relaxing to stretching and vice versa. At the starting point when the sensor had 10% strain, we stretched the sensor to the point where the strain was 50% at a speed of 10 mm/s and held it for 3 min, then released it to the position where the strain was 10% and kept it there for 3 min. Figure 10 shows the responsiveness of the SWCNT-coated PET/SP sample during the test. From this graph, we defined the nonlinear and linear regions in both states, the linear regions are fitted with the red lines. The time in seconds that these non-linear regions lasted for was determined by the responsiveness of the proposed strain sensor, which was approximately 17 s for the stretching state and 23 s for the relaxing state. Responsiveness of the proposed stretch sensor during the static test.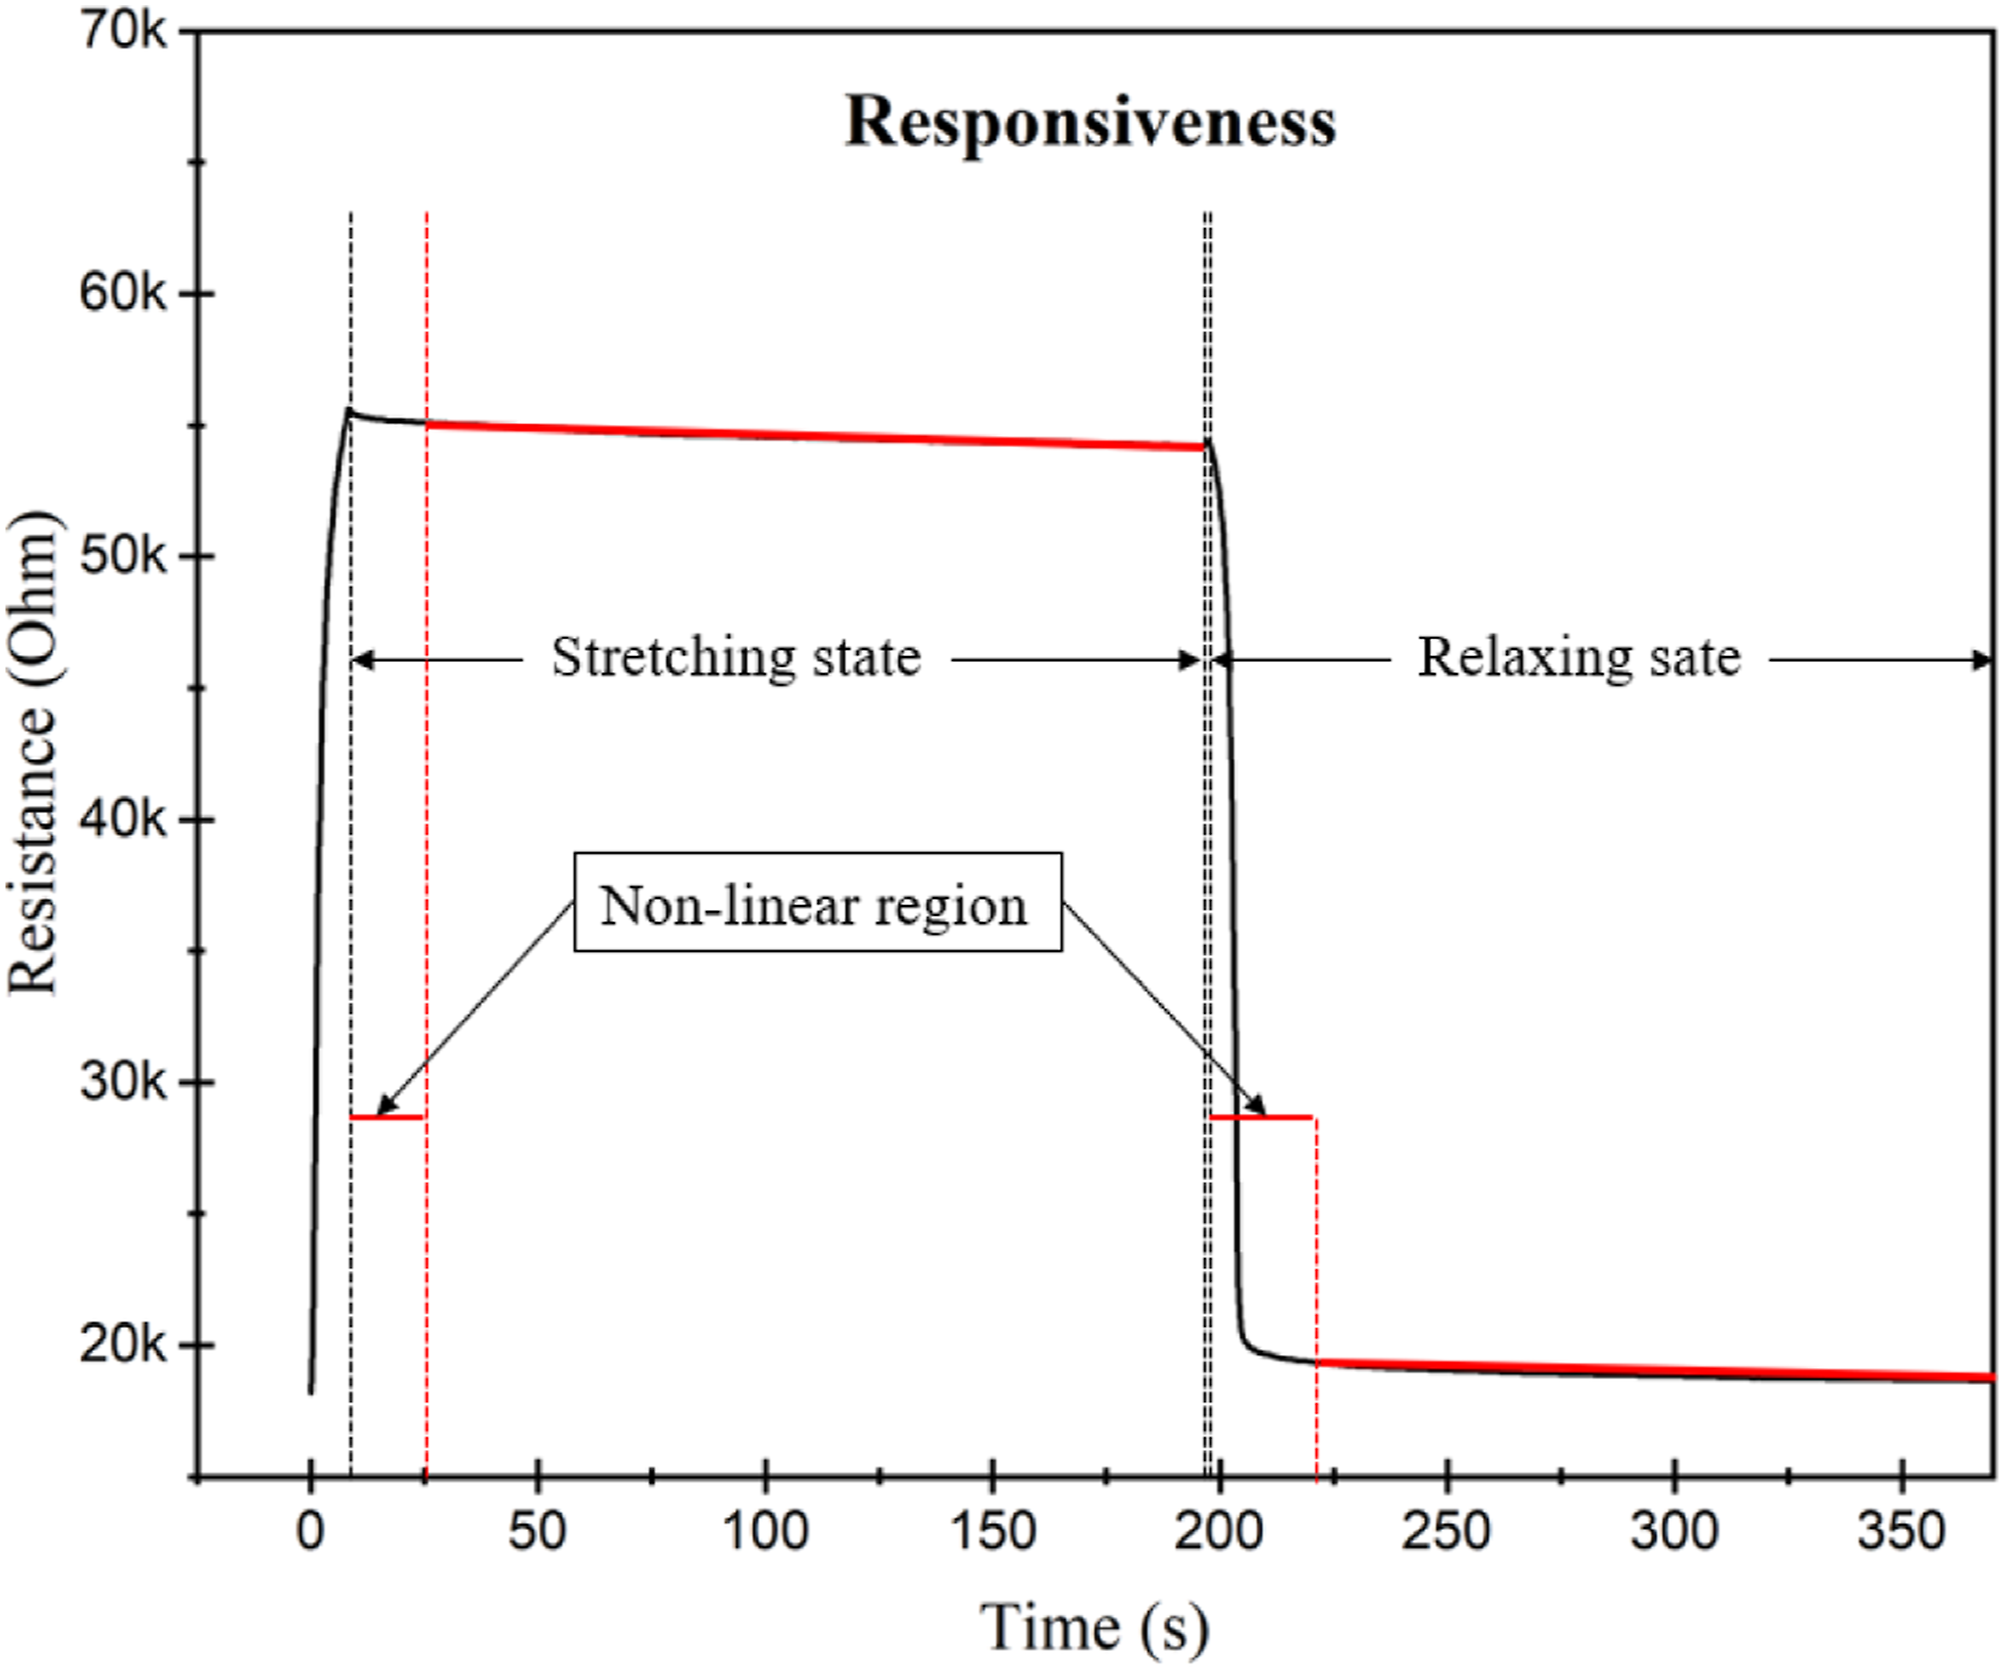
Classification of forearm muscle exercises
Figure 11 illustrates the normalized data of four exercises collected from three channels corresponding to three stretch sensors placed on (1) the group of brachioradialis, flexor carpi radialis, palmaris longus, and flexor carpi ulnaris, (2) the group of biceps brachii, and (3) the group of triceps brachii. The activations of muscles in each group are visualized through the amplitude of the signal acquired by the stretch sensor. Wrist Curl targets the muscles of group (1), thus the amplitude of the signal from channel 1 is the highest among the three channels. Similarly, the amplitude of data acquired at the position of the biceps brachii is the largest since these muscles are activated the most during the Biceps Curl. In the last two exercises, all three groups of muscles get involved, especially group (1) and group (3). However, there is still a difference in the amplitude of these groups between the 2 exercises. As can be seen from the figure, during Seated Barbell Triceps Extension, the activation level of the two groups is similar, while in Dumbbell Kickback, group (3) tends to be activated more than group (1), which is proven by higher amplitude. Data collected from three stretch sensors on the arm sleeve during four forearm muscle exercises after the normalization process.
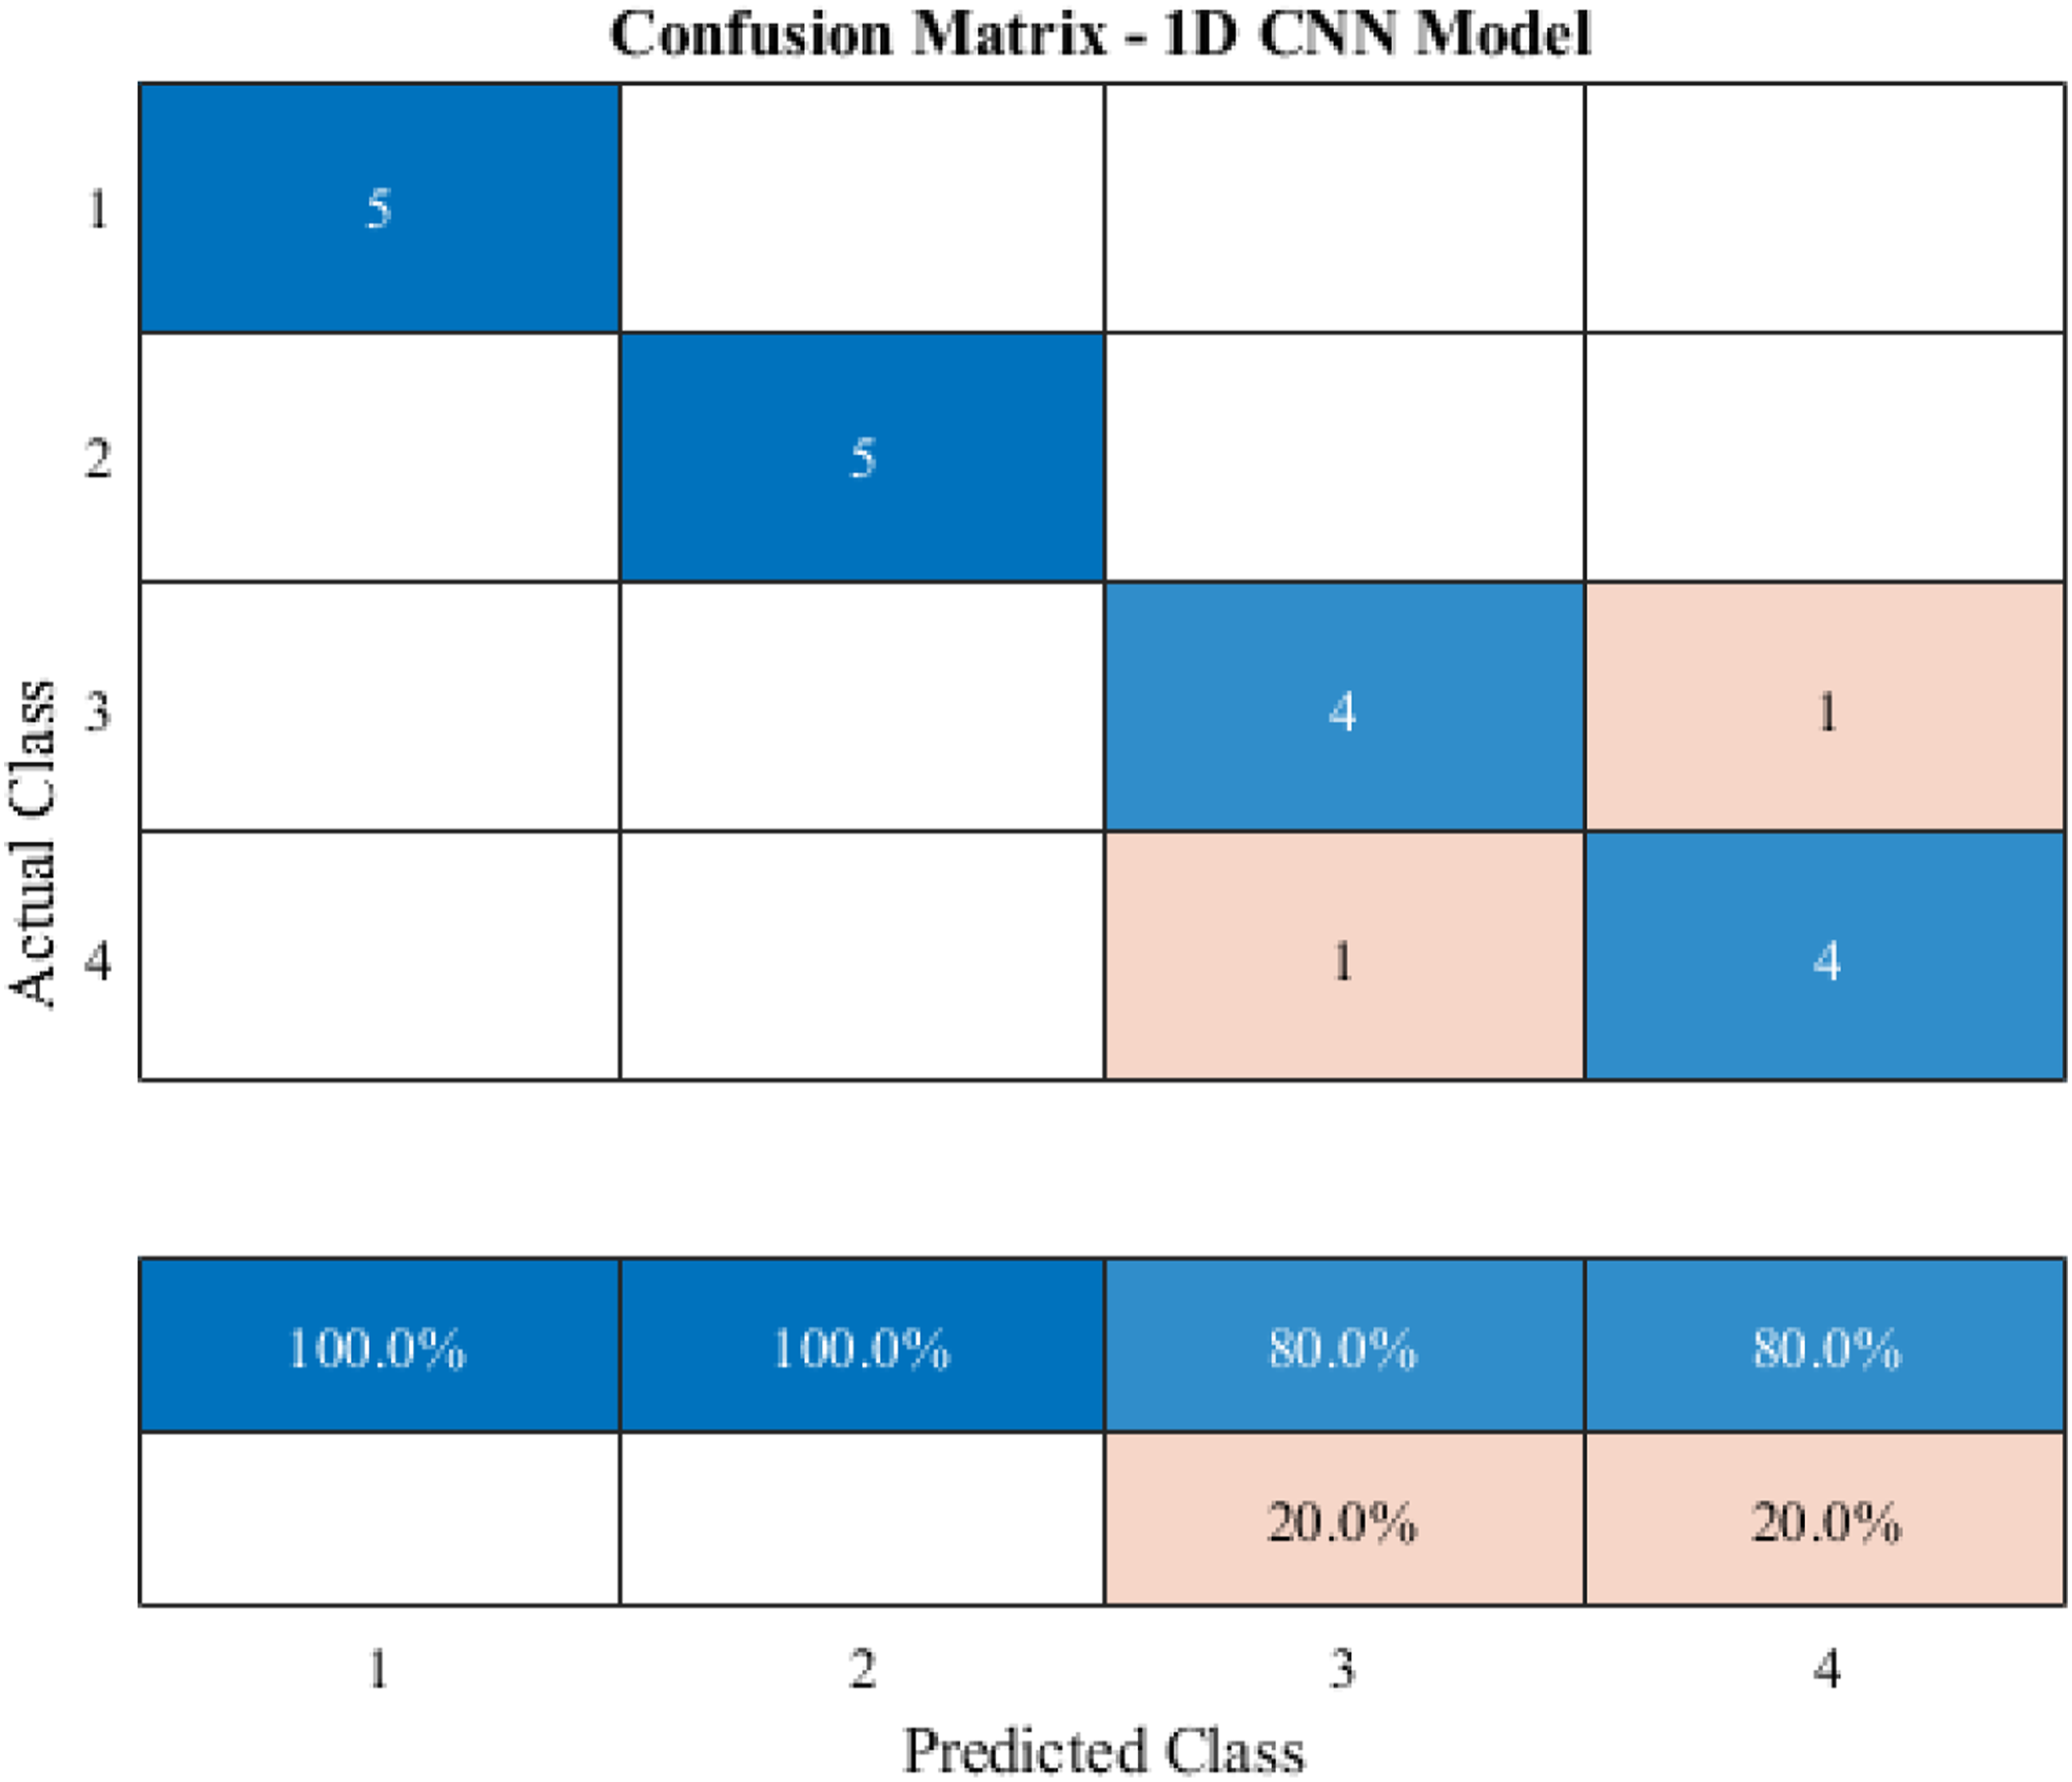
Figure 12 shows the training accuracy and training loss of the 1D-CNN model. Specifically, 97.2% training accuracy and 90% test were achieved after 100 epochs. Figure 13 shows the confusion matrix of the classification model on the test set. In which, the label from 1 to 4 are corresponding to the forearm muscle exercise in the following order: Wrist Curl, Biceps Curl, Seated Barbell Triceps Extension, and Dumbbell Kickback. The correct prediction probability of test data belonging to the first two exercises is 100%, while this figure is 80% for the other two classes, these outcomes are visualized in the Confusion Matrix in Figure 13. Although the training and test sets were not sufficient, these outcomes indicate that a simple 1-D convolutional neural network can efficiently classify the forearm muscle exercises based on the activation of each specific muscle, which can be monitored by the SWCNT-coated stretch sensor. Summarization of the 1D-CNN classifier including Training accuracy and Training loss. The test accuracy of the 1-D CNN classification model.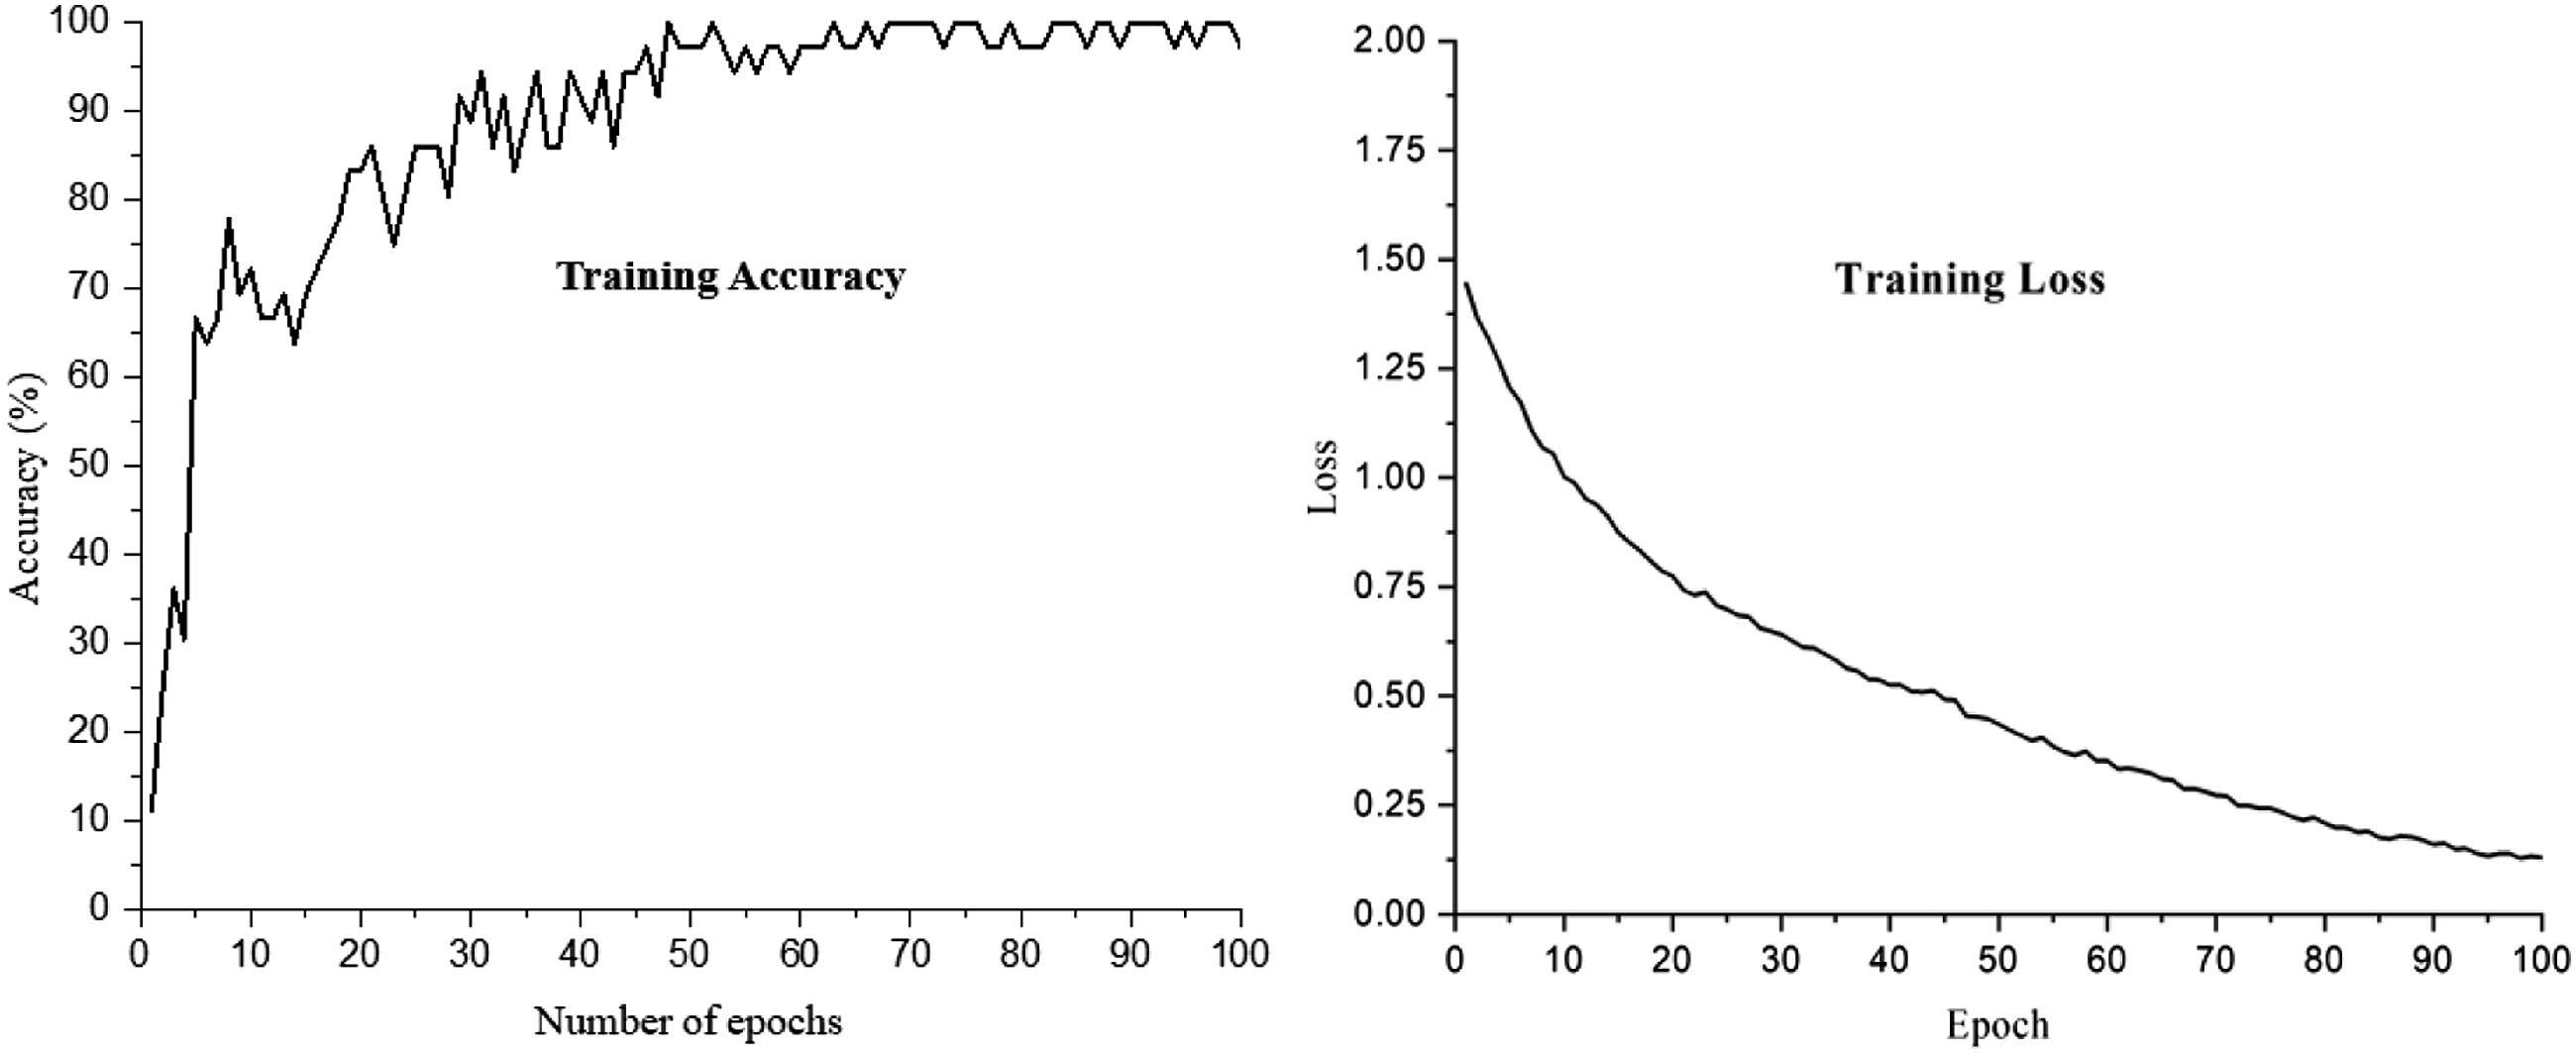
Discussion
This study demonstrated a method to fabricate a resistive stretch sensor by coating polyester spandex fabric with a commercial single-walled carbon nanotube. Hysteresis, Gauge Factor (GF), durability, and responsiveness of the sensor were examined to evaluate its performance. The graph of hysteresis visualizes the differences between stretching and relaxing movements. The smaller this value, the better the sensor. 30 With the maximum hysteresis value of 13% shown in Figure 8, the proposed sensor is proven to have good elasticity and is thus suitable for tracking forearm muscle movement applications. However, the fabricated sensor doesn’t have a large GF, only 6.76, which could be a limitation when the task comes to tracking angular movements with high amplitude. 30 In the range of this study, the utilization of the stretch sensor is tracking forearm muscle activation during resistance training with small amplitude so that the proposed sensor still works effectively. Besides hysteresis and GF, responsiveness is also an informative metric to assess the behavior of the resistive stretch sensor utilized in motion or movement monitoring. During the static test with the result illustrated in Figure 10, the sensor did not have a linear performance immediately when it was held at the position of 50% strain and 10% strain. Though, it only takes approximately 17 s during the stretching state and 23 s during the relaxing state to reach this condition. Considering the function of this stretch sensor, which is detecting muscle activation during resistance training that doesn’t require the sensor to have an instant transition between the stretching state and the relaxing state, the fabricated sensor meets the requirements of the application. This result is clarified in Figure 11, in which, the amplitude or data collected from three channels has a strong correlation with the target groups of muscles during each type of resistant training.
To classify four forearm muscle exercises with the data acquired from the fabricated sensor, the authors design a 1-D convolutional neural network. The input size of this classification model is equal to the number of sensors attached to the arm sleeve, and the output size is the number of exercises which is 4. From the confusion matrix in Figure 13, it can be seen that the designed model can classify effectively two exercises: Wrist Curl and Biceps Curl (class 1 and 2, respectively), while it was confused between Seated Barbell Triceps Extension and Dumbbell Kickback (class 3 and 4, respectively). This result comes from the groups of muscles which are activated in each exercise. Specifically, exercise 1 only targets the group of brachioradialis, flexor carpi radialis, palmaris longus, and flexor carpi ulnaris (1); exercise 2 mainly aims to activate the group of biceps brachii (1), besides, group (1) is used during the workout too; in exercise (3) and (4), all of three groups of muscles were used with the only difference in the level of muscle activation of group (3) - triceps brachii.
In this study, the number of participants was limited, which leads to insufficiency and lack of diversity in the dataset. Other conditions of the participant were omitted, such as health conditions, muscle conditions, and experience with resistant training. Therefore, it is necessary to acquire data on various groups of subjects. Besides, the 1D-CNN model was employed in this research because each set was a time series data for a short time. For monitoring applications in healthcare, where the long-term dependencies among time steps matter, this model may not perform well.
Conclusions
This study presented a simple method to fabricate a textile stretch sensor that can be applied to track forearm muscle activation in the form of an armband. In addition to that, the authors proposed a 1-D Convolutional Neural Network model to classify four forearm muscle exercises with the data collected from the armband. The approach implemented in this study indicated that (1) a textile stretch sensor can be utilized to track human motion due to its flexibility, simple fabrication procedure, and durability; (2) a 1D CNN model performs effectively on the time series classification task even with low computation, low hardware setup, and easy training process. Further studies are necessary to validate this approach on groups of subjects with diverse conditions and to expand the target muscles or exercises for the classification task. In future works, the authors expect to develop a device to monitor the activation of muscles in real time with the utilization of a more effective deep-learning model, and a database that can be served for studies on the correlation between muscle activity and body strength.
Footnotes
Author contributions
As a corresponding author, Jooyong Kim was responsible for the whole structure construction, while Sehan Chun was responsible for sensor fabrication, experiment design, and data acquisition, Ngoc Tram Nguyen was responsible for experiment design, data processing, deep learning model design, and helping with experiments. The manuscript was drafted by Jooyong Kim and Ngoc Tram Nguyen. Finally, all authors read and approved the final manuscript.
Declaration of conflicting interests
The author(s) declared no potential conflicts of interest with respect to the research, authorship, and/or publication of this article.
Funding
The author(s) disclosed receipt of the following financial support for the research, authorship, and/or publication of this article: This research was supported by the Korea Institute for Advancement of Technology (KIAT) grant funded by the Korea Government (MOTIE) (P0012770, The Competency Development Program for Industry Specialist).
Correction (November 2023):
Article updated to correct the funding.