
Abstract
This study proposes the use of a CNN model to predict the resistance of conductive fabrics by utilizing the brightness information from their images, aiming to address the limitations of traditional contact-based measurement methods and explore the feasibility of non-contact resistance measurement. Conductive fabrics were produced using environmentally friendly cellulose fiber as a base material, with a dip-coating and padding process involving water-based single-walled carbon nanotube (SWCNT). After scanning the produced conductive fabrics and meticulously preprocessing the images, a dataset for CNN training was constructed, comprising label values corresponding to the sheet resistance of each image. ANOVA analysis confirmed a statistically significant relationship (p-value = 8.04145e^-18) between the brightness of conductive fabric images and their sheet resistance. By leveraging the relationship between the brightness of fabric images and sheet resistance, training of the CNN model yielded an RMSE of 0.0558 and an R-squared value of 0.9557, validating the effectiveness of the designed CNN model for image-based resistance prediction. This research is expected to contribute to the development of future real-time monitoring and control systems, providing a crucial foundation for the advancement of data-driven measurement and control systems based on computer vision and machine learning techniques. Furthermore, it is anticipated to unveil new possibilities for various applications of conductive fabrics.
Keywords
Introduction
In recent years, conductive textiles have emerged at the forefront of innovation by integrating with conventional fabrics. Possessing the unique ability to independently transmit electricity, these textiles play a crucial role in various fields such as the fiber and fabric industry, 1 electronic device manufacturing, 2 medical devices,3,4 and sports equipment.5,6 Particularly, the fiber and fabric industry is devoted to leveraging the properties of conductive materials to develop smart clothing 7 and medical textiles.8,9 In these application areas, conductive textiles are organically integrated to provide innovative solutions, such as monitoring the wearer’s health or contributing to remote medical services between healthcare professionals and patients. Furthermore, recent efforts have been directed towards producing environmentally friendly conductive textiles, making a substantial contribution to the development of eco-friendly products.10–12
One of the key challenges in the technology of conductive materials is the development of a fiber structure that is both lightweight and flexible while preserving electrical conductivity to enhance the wearing comfort. Traditional fabric materials have predominantly been used as insulating materials, lacking inherent electrical conductivity. Consequently, various technologies are being developed to impart electrical conductivity to conventional fabrics. 13 Techniques for conferring electrical conductivity include the use of conductive inks14,15 and the application of materials such as carbon-based conductive polymers and conductive polymer composites.16–20 Among these, the dip-coating process utilizing water-based single-walled carbon nanotube (SWCNT) has garnered particular attention as an advanced processing technology for effectively imparting conductivity.21–24 The use water-based SWCNT allows for an effective and advanced manufacturing technique, especially in conferring conductivity. SWCNT exhibits excellent conductivity, making it electrically efficient, lightweight, and flexible.25,26 When applied to textile materials, this method ensures that the wearer experiences both comfort and unrestricted movement. Moreover, the dip-coating approach can facilely impart conductivity to fabrics with various weaves, making it versatile and applicable across diverse fields.27,28
The innovative characteristics of conductive materials produced through the dip-coating method offer outstanding performance and enhanced applicability. 29 Consequently, in both research and industrial sectors, there is a strong emphasis on accurately measuring and analyzing the electrical properties of such materials. Precisely analyzing the electrical properties to quantify and optimize material performance is crucial for improving the manufacturing process. Furthermore, this precise understanding of electrical properties serves as a key criterion in various applications of conductive materials. Accurately measuring and analyzing the electrical properties not only enhances the manufacturing process but also plays a pivotal role as a fundamental criterion in the diverse applications of conductive materials.
Most existing papers tend to conduct the electrical conductivity measurements of conductive textiles using a contact-based approach.30–32 However, this method introduces certain constraints due to the physical contact between the measurement equipment and the sample. Contact-based measurements can induce deformation in the form of fibers. 33 Given the flexible and lightweight nature of fibers, they are highly susceptible to the influence of pressure. Therefore, there is a concern that the shape may be distorted due to differences in pressure during measurements. Additionally, because the measurement results can vary depending on the magnitude of pressure, it can negatively impact the accuracy of the results.
To address the distortion issues caused by physical contact in traditional contact-based measurement methods, there is a need for a non-contact conductivity measurement method employing telematics technology. Telematics is a technology that enables remote data collection and transmission without physical contact, particularly minimizing shape deformation in sensitive materials such as fibers and allowing for precise data acquisition.34–36 The non-destructive nature of telematics technology enables effective remote measurement of electrical conductivity without physical contact, minimizing shape deformation in fiber materials while obtaining accurate data. This characteristic plays a crucial role in accurately evaluating the properties of conductive materials and preventing distortion due to shape deformation.
When AI technologies are applied to telematics, they can analyze and interpret data using various advanced techniques. 37 For example, Recurrent Neural Network (RNN) and Long Short-Term Memory (LSTM) network are effective in processing sequential data and modeling time series data.38–41 They can be used to build prediction models considering dynamic changes in data such as stock price forecasting42,43 or weather prediction.44,45 Generative Adversarial Network (GAN) are used to generate data such as images, voices, and texts similar to real ones, mainly employed in data augmentation and medical image generation.46–48 Particularly, Convolutional Neural Network (CNN) exhibit outstanding performance in image processing tasks. CNN automatically extracts features from images and can recognize patterns based on them, offering the advantage of efficiently processing large datasets through parallel processing.49–53 Currently, research on classifying defects in fabrics using the characteristics of CNN is actively underway.54–58 CNN shows excellent performance in the field of image processing and is highly effective in detecting and classifying defects in fabrics. Thanks to these characteristics, CNN is also very suitable for evaluating the electrical performance of conductive fabrics. By applying CNN to non-contact conductivity measurement methods utilizing telematics technology, the features of conductive fabrics can be effectively extracted to evaluate electrical performance, thus enabling fast and accurate results. Therefore, the application of AI technology in the textile industry brings about new innovations, enhances productivity, and effectively addresses various challenges such as data analysis and interpretation. 59
This study aims to fabricate conductive textiles using a dip-coating process with water-based SWCNT on a fabric composed of eco-friendly materials, specifically bamboo and cotton. In order to apply telematics technology, we propose a novel and innovative method for analyzing the electrical characteristics of conductive textiles using image processing and an AI convolutional neural network (CNN) model. Unlike traditional contact-based methods, the image-based conductivity measurement method utilizing an AI CNN model minimizes experimental variability, automates data collection and monitoring processes, thereby enhancing efficiency. This is expected to contribute to the accurate evaluation of electrical properties and optimization of the manufacturing process by enabling effective data collection and real-time monitoring in industrial and research fields. Furthermore, the use of eco-friendly materials, a blend of bamboo and cotton, emphasizes sustainability and environmental friendliness. The improvement in textile conductivity through 0.1 wt% water-based SWCNT dip-coating presents innovative possibilities for advancement in the modern textile industry. This research is anticipated not only to contribute to increased productivity and enhanced product quality in the industry but also to promote the active utilization of eco-friendly materials and advancements in deep learning technology.
Materials and methods
Conductive textile
In this study, a Bamboo double-sided fabric (BY001, Organic Korea Co., Ltd) composed of 60% bamboo and 40% cotton was utilized for the fabrication of conductive textiles. As depicted in Figure 1, cellulose, the main component of this fabric, is a polymer found in nature, consisting of various formats. Cellulose is recognized as a renewable resource with environmental sustainability. Utilizing sustainable materials aids in minimizing the environmental footprint in the production process of conductive fabrics. Additionally, cellulose fibers exhibit high modulus, providing excellent flexibility and elasticity, making them highly suitable for wearable devices such as garments. The flexibility and elasticity of cellulose fibers enhance the comfort of wearable devices, thereby improving user comfort. Moreover, the strong intermolecular bonds of cellulose polymers enhance the durability and mechanical strength of fibers, playing a crucial role in increasing the durability of conductive fabrics. This polymer contains abundant functional groups of oxygen and hydrogen, facilitating hydrogen bonding with water molecules (Figure 1). The molecular structure of cellulose induces high interaction with moisture, imparting excellent absorbency and high hydrophilic characteristics to cellulose fibers. This facilitates efficient absorption of conductive material solutions such as SWCNT or other treatment liquids, promoting proper dispersion of conductive materials. These characteristics of cellulose make it a suitable material for the production of conductive fabrics in environmental, functional, and economic aspects. Leveraging the hydrophilic properties of cellulose, this study successfully produced conductive textiles through the interaction of cellulose fibers with a 0.1 wt% water-based SWCNT. The molecular structure of cellulose.
Due to the excellent mechanical strength and elasticity of cellulose fibers, they can be utilized as textile sensors through coating and padding processes. Dip-coated conductive fabrics are soft, flexible, and possess excellent stretchability, making them easily adaptable to various fields and facilitating their integration as sensors.60–63 Recently, research efforts have been actively underway to enhance the sensitivity and accuracy of piezoelectric sensors through the introduction of functional nanoparticles. 64 Such integration of sensors provides valuable insights for the development of applications such as wearable health monitoring programs.
Figure 2 demonstrates the production process of the conductive fabric. The single-walled carbon nanotube (SWCNT) ink was stirred at a speed of 1000 rpm using an ultrasonic machine for a minimum of 1 hour to prevent the integration of air bubbles and ensure a uniform distribution on the fabric surface. The cellulose fabric was immersed in a 0.1 wt% water-based SWCNT for 1 min, and a dipping padding machine (DAELIM Lab., Seoul, South Korea) was employed to effectively absorb conductive particles into the fabric. Subsequently, excess moisture from the fabric was removed using a two-way drying machine (DAELIM Lab., Seoul, South Korea) at a temperature range between 80°C and 100°C for 5 min, with a circulation fan speed of 1500 rpm. Finally, the fabric was cultured at room temperature for 1 hour. The fabrication process of conductive textiles.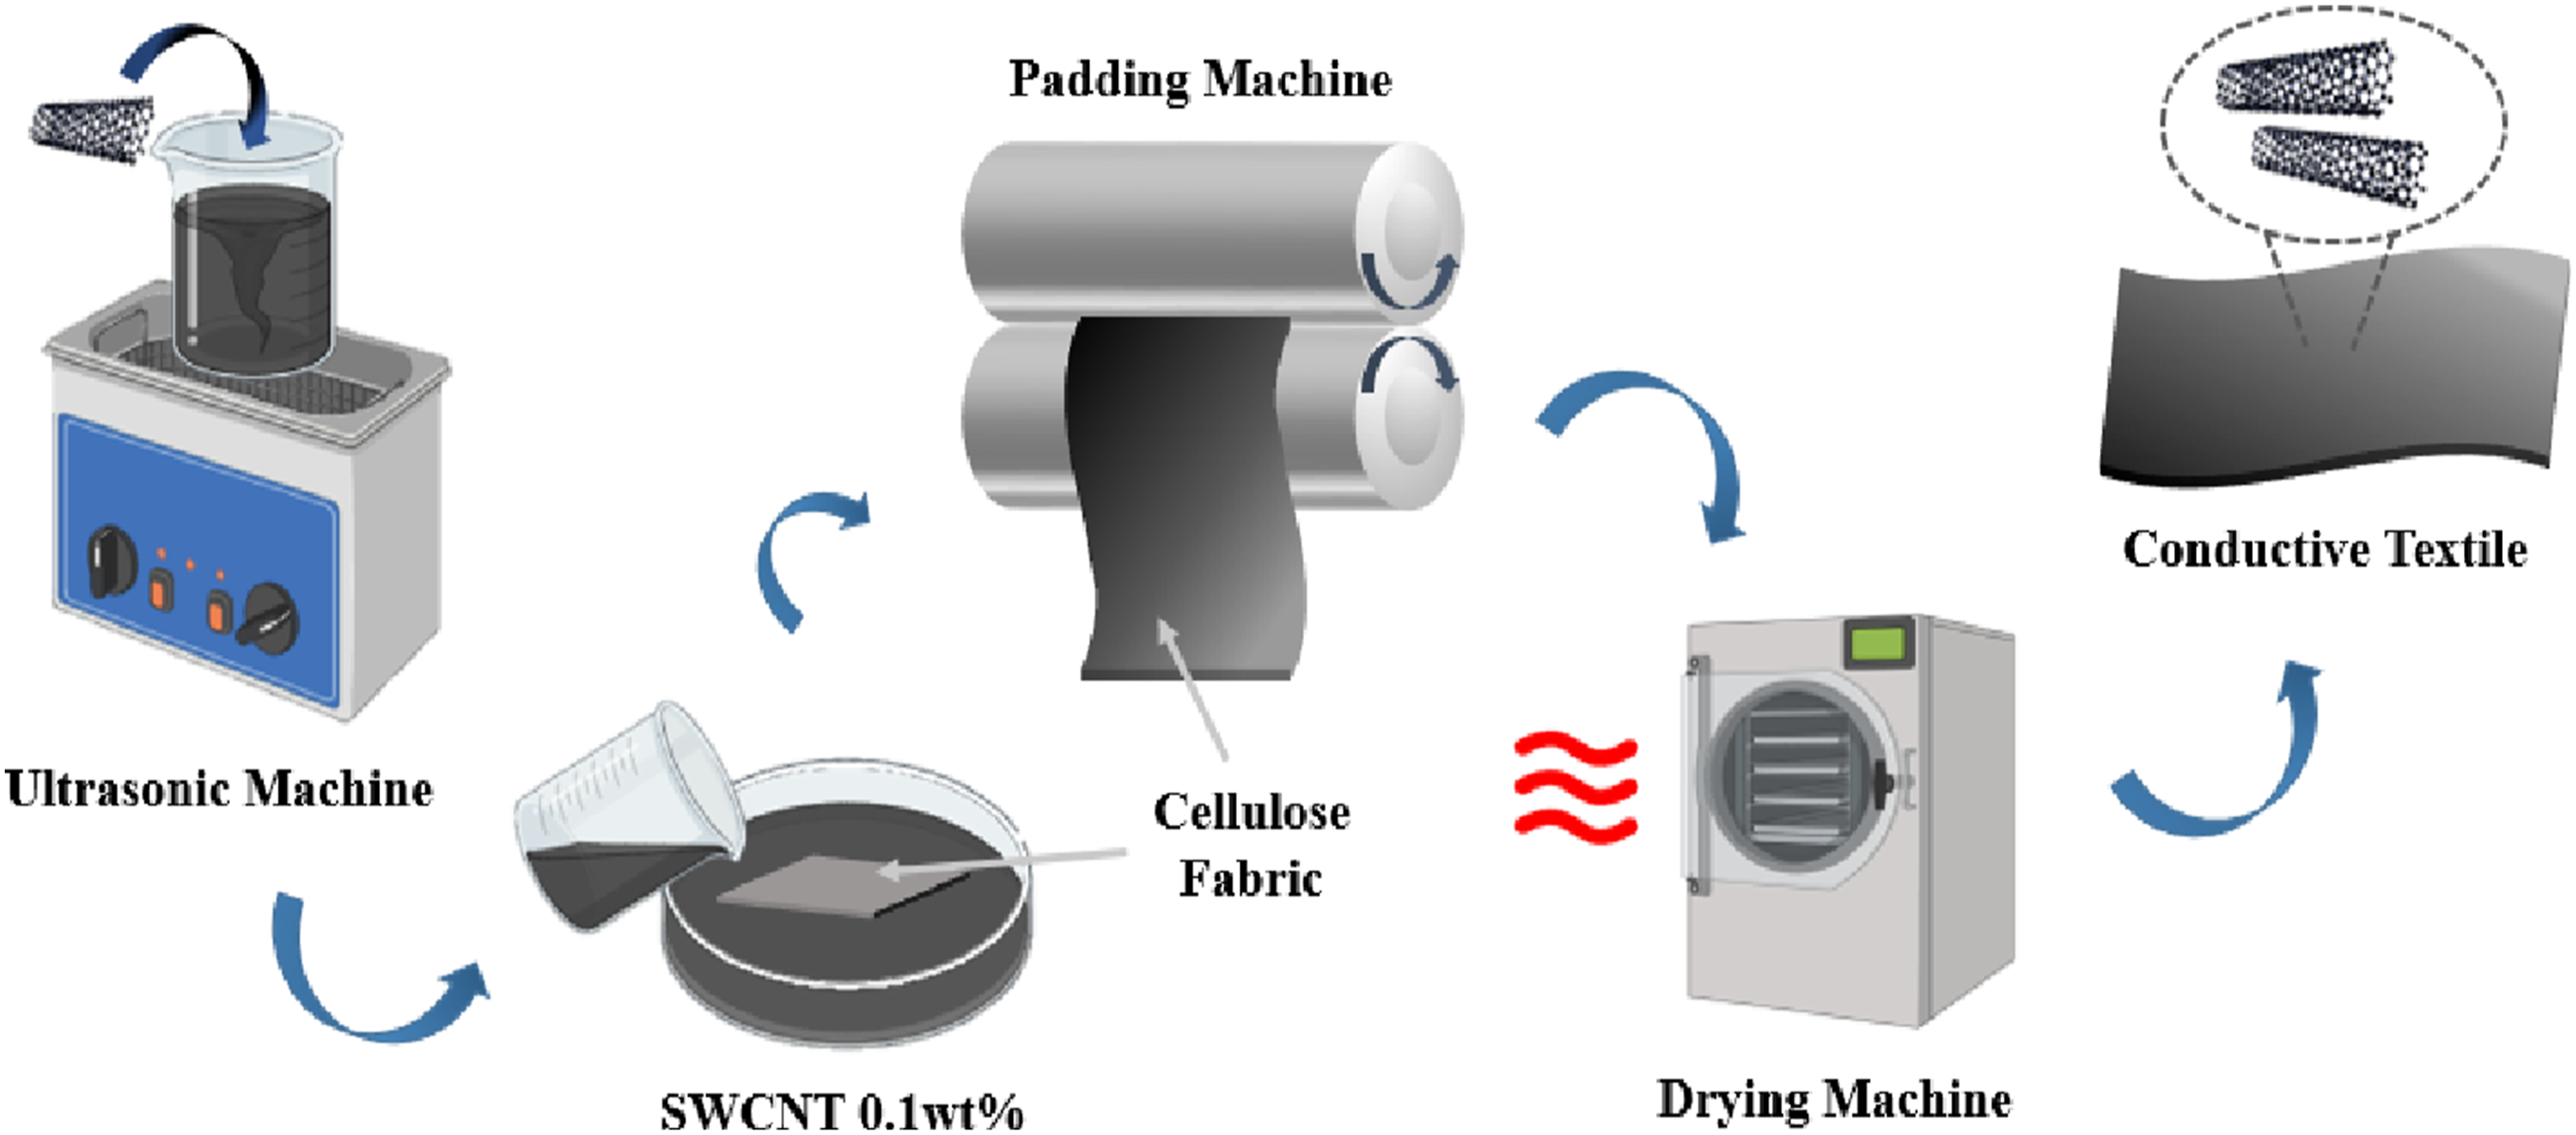
Dataset
When evaluating and analyzing the electrical characteristics of conductive fabrics using CNN, accurate data collection is crucial. The dataset utilized in this study was generated by scanning photographs captured directly by the researchers and storing them in digital format, along with resistance measurements. Figure 3 demonstrates the method of collecting images of conductive fabrics for CNN evaluation. Methods for collecting images of conductive fabrics for CNN evaluation.
In the initial stage, we used a laser cutting machine to cut the Mother Fabric (Bamboo doubled-sided fabric) into 10 cm*10 cm squares and produced a total of 10 Daughter Fabric 1. Subsequently, by applying dip-coating with different cycles, we produced conductive fabrics with various electrical characteristics (Daughter Fabric 2). To extract features of conductive fabrics based on their electrical properties using CNN, the manufactured conductive fabrics need to be converted into digital images, typically acquired through scanning or photography. The collected dataset should adequately reflect the electrical properties of the conductive fabrics. To prevent distortion due to changes in lighting and zoom levels of the camera lens, we thoroughly collected data using a scanning machine (Laser Jet Pro MFP M428fdw (HP Development Company, L.P, California, USA)). The contrast value was set to 100 to emphasize the brightness of conductive fabric images, and to minimize loss of original photos, images were saved in PNG format (Daughter Fabric 3). During this process, we adjusted the resolution of the Daughter Fabric 3 image obtained by scanning Daughter Fabric 2 to 1440*1440 pixels. To effectively perform CNN training, we conducted grayscale preprocessing on the Daughter Fabric 3 fabric image (Daughter Fabric 4). In this step, we converted the image to grayscale to remove unnecessary color information, reducing the complexity of the data and increasing computational efficiency. This preprocessing step helped the CNN model learn and generalize the main features of the data more accurately. Finally, to increase the amount of data, we cut the Daughter Fabric to obtain Granddaughter Fabric. The direct cutting of Daughter Fabric using a laser cutting machine may cause damage and distortion to the conductive fabrics. To address these issues, we processed Daughter Fabric images on the computer using MATLAB. After scanning and preprocessing, we divided the Daughter Fabric 4 images into 25 segments of the same size with pixel values of 288*288, resulting in a total of 250 Granddaughter Fabric images. After minimizing damage and distortion to the fabric caused by laser cutting, we ultimately obtained Granddaughter Fabric images. The histograms and brightness of the obtained image data will be utilized as the most important information for analyzing the electrical characteristics of conductive fabrics through CNN.
Classification of fabrics based on image processing methods.

Convolutional neural network model
In recent years, Convolutional Neural Network (CNN) have garnered significant attention in the research community, particularly in the fields of object recognition, tracking, and image processing, owing to their high performance. The architecture of CNN differs from traditional machine learning algorithms by automatically learning high-level descriptive features rather than relying on manually crafted features. A typical CNN is composed of several components, including convolutional, pooling, and fully connected layers. This distinctive approach has set CNN apart, showcasing their effectiveness in learning complex hierarchical representations from data. We utilized MATLAB, a widely used commercial numerical analysis and programming environment in the engineering and scientific fields, to build the CNN model.
The CNN model proposed in this paper is designed for the regression task of images of conductive fabrics. In this study, we constructed a custom neural network architecture using the Neural Network Toolbox in MATLAB to quantitatively evaluate the electrical performance of conductive fabrics. The Neural Network Toolbox is an extension package in MATLAB that supports the construction, training, and evaluation of neural network models, enabling the development of various neural network-based applications. The entire dataset was split randomly, with 75% used for training and the remaining 25% for testing, aiming to conduct effective model learning and performance evaluation. The architecture consists of components such as convolution layers, batch normalization, Rectified Linear Unit (ReLU) activation, average pooling, dropout, and fully connected layers for regression (Figure 4). The input layer is set to the image size [288 288 1], which receives grayscale images consisting of 288 pixels in width and height each (1 indicates grayscale images). The first convolution layer employs 10 filters of size 8 × 8, using ‘same’ padding to match input and output dimensions. The ‘same’ padding helps maintain the size of the output image after convolution operation to be the same as the input image by adding virtual pixels to the edges of the input image. This ensures that all parts of the input image pass through the convolutional layers without information loss, allowing for the extraction of features. Batch normalization is applied to the output of the convolution layer, followed by ReLU activation. This process enhances the stability and learning speed of the network, accelerates the convergence rate of the model, and enables more accurate and efficient learning. Subsequently, a 20 × 20 average pooling layer is applied to downsample the input. This process reduces the spatial resolution of the input image and shrinks the size of feature maps. It reduces computational complexity and decreases the complexity of the model while preserving spatial information, thereby enhancing the generalization performance of the network. The second convolution layer utilizes 10 filters of size 16 × 16, also with ‘same’ padding and batch normalization. After passing through ReLU activation, another 20 × 20 average pooling layer downsamples the input. A key feature of the model is the dropout layer, randomly deactivating 20% of neurons during training to mitigate overfitting. The dropout layer enhances the generalization ability of the network and improves the generalization performance of the model on new data. This prevents the model from overfitting to the training data and allows it to learn more robust and general patterns. Finally, a fully connected layer is designed for the regression task, and the regression loss layer employs mean squared error (RMSE) to calculate the loss. CNN architecture.
This custom neural network is focused on extracting characteristics of conductive fabrics from given image data and predicting precise electrical performance through regression. The architecture performs optimized learning for accurate and effective predictions of conductive fabric properties. The Figure 5 illustrates the overall process flow of the present study. Process diagram.
Results
Characterization of conductive textile
Through scanning electron microscopy (SEM) images, the internal structure of the conductive fabric was precisely observed (Figure 6). A comparative analysis of SEM images before and after the dip-coating process with water-based SWCNT revealed that, following dip-coating treatment, the fabric’s interior unmistakably contained SWCNT conductive particles. Furthermore, comparing images of the conductive fabric after the 2nd dip-coating process (Figure 6(b)) with those after the 10th dip-coating process (Figure 6(c)), it was observed that as the number of dip-coating processes increased, the distribution and density of SWCNT conductive particles also increased. Consequently, in the measured sheet resistance of the conductive fabric, an increase in the number of dip-coating processes corresponded to a higher density of conductive particles, resulting in enhanced conductivity (Table 2). Table 2 shows the resistance values of Daughter Fabric with different cycles of dip-coating processes. Additionally, an observation was made that with an increase in the dip-coating process, the overall color of the fabric appeared darker. Considering the results of SEM image analysis, it can be visually confirmed that in regions with abundant application of dip-coating, the quantity of SWCNT particles relatively increased, leading to a darker color. This visually demonstrates the interrelation between electrical characteristics and visual quality. In summary, considering all aspects, the dip-coating process proves to be a valuable technique for enhancing the electrical properties of conductive fabric. It was confirmed that the electrical and visual characteristics of conductive fabric produced through the dip-coating process are interrelated. SEM images of fabricated conductive fabric. (a) No dip-coating, (b) dip-coating 2 cycles, and (c) dip-coating 10 cycles. Variation in resistance with the number of dip-coating cycles (Resistance of the Daughter Fabric).

Dataset
ANOVA analysis
To experimentally demonstrate the variation in sheet resistance of the conductive fabric with respect to the previously mentioned dip-coating process cycles, ANOVA analysis was conducted. The F-statistic obtained from the ANOVA analysis serves as an indicator comparing the variance between groups and within groups. A large F-statistic signifies a substantial difference between groups. The p-value determines whether the observed F-value is likely to occur by chance, with a smaller p-value indicating that the observed F-statistic is not likely to be by chance. ANOVA analysis between the dip-coating process cycles and the sheet resistance of the conductive fabric using MATLAB yielded an F-statistic of 545.92, with a very low p-value of 9.93356e^-139. This is interpreted as strong evidence of a statistically significant relationship between the process cycles and sheet resistance. Figure 7 visually represents the results of ANOVA analysis, depicting the differences in means and medians between groups. According to the ANOVA analysis, it was observed that an increase in the cycle of the dip-coating process led to an increase in the quantity of conductive particles within the fabric, thereby forming more pathways for electrical current, resulting in a decrease in sheet resistance. Furthermore, it can be observed that as the dip-coating process is carried out for a certain number of times, the conductive particles within the fabric reach saturation, resulting in the fabric’s resistance converging to a stable value. The low sheet resistance of the conductive fabric enables faster transmission and processing of electrical signals, thereby enhancing the overall power efficiency of the system. Through ANOVA analysis and the graph, we have demonstrated a meaningful relationship between the dip-coating process cycles and the sheet resistance of the conductive fabric. However, as shown in Figure 7, during the first coating process (1st dip-coating), the deposition of conductive particles was highly uneven, making it challenging to achieve consistent sheet resistance. When performing the 1st dip-coating, the uneven distribution of conductive particles results in significant resistance variations across different regions of the fabric. Such non-uniform distribution undermines the overall stability of the system, rendering it unsuitable for applications such as sensors. Therefore, exclusion of samples subjected to only the initial dip-coating process is warranted in order to ensure reliability and applicability in research contexts. For these reasons, the results obtained from the 1st dip-coating were excluded from the dataset. ANOVA Analysis results of dip-coating cycles and sheet resistance.
Similarly, to experimentally demonstrate the visual quality difference of conductive fabrics based on the sheet resistance, an analysis of variance (ANOVA) was conducted between the sheet resistance and the brightness of conductive fabric images. The ANOVA analysis revealed a p-value of 8.04145e^-18. Furthermore, the graph (Figure 8) depicting the relationship between sheet resistance and the brightness of conductive fabric images illustrated that as the resistance decreased, the brightness approached zero, becoming darker. This confirmed a significant relationship between resistance and brightness. Building on this relationship, our study aims to analyze images of conductive fabrics using Convolutional Neural Network (CNN) and predict resistance based on the corresponding brightness information. ANOVA Analysis results of sheet resistance and brightness.
Image preprocessing
To ensure the efficient execution of CNN training, preprocessing was applied to the scanned Daughter Fabric images. Figure 9 visually compares the images before and after grayscale preprocessing. By converting the initial images to grayscale, noise was reduced, enhancing computational efficiency. In practice, while the contrast may appear vivid in the original images before preprocessing, the computer’s processing benefits from the simplicity of black-and-white images. This simplicity enhances the clarity of crucial information during the computational steps, aiding in more effective data representation for machine learning models, particularly Convolutional Neural Network (CNN). Figure 10 represents the histogram of the grayscale preprocessed image data, illustrating the frequency of each pixel value. Subsequently, using MATLAB, the Daughter Fabric was uniformly divided into 25 images of size 288*288 pixels, resulting in the acquisition of Grand Daughter Fabric images. Figure 11 depicts the final Grand Daughter Fabric images used for CNN training. The Granddaughter Fabric images obtained in the end provide essential detailed information necessary for accurately analyzing the electrical characteristics of conductive fabrics. Comparison of images before and after grayscale preprocessing of scanned images. (Comparison between daughter fabric 3 and daughter fabric 4). Histogram of grayscale preprocessed images. Characteristics of the durability.


Label
Label values (Resistance of the Granddaughter Fabric).

Convolutional neural network
In this study, based on the final dataset, we developed a regression CNN to analyze images of conductive materials and predict resistance. Using the Neural Network Toolbox in MATLAB, we defined a custom neural network architecture. The version of MATLAB software used in this study was R2023a. The computer system specifications included a RAM capacity of 16.0 GB and an Intel(R) Core(TM) i3-10100F CPU @ 3.60 GHz (3.60 GHz) processor. This model takes Grand Daughter Fabric images as input, learns the inherent patterns and features, and is configured to predict resistance values. Seventy-five percent of the dataset was utilized for training, while the remaining 25% was split for testing the model’s learning and performance evaluation. We conducted CNN training with a mini-batch size of 32, 500 epochs, and an initial learning rate of 0.001. Figure 12 visualizes the results of the trained CNN model using the test dataset. To assess the predictive performance of the trained CNN model, Root Mean Squared Error (RMSE) and R-Squared were calculated using the test dataset. Figure 13 represents the results of regression analysis for the sheet resistance values of conductive fabric. The horizontal axis represents the Predicted Value, while the vertical axis represents the True Value. This study recorded a low RMSE value of 0.0521, indicating that the model’s predictions are very close to the actual values. These results suggest that the model effectively generalizes to new data, making accurate predictions. Additionally, an R-squared value close to 1 signifies that the model explains a high degree of variability in the dependent variable. The obtained R-squared value of 0.9557 in this study implies that the model significantly explains the variability in the dependent variable. This statistically significant result confirms that the model successfully explains the variance in the overall dataset. Process of CNN training. (a) Training RMSE and (b) training loss. CNN test results - comparison between actual and predicted values.

Conclusions
In this study, we developed a CNN model to measure sheet resistance through image information of conductive fabrics, thereby proposing the potential of applying telematics technology to non-destructively analyze the electrical characteristics of conductive fabrics. A conductive fabric was produced by dip-coating a cellulose fabric composed of a mixture of bamboo and cotton with a 0.1% water-based SWCNT (Single-Walled Carbon Nanotube). Confirmation of the presence of SWCNT conductive particles within the fabric was achieved through SEM (Scanning Electron Microscopy) imaging after the dip-coating process. Subsequently, the produced conductive fabric was scanned to obtain digital image data (Daughter Fabric) with pixel values of 1440*1440, and grayscale preprocessing was performed to reduce the complexity of the data and increase computational efficiency. For an increase in data quantity, each 10 Daughter Fabrics were divided into 25 segments to achieve pixel values of 288*288, resulting in a total of 250 Granddaughter Fabrics. (For accurate experimental data, the actual number of data used is 225, excluding the Granddaughter fabric coated once during the dip-coating process.) To demonstrate the correlation between dip-coating frequency and electrical characteristics, as well as the correlation between visual quality and electrical characteristics, ANOVA analyses were conducted for each. Experimental results revealed that an increase in the dip-coating process enhanced electrical characteristics, and as the electrical characteristics improved, there was a tendency for the contrast to intensify. In contrast to traditional contact-based evaluation methods for conductive fabrics, this study suggests a non-contact method using CNN for convenient measurement. We constructed a custom neural network architecture by utilizing MATLAB’s Neural Network Toolbox. The CNN training, with miniBatchSize set to 32, Epoch to 500, and initial learning rate at 0.001, resulted in an RMSE value of 0.0558 and an R-squared value of 0.9557. These evaluation metrics indicate the effectiveness of the model in accurately predicting resistance values based on visual features. The results of this study provide an innovative approach to evaluating the electrical properties of conductive fabrics, laying a crucial foundation for future research and technological advancements. Such research can contribute to the development of real-time monitoring and control systems in the future. Utilizing computer vision and machine learning techniques for data-driven measurement and control systems can be applied to automate and optimize manufacturing processes, thereby enhancing efficiency and performance in industrial environments. Furthermore, this research is expected to present new possibilities in various applications utilizing conductive fabrics.
Footnotes
Declaration of conflicting interests
The author(s) declared no potential conflicts of interest with respect to the research, authorship, and/or publication of this article.
Funding
The author(s) disclosed receipt of the following financial support for the research, authorship, and/or publication of this article: This research was partly supported by the Technology Innovation Program (or Industrial Strategic Technology Development Program-Materials/Parts Package Type) (20016038, Development of the textile-IT converged digital sensor modules for smart wear to monitor bio and activity signals in exercise, and KS standard) funded by the Ministry of Trade, Industry and Energy (MOTIE, Republic of Korea) and the Korea Institute for Advancement of Technology (KIAT) grant funded by the Korea Government (MOTIE) (P0012770, The Competency Development Program for Industry Specialist).