
Abstract
Near-Infrared (NIR) spectroscopic analyses can be applied in waste textile recycling as a rapid and non-invasive method to provide both qualitative and quantitative results. However, it has been a challenge to enhance the accuracy rate of NIR-based waste textile sorting due to the major influences from water contexts in the samples. Orthogonalization of External Parameters (EPO) has been introduced to reduce the interference from water absorption in NIR spectral signals for better accuracy and reliability in modeling. Here we explore the feasibility of applying EPO strategy with varieties of algorithms, including partial least squares regression (PLS), artificial neural network (ANN), decision tree (DT), random forest (RF), gradient boosting decision tree (GBDT), extreme random tree (Extra-tree), decision tree model based on AdaBoost algorithm (AdaBoost-tree), support Vector machine (SVM), one-dimensional convolutional neural network (1D-CNN), and one-dimensional convolutional neural network with improved Inception structure (1D-Inception-CNN). 216 waste textiles samples from Xinjiang, China, were studied with different moisture levels. Among them, 80 samples were used to develop the EPO algorithm, 112 were used to establish the prediction models, and 24 were used as test datasets. Then, the samples were scanned using a near-infrared spectrometer at different moisture regain rates. Our results showed that the moisture content of waste textiles had strong absorption peaks near 1150 and 1450 nm, leading to a decrease in the near-infrared reflectance of waste textiles. To verify the effectiveness of the EPO algorithm, the decision coefficients (R2 score) and other indicators of the model without the EPO process and the model with EPO process are systematically compared. Our results show that the EPO algorithm preprocessing improves the accuracy of the NIR model (The average decision coefficient (R2 score) of the models was increased by 0.83), especially when the moisture interference level is significant. Therefore, the EPO integrated modeling method is a reliable approach for better accuracy in NIR-based waste textile sorting.
Keywords
Introduction
Solid waste recycling has become one of the major constraints to sustainable development due to resource scarcity worldwide. 1 Since the 1980s, global textile fiber production’s average annual growth rate has been about 3%, totaling 107 million tons in 2018. Polyester and cotton are the most produced fibers, with projected production of 55 million tons and 26 million tons, respectively. Apparel accounts for 60% of global textile consumption, with a recent estimate of annual fiber production of post-consumer clothing at 53 million tons, of which only 12% is recycled, and 73% ends up in landfills or waste incinerators. 2 In 2019, the world’s demand for fiber exceeded 100 million tons, expected to increase to 121 million tons by 2025. The solid waste generated by the textile and garment industry accumulates yearly, hindering the development of the textile and garment industry and harming the ecological resources and environment. 3
Due to the advantages of near-infrared spectroscopy, which avoids sample preparation, allows non-destructive, and provides rapid analyses in real-time, recent studies show that near-infrared spectroscopy (NIRS) has great potential for waste textile analysis. 4 but the impact of external factors, such as moisture regain, can significantly influence the accuracy of quantification models.
Kirsti Cura et al. summarized the challenges faced by using near-infrared spectroscopy for sorting waste textiles, as follows: 4 (1). Effects of Coatings and Finishes. (2). Effect of Blends/Elastane. (3). Effects of Structures. (4). Effects of Ageing on Cotton Fabrics. (5). Effects of Mercerisation on Cotton Fabrics. (6). Effect of Colours. However, they did not discuss the impact of moisture regain on analyzing waste textiles using near-infrared spectroscopy. Waste textiles usually contain water (also known as the moisture regains of waste textiles), which has strong absorption bands in the NIR region that may interfere with the spectral signature of other components. 5 The hydration water has two strong OH absorption characteristics near 1400 and 1900 nm in the NIR region. When there is hygroscopic or adsorbed water on the surface area of a substance, it typically has an absorption band of about 2200 nm. Free water has strong absorption characteristics near 1400 and 1900 nm, and weak absorption peaks near 980 and 1200 nm. It can also affect measurement results by reducing the reflectivity of the material. 6 Therefore, we believe that the near-infrared spectral data of waste textiles are not only affected by their composition, but also by their moisture regain.
The research on the influence of moisture on the determination of soil composition using near-infrared spectroscopy has been relatively mature. Budiman Minasny et al. used the external parameter Orthogonalization (EPO) algorithm to remove the impact of soil moisture in the NIR spectrum to calibrate the SOC content. 7 Their work has proven that the EPO algorithm can effectively remove changes in soil moisture. In addition, Real-time soil moisture content (SMC) monitoring is an important parameter in precision agriculture that can be utilized to enhance soil and water management. Visible and near-infrared (vis-NIR) has been proposed as a promising method for SMC monitoring. However, vis-NIR reflectance response to soil moisture is strongly influenced by soil properties such as texture and organic matter content. Thus it is difficult to develop a general prediction model of vis-NIR that can estimate SMC of different soil types. The results of Jiang Liu et al. indicate that the EPO algorithm can achieve a generalized SMC prediction model. 8 The EPO algorithm can also remove the influence of temperature on near-infrared spectroscopy. Ren Sheng et al. used mixed temperature correction method and external parameter orthogonal method (EPO) to reduce the impact of temperature changes on the NIR spectra of soluble solids and Lycopene in Cherry tomato. Their experimental results show that the EPO method has better prediction results than the mixed temperature correction model. 9
In this study, we investigate the impact of moisture regain on the NIRS of polyester/viscose blended waste textiles and evaluate the effectiveness of the EPO algorithm in correcting moisture-induced variations in the NIRS. We collected fabric samples of polyester/viscose blended waste textiles from Xinjiang Ruyi Textile and Clothing Co., Ltd. 10 The experiment was designed and implemented to humidify waste textiles artificially blended with polyester/viscose fibers. A total of 7 moisture levels were obtained Near-infrared spectral data of waste textiles blended with polyester/viscose fibers. The characteristics of the impact of moisture regain on the Near-infrared spectral absorption of waste textiles blended with polyester/viscose fibers were analyzed, and the effects of the EPO algorithm for removing moisture on waste textiles blended with polyester/viscose fibers were emphatically studied. Using partial least squares regression (PLS), artificial neural network (ANN), decision tree (DT), random forest (RF), gradient boosting tree (GBDT), extreme random tree (Extra-tree), decision tree model based on AdaBoost algorithm (AdaBoost-tree), support Vector machine (SVM), one-dimensional convolutional neural network (1D-CNN), and one-dimensional convolutional neural network with improved Inception structure (1D-Inception-CNN) to establish a quantitative model of waste textiles before and after EPO treatment. Then, the effectiveness of the EPO algorithm implementation is evaluated by comparing the determination coefficient (R2) and root mean square error (RMSE) of the model before and after EPO processing.
To the best of our knowledge, this is the first study to investigate the effectiveness of the EPO algorithm for correcting the impact of moisture regain on the NIRS of waste textiles. The results of this study have the potential to improve the accuracy and reliability of NIRS-based models for waste textile sorting and recycling. By demonstrating the effectiveness of EPO in correcting the impact of external factors, this study contributes to the larger effort to promote sustainable waste management.
Material and methods
Textile samples and dataset description
The fabric samples of waste textiles used in this study were obtained from Xinjiang Ruyi Textile and Clothing Co., Ltd. The manufacturer has labeled each fabric sample with ingredient information. The fabric samples are all blended with polyester and viscose fibers. Generally, Near-infrared spectral sequence data is defined as:


Therefore, the fabric sample spectral dataset is defined as:

Due to the complexity of the source and composition of waste textiles, and the vulnerability of the moisture regain of waste textiles to humidity and other environmental factors, the moisture regain of waste textiles is not fixed, making it difficult to establish accurate near-infrared spectroscopy prediction models for qualitative analysis of waste textiles. Therefore, the purpose of this study is to achieve moisture-insensitive prediction of waste textiles, and three data sets were designed for this purpose:
Spectral dataset for dry fabrics samples(
Spectral dataset of fabric samples for EPO algorithm development(
Spectral dataset of fabric samples for testing(
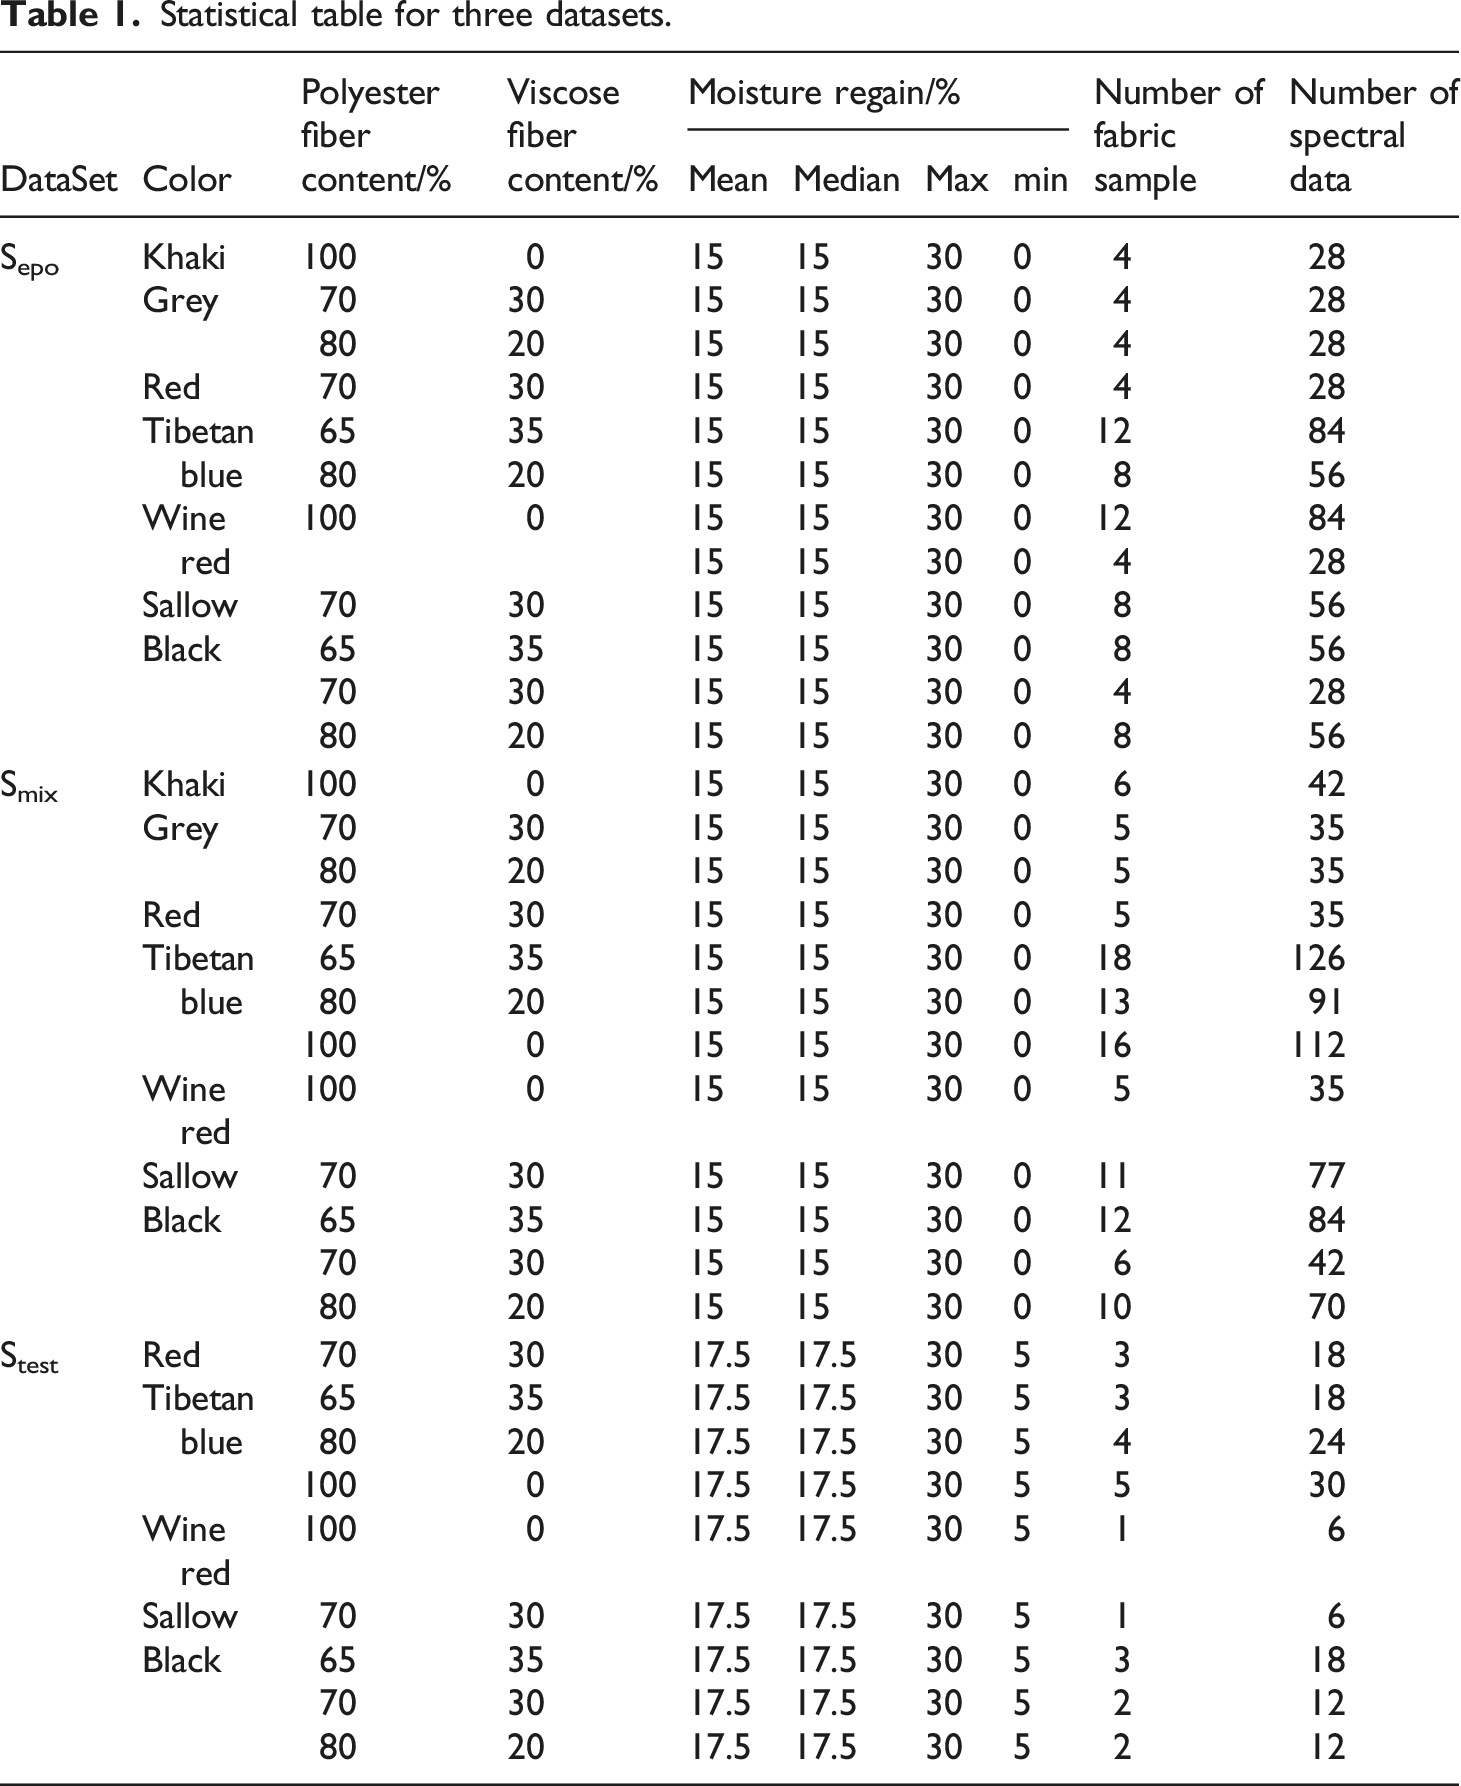
Statistical table for three datasets.

Flow chart of external parameter orthogonalization (EPO) development and validation scheme.
Fabric sample drying and NIR scanning
To achieve a moisture regain of 0% for fabric samples, the experiment used a Y802 N dryer (from Changzhou First Textile Equipment Co., Ltd.) to dry the fabric samples. The fabric samples underwent continuous drying at 65°C for 120 minutes to remove all moisture components.
After drying, the fabric samples are instantly analyzed by a DA200 universal online near-infrared spectrometer (from Tianjin Jiuguang Technology Development Co., Ltd.) in the air atmosphere with a temperature of 20°C and humidity of 50%–60% to collect spectral data of dried fabric samples one by one in the darkroom. The DA200 Near-infrared spectrometer has a spectral range of 950 nm to 1650 nm and a resolution of 5 nm. The upper software of the spectrometer is also developed by Tianjin Jiuguang Technology Development Co., Ltd. The algorithm and model of this study were written in Python.
Each fabric sample was scanned four times on both the front and back sides to calculate the average spectrum as the overall spectrum of the fabric sample. If the fabric sample is too thin, it is folded into 2 or 3 layers before scanning.
Rewetting procedure and NIR scanning
Seven polyester/viscose waste textile fabric samples (0%, 5%, 10%, 15%, 20%, 25%, 30%) were prepared to investigate the effect of moisture regain changes on near-infrared spectroscopy. Each fabric sample is dried (with a moisture content of 0%), quickly weighed, and weighed its dried fabric sample (dry weight of the fabric). Then, quickly place the sample in a rectangular black box with a side length of 20 cm and a depth of 5 cm. We used a spray to evenly spray water on the fabric sample to obtain an incremental moisture level of 5% per sample, and then quickly sealed the sample to prevent water evaporation. The weight of the fabric sample to be sprayed with water is calculated as follows:
Then, the samples were allowed to balance and stabilize for 2h in a black box to fully absorb and distribute water evenly. Then the spectral data of each wet fabric sample was performed. Each fabric sample is scanned four times (two scans on the front and back sides). For thinner fabric samples, they were folded into 2 or 3 layers before scanning. The average spectrum of the 4 scans was adopted as the representative spectrum of the fabric sample. Next, each sample was immediately reweighed to calculate the actual moisture regain level. The water addition step was repeated until the experiment is fully completed.
Spectral preprocessing
The collected near-infrared spectral data of polyester/viscose waste textiles are subjected to standard normal variable (SNV) transformation pretreatment, by the following formula:
Model calibration/validation and EPO transformation with model coupled CV and Wilk’s Λ
In Figure 2, We use the spectra from the Flow chart of using EPO algorithm.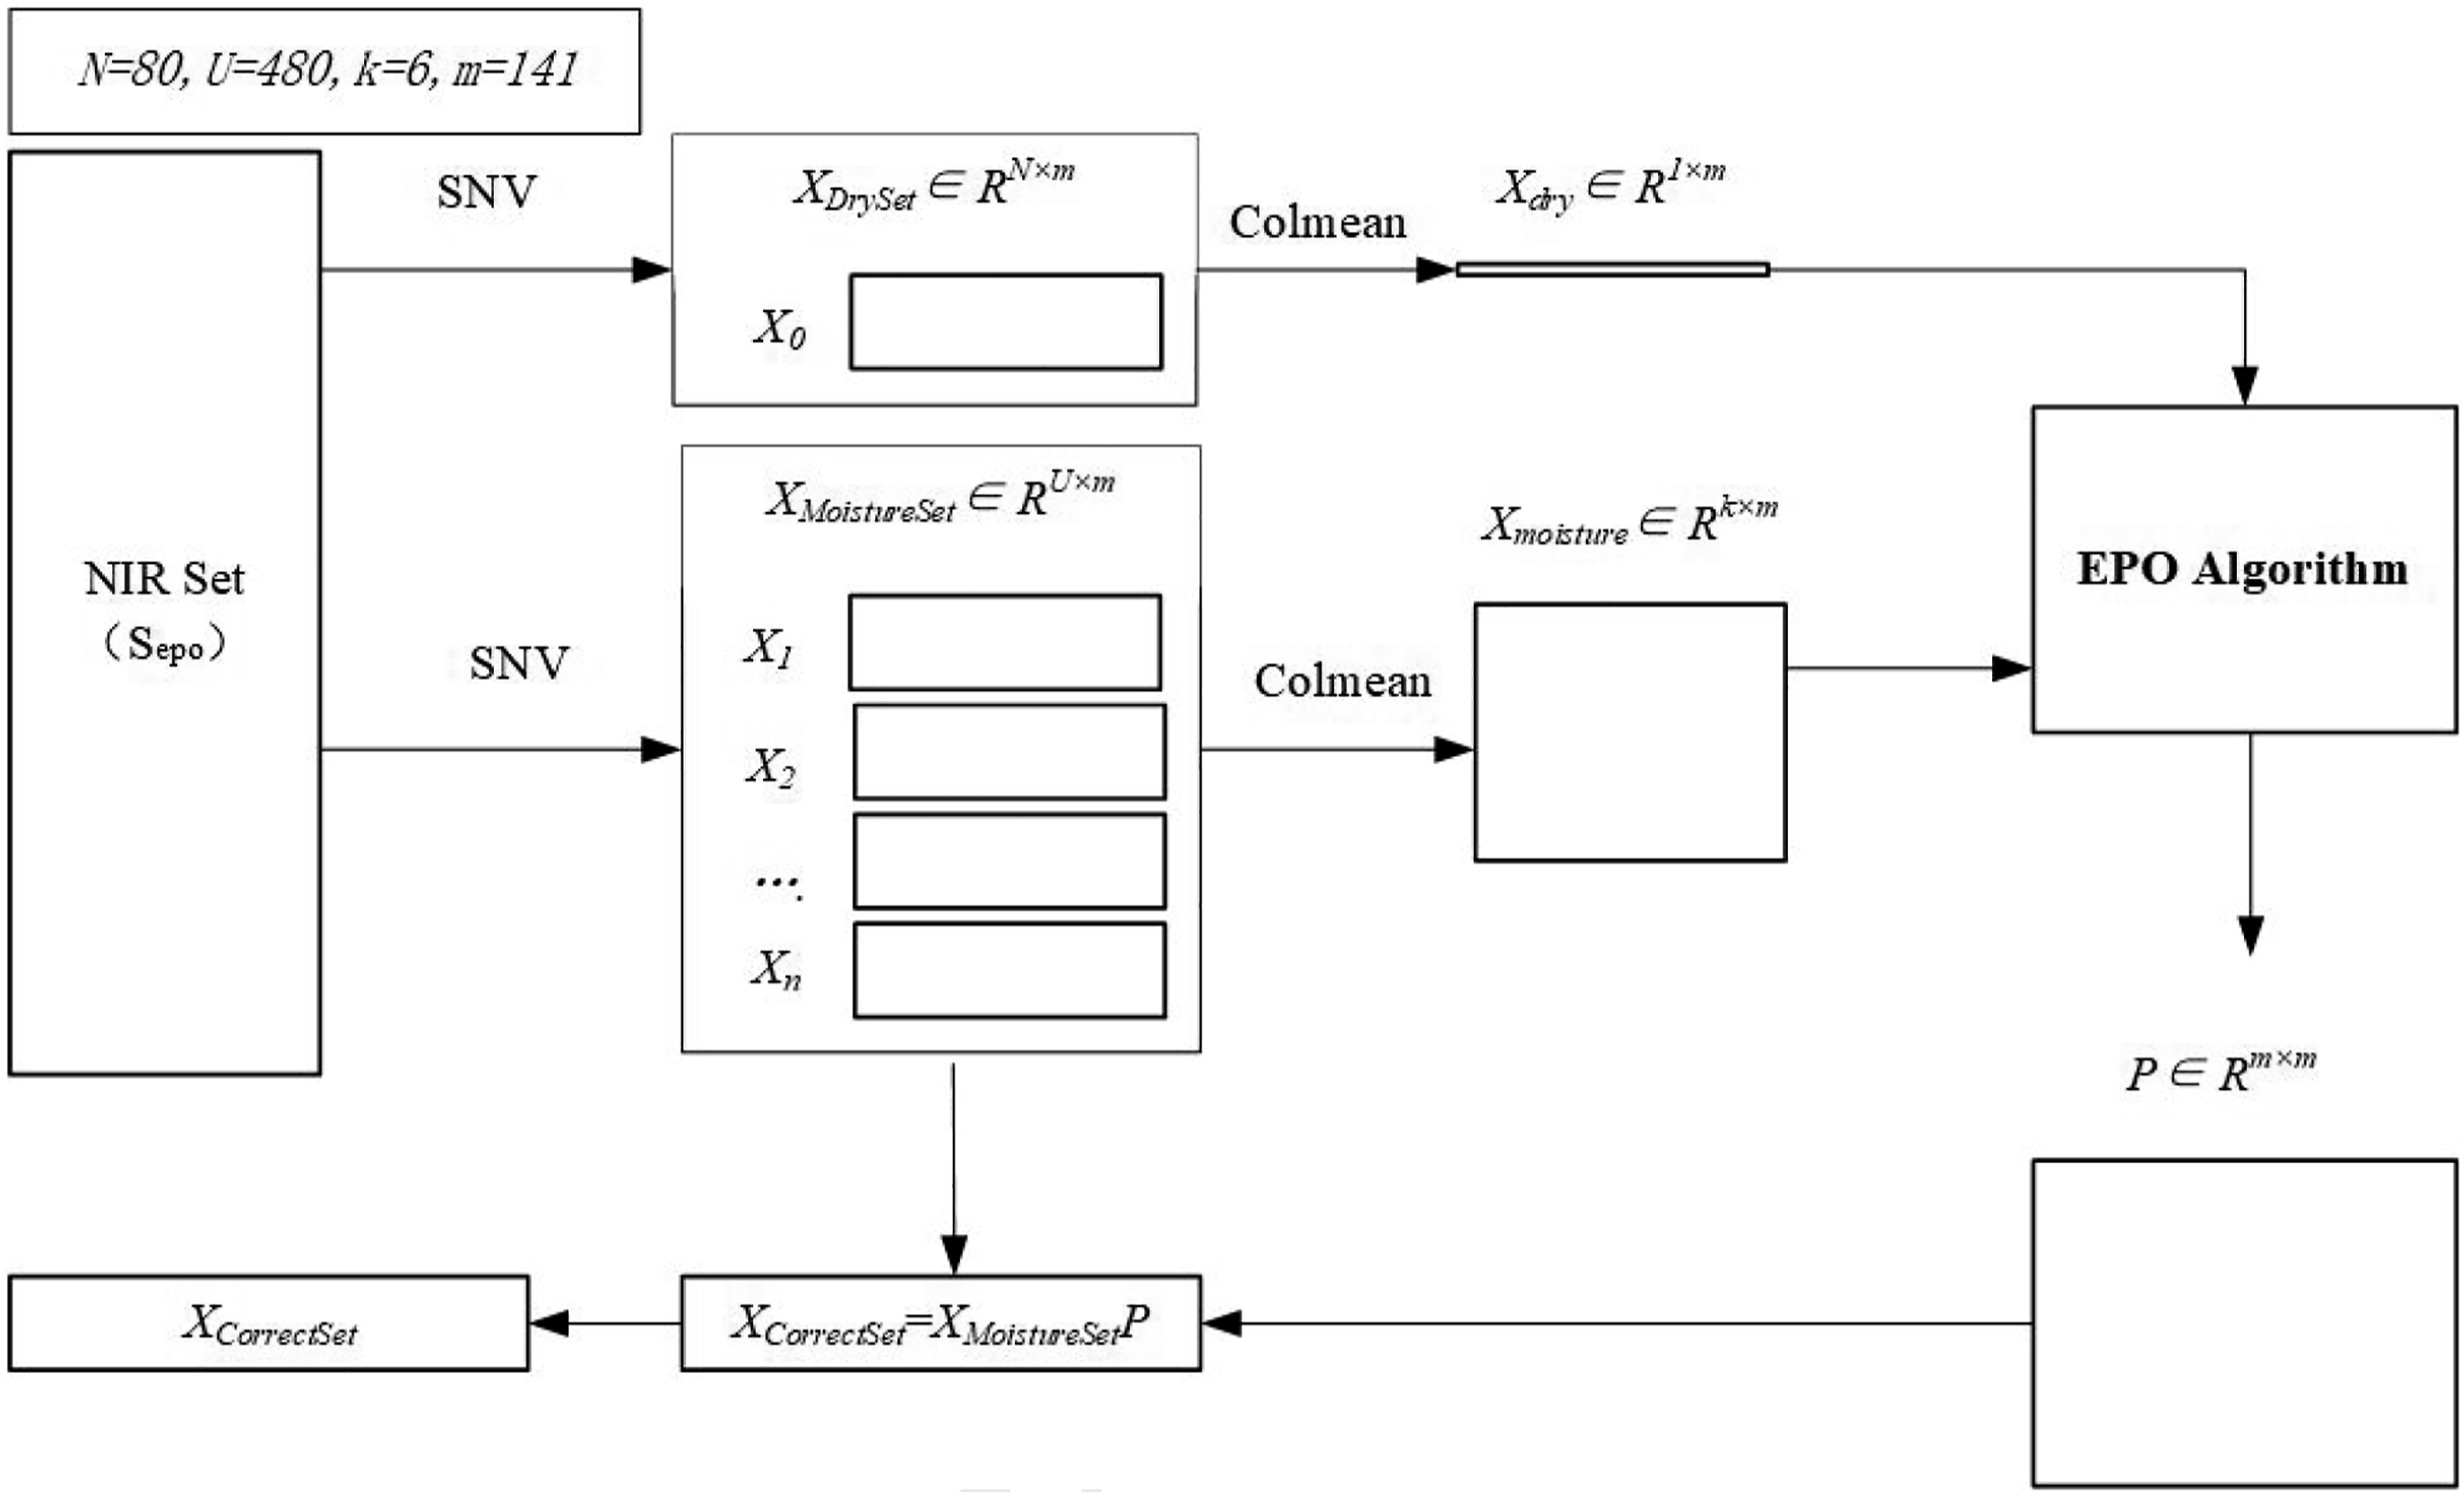
The principle of EPO was orthogonally projecting the original spectra to the subspace of the spectra influenced by external factors. Thus, the effects caused by external factors can be removed.
The EPO algorithm projects the spectrum of all polyester/viscose waste textile fabric samples onto a space orthogonal, allowing the removal of the moisture inferences to the spectral data.
11
The EPO algorithm assumes that the original spectral matrix consists of two parts: a useful component, and a parasitic component caused by external factors (Moisture in this case). The mathematical assumption formula is as follows:


According to the above formula, it can be deduced that: Pseudocode of EPO algorithm.


Model construction and evaluation indicators
After obtaining a dataset of near-infrared spectra of waste textiles, a quantitative model of near-infrared spectra of waste textiles before and after EPO processing was constructed using common machine learning and deep learning algorithms. Finally, the decision coefficient (R2) and error of the model prediction are evaluated to determine the effectiveness of the EPO algorithm. Next, we will introduce the corresponding models.
Decision Tree (DT) regression is a commonly used and effective supervised learning method using a top-down recursive strategy. 12 Decision tree (DT) is easy to understand and interpret, and can handle nonlinear relationships between input features and output variables. Adaboost-tree Regression is an integrated learning method based on the Adaboost algorithm. It combines the advantages of Decision Tree (DT) regression and the Adaboost algorithm, and can effectively handle regression problems. However, adaboost-tree is easy to overfit. Random Forest (RF) is also an integrated learning method based on decision trees(DT), which uses bagging techniques to create new training sets. It includes two essential methods: random feature subspace and out-of-package estimation. The former can construct the tree faster, while the latter can assess the relative importance of each input feature. Random forest (RF) has a stronger generalization ability and is not easy to overfit compared to partial least squares (PLS). 13 Extreme Random Tree (Etrra-tree) Regression is also an integrated learning algorithm based on decision trees, similar to Random Forest (RF), but in the training process of Decision Tree (DT), Extra-Tree randomly selects partition points, further increasing the randomness of the model. Gradient boosting decision tree (GBDT) during the training process of each weak regressor, the gradient boosting decision tree (GBDT) will be weighted based on the residuals of the previous round, thereby gradually improving the fitting effect of the model. Gradient boosting decision tree (GBDT) regression models have high accuracy and robustness and can process datasets with high-dimensional features and large amounts of noise.
Support Vector Machine (SVM) is a learning algorithm with good generalization performance. It can model complex non-linear boundaries using adaptive kernel functions.SVM can handle high-dimensional data, can handle non-linear relationships between input features and output variables, finds the hyperplane that best separates the different classes of data points. Therefore,SVM has achieved excellent results in the classification and regression tasks of Near-Infrared (NIR) spectroscopy. 14 However, It is also computationally expensive and challenging to interpret.
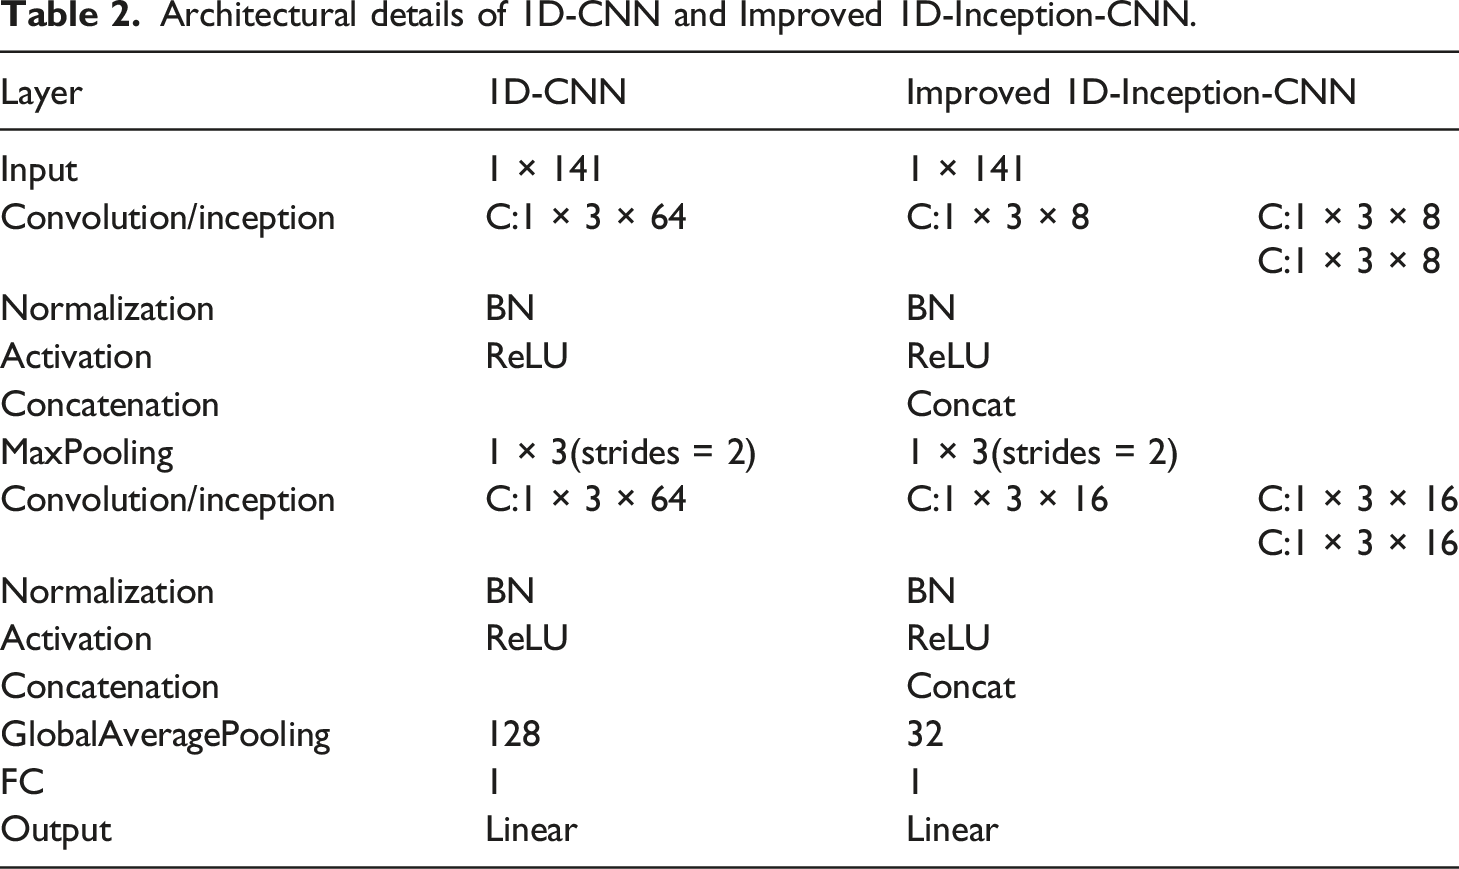
We also built a one-dimensional convolutional neural network (1D-CNN) with two one-dimensional convolutional layers. The structure of 1D-CNN is shown in Figure 4. A batch normalization layer is set behind each convolution layer of 1D-CNN to accelerate the training of neural networks and improve the accuracy of the model. Using the ReLU function as the activation function for 1D-CNN, set a Dropout layer on the last layer to enhance the generalization ability of the model. Table 2 Schematic diagram of one-dimensional convolution network structure. Architectural details of 1D-CNN and Improved 1D-Inception-CNN.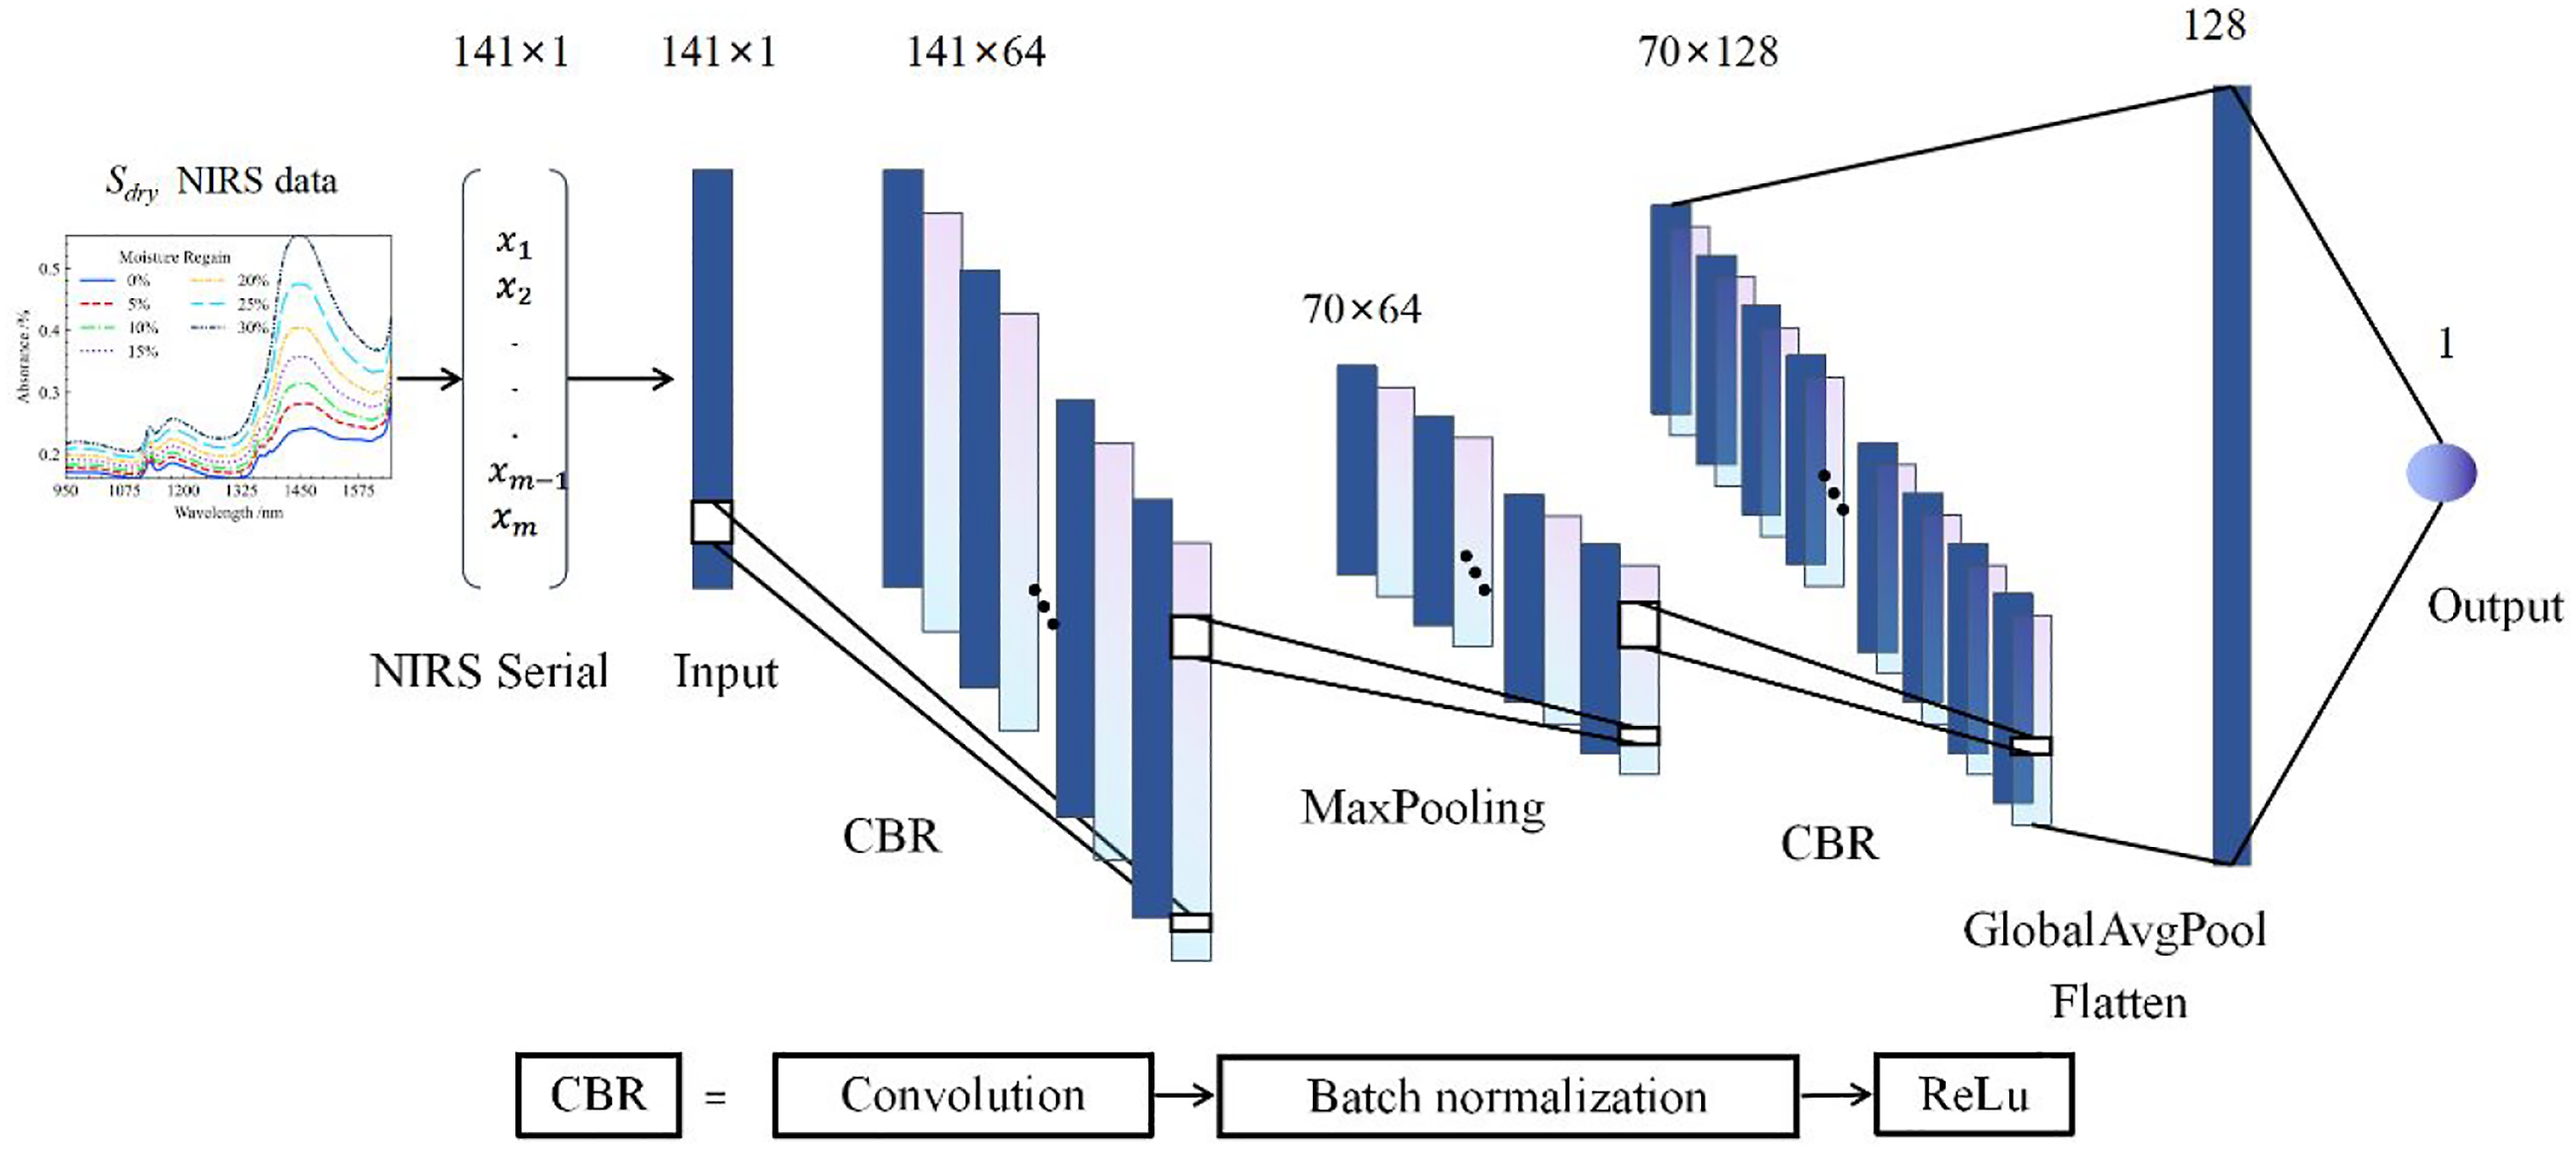
Based on 1D-CNN, an improved 1D-Inception-CNN based on the Inception structure is proposed. Compared with 1D-CNN, the improved 1D-Inception-CNN has a wider receptive field and better model accuracy.
15
The structure of the one-dimensional convolutional neural network based on the improved Inception we built is shown in Figure 5. This neural network uses two layers of improved Inception, each layer of convolution is also set with a batch normalization layer, and the ReLU function is used as the activation function of 1D-Inception-CNN. One-dimensional convolutional neural network with improved Inception structure.
One-dimensional convolutional neural network (1D-CNN) models have several advantages over traditional machine learning methods for modeling near-infrared spectroscopy (NIRS) data:1D-CNN models can automatically extract relevant features from NIRS data, without the need for manual feature engineering. And, 1D-CNN models are capable of learning complex patterns and relationships between spectral features, which can improve the accuracy of NIRS data modeling. Moreover, 1D-CNN models can be trained end-to-end, which can lead to faster and more efficient training.
However, there are also some disadvantages to using 1D-CNN models for NIRS data modeling:1D-CNN models may require large amounts of training data to achieve optimal performance.Interpretability of 1D-CNN models can be challenging, as they are often considered as black boxes.1D-CNN models can be computationally intensive, requiring powerful computing resources for training and inference.
The model performance was evaluated using the following indicators: determination coefficient (R2), root mean square error (RMSE), mean absolute error (MAE), logarithmic mean square error (MSLE), mean absolute percentage error (MAPE), median absolute error (MedAE), and maximum error (Max Error).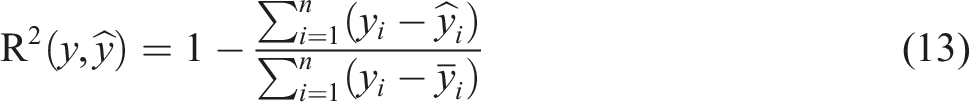


Results and discussion
Analysis of the spectral characteristics of fabric samples with different moisture content levels and the difference spectrum between wet and dry fabric samples
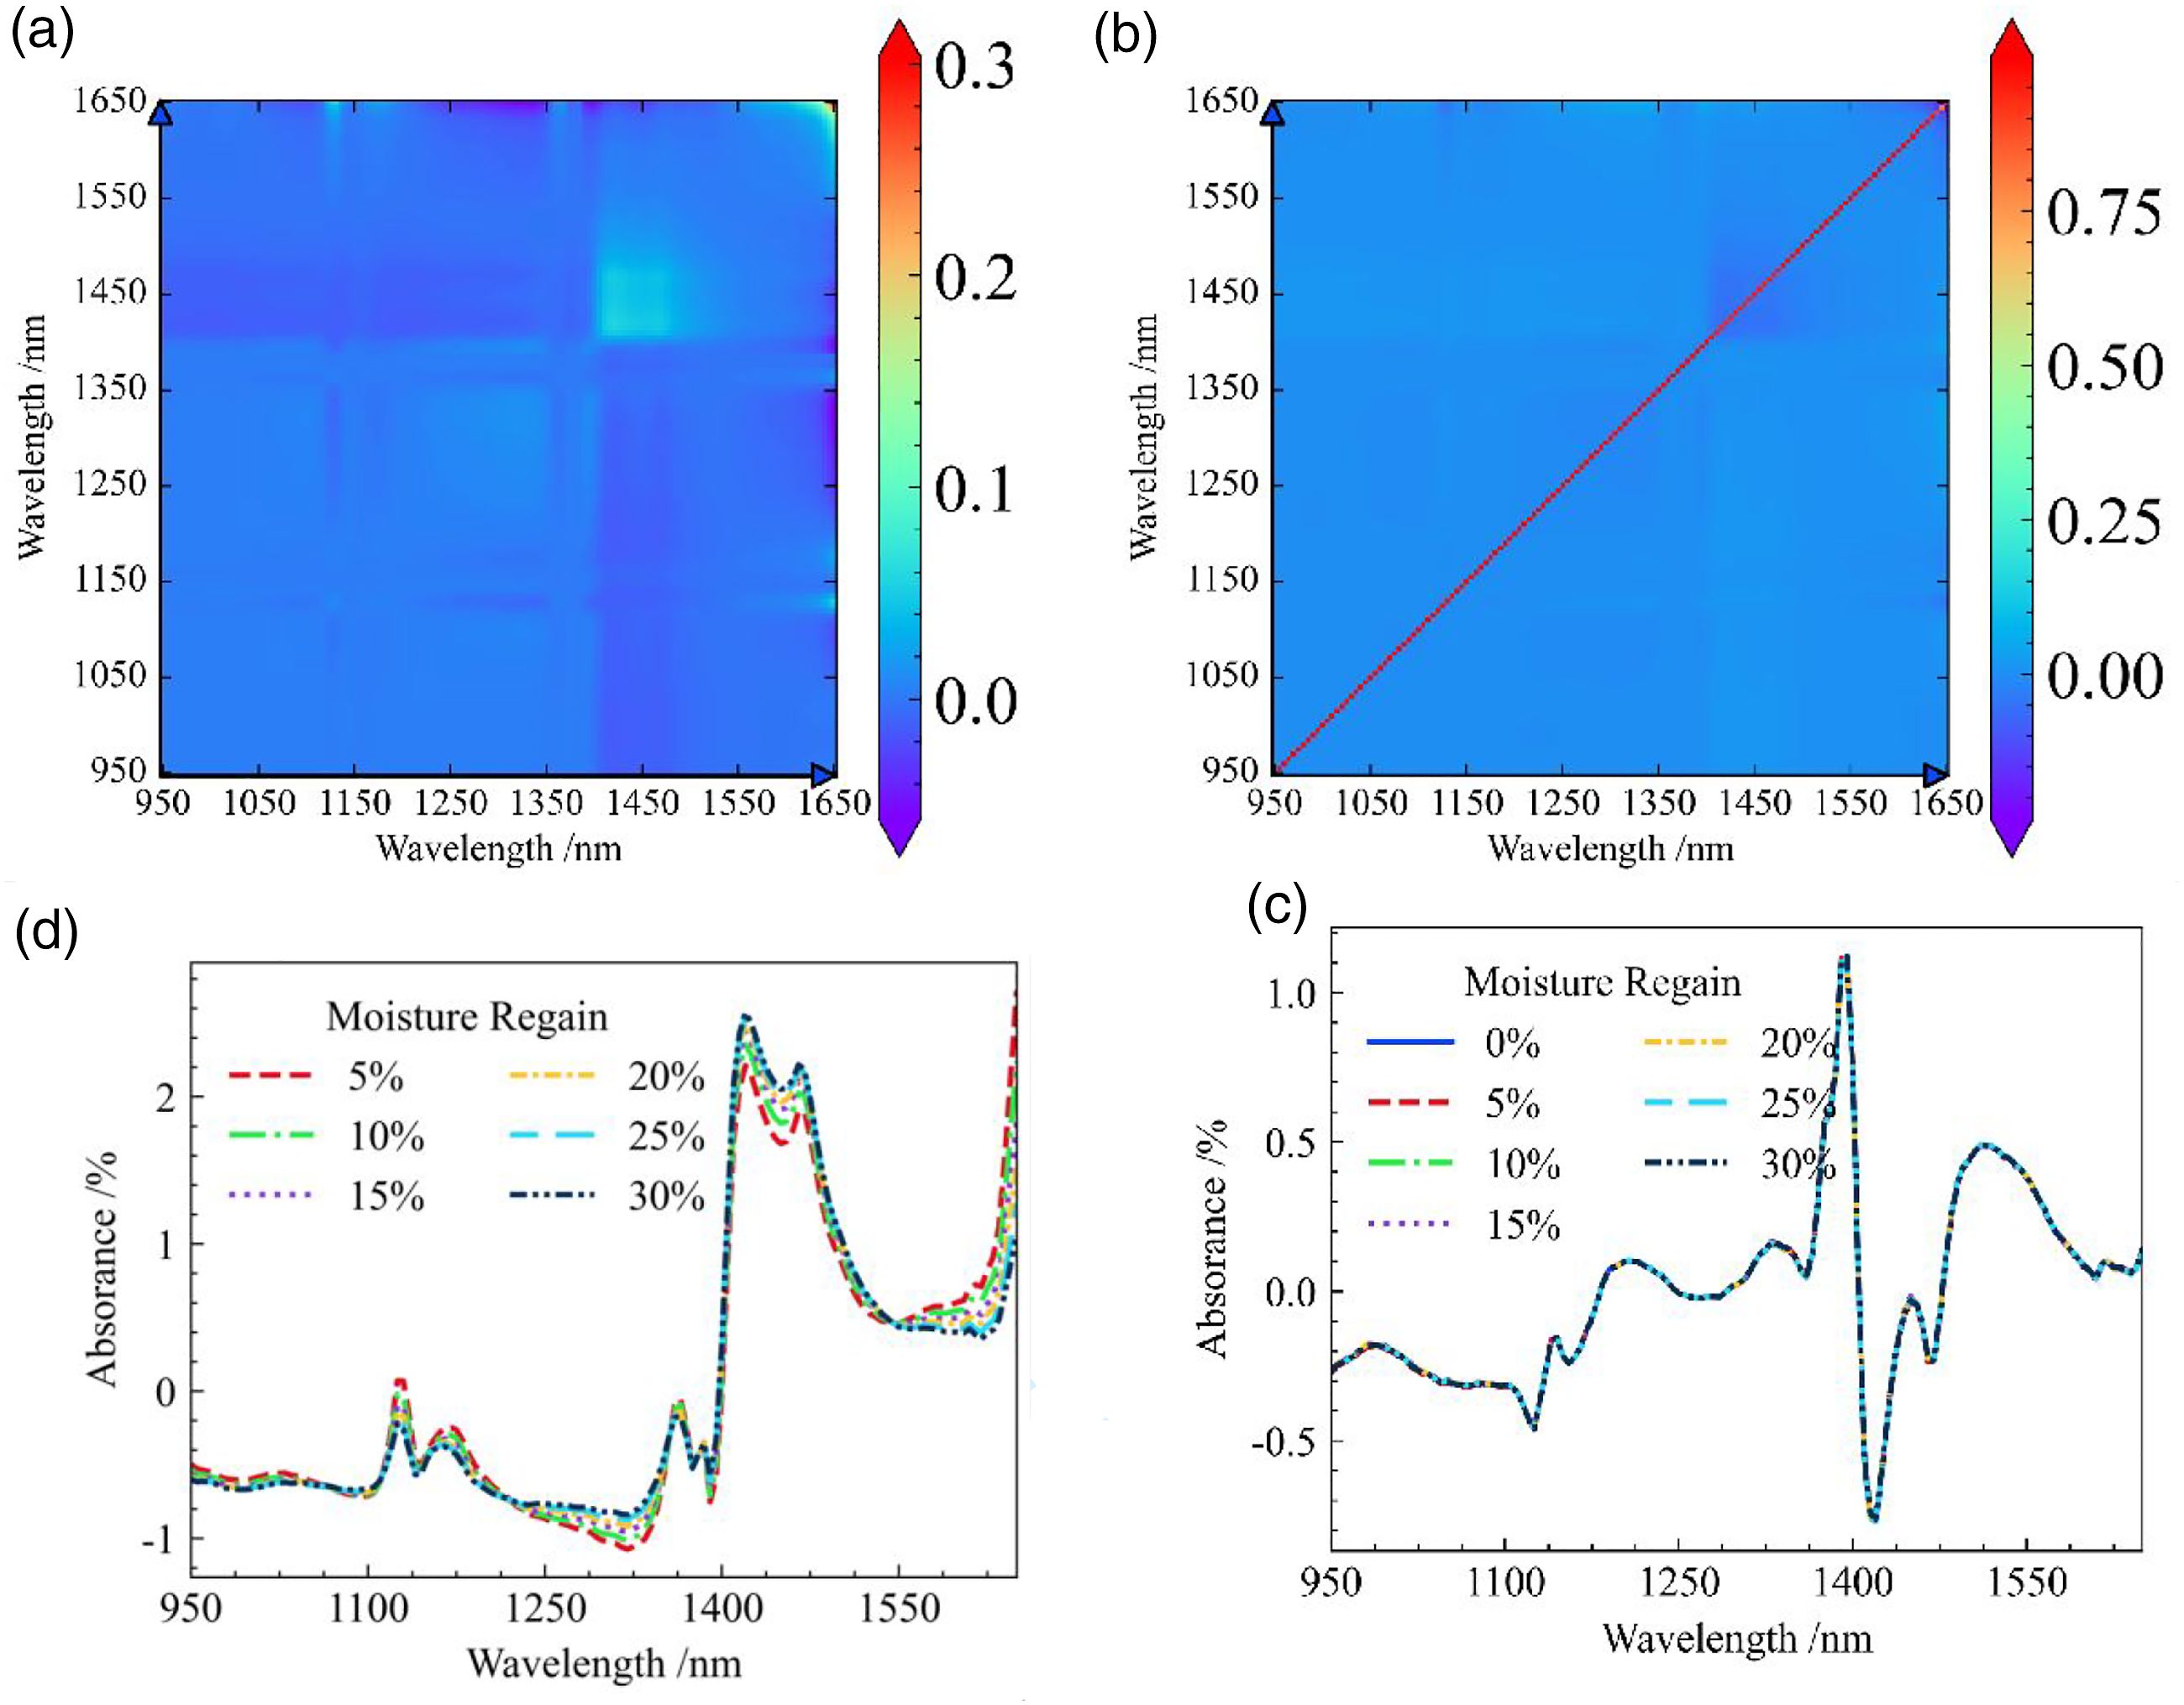
The average spectra of fabric samples for each moisture levels are shown in Figure 6(a). It is clear that the absorbance of the fabric samples increases with the moistrue levels of fabric sample. The absorption peak at 1450 nm is the most prominent. When textiles are exposed to liquids or dry textiles are exposed to moist air, different areas of them may be wetted: the liquid may be between fibers, between yarns, or in the film and gaps of fibers; Or inside fibers, inside fiber pores, inside hollow fiber cavities (such as cellulose or cotton), or inside materials. Due to the fact that each fabric sample with the same moisture level is a Polyester/Viscose textile.
16
So, the main factor that affects the spectrum is the free water inside waste textiles. Average spectrum. (a) The average spectrum of fabric for each moisture levels. (b) Average spectrum after SNV transformation.
The average spectra of various moisture levels after SNV preprocessing are shown in Figure 6(b). The differences caused by the morphology of the fabric samples between various moisture levels were slightly reduced, but there were still apparant differences in the absorption peak shape at 1150 and 1450 nm. This indicates that although the SNV algorithm has a significant effect on reducing scattered light on the surface of fabric samples and removing background noise interference, it cannot remove the influence of the moisture regain rate of waste textiles in near-infrared spectra. The phenomenon of deviation in the spectral curve of the fabric caused by the moisture reduces the accuracy of qualitative models.
Determination of hyperparameters in EPO algorithm
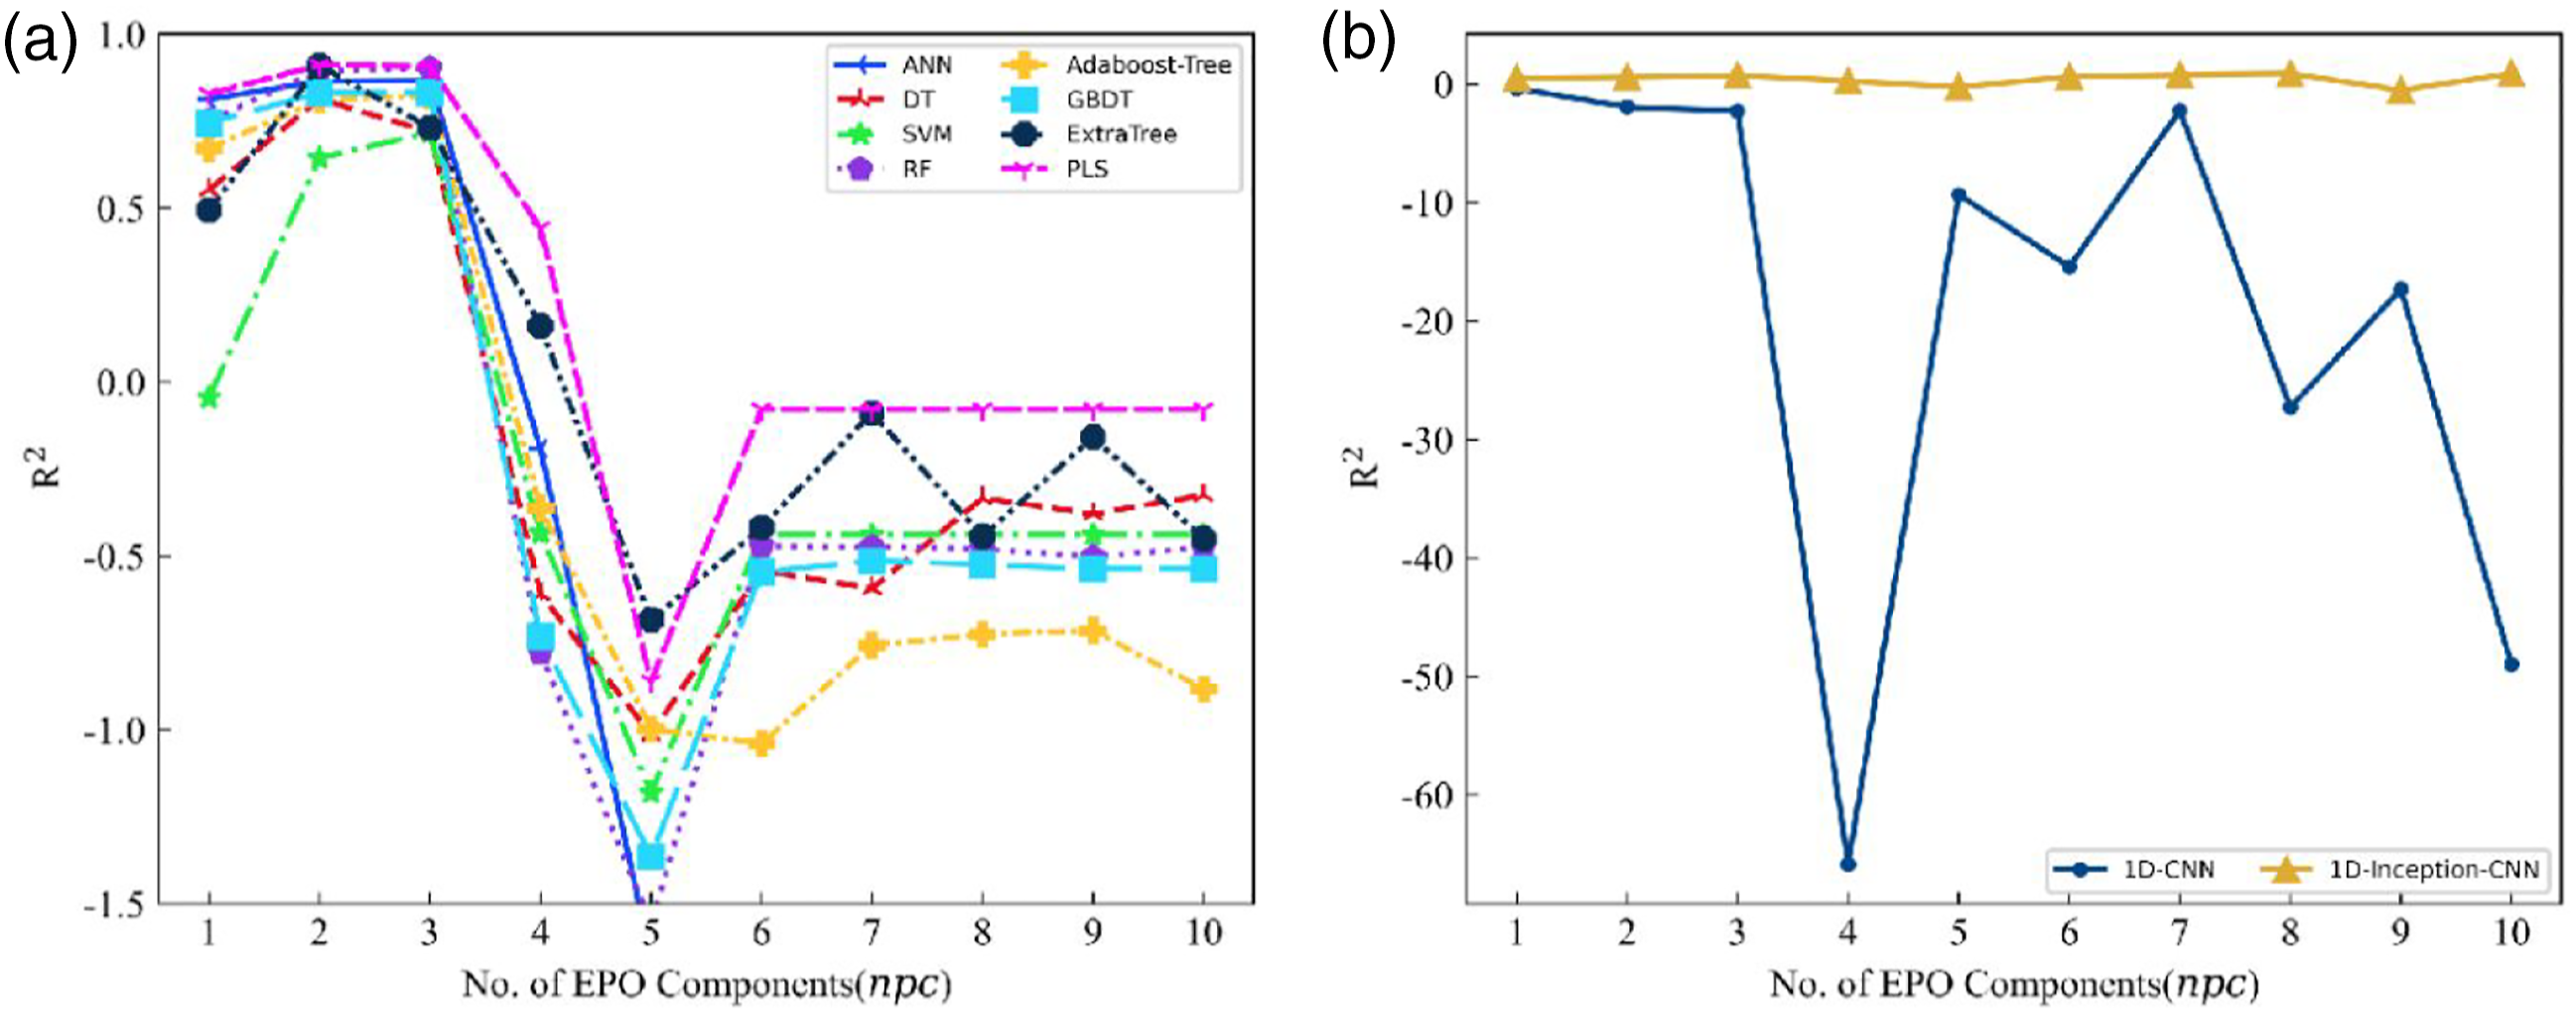
To find the optimal hyperparameter of the EPO algorithm. We solved the Wilk’s Λ with The image of Wilk’s ∧ varies with the external parameter orthogonalization hyperparameter. A higher Wilk’s ∧ indicates that different fabric samples have a higher degree of separation in spectral space relative to the same sample with different moisture levels. Cross-validation results. (a) Changes in R2 scores of regression models for various machine learning EPO algorithms with different hyperparameters after data preprocessing. (b) Changes in R2 scores of regression models for various machine learning EPO algorithms with different hyperparameters after data preprocessing(deep learning).
Analysis of waste textile spectral characteristics corrected by EPO algorithm
The visualization results after EPO algorithm processing are shown in Figure 9 and 10. The average spectra of the fabric samples for each moisture level after EPO algorithm processing are close to consistency. Especially when the Visualization of an external parameter orthogonalization algorithm when the hyperparameter Visualization of an external parameter orthogonalization algorithm when the hyperparameter 
Model evaluation
Machine learning model scoring table before and after EPO algorithm processing.

The mean absolute error (MAE) is used as the loss function in the training of 1D-CNN and 1D-Inception-CNN. The The loss value and R2 score change curve of the one-dimensional convolutional neural network before and after processing by EPO algorithm. (a) Loss value variation curve without using EPO algorithm. (b) R2 variation curve without using EPO algorithm. (c) The loss value change curve using the EPO algorithm. (d) R2 variation curve using EPO algorithm. The loss value and R2 score change curve of the improved Inception convolutional neural network before and after the EPO algorithm processing. (a) Loss value variation curve without using EPO algorithm. (b) R2 variation curve without using EPO algorithm. (c) The loss value change curve using the EPO algorithm. (d) R2 variation curve using EPO algorithm.

According to the above experiments, it is easy to prove that the moisture of waste textiles will greatly impact on near-infrared spectroscopy, which will lead to extreme distortion of qualitative analysis of waste textiles by near-infrared spectroscopy. Using EPO algorithm to process the data can effectively improve the applicability and score of the model.
Conclusion
The analysis leads to the following conclusions: 1. Moisture significantly impacts the near-infrared spectra of waste textiles, and there is a strong absorption peak near 1150 and 1450 nm in the spectrum. 2. The overall spectral reflectance of waste textiles decreases and their absorption increases, as the moisture regained from them increases.The OH bonds in water molecules are the cause of this phenomenon, as found through relevant literature. 3. Using SNV as a preprocessing method is insufficient to correct the spectral measurement error caused by moisture, thus affecting the model’s analysis of waste textiles. 4. Both deep learning and machine learning are affected by the moisture content of waste textiles, resulting in low accuracy. 5. Adopting the EPO algorithm greatly improves the model’s accuracy and sorting capability of waste textiles. The progress is enormous.Near-infrared spectroscopy measurement of waste textiles in the laboratory can avoid the interference of many environmental and human factors, and the data obtained are of high quality and good repeatability. The accuracy of modeling improvement is more obvious. However, in the factory environment of waste textile sorting, the near-infrared spectrum of waste textiles is bound to be affected by color, weight, surface texture, fabric structure, environmental temperature, light conditions, and other possible factors. Since the moisture regains of waste textiles is the most essential part of the external environmental factors, we have demonstrated that EPO can be applied to reduce the influences from external noise.
We have verified the effect of fabric coating on the near-infrared spectrum of waste textiles, and the result is that fabric coating impacts the near-infrared spectrum of waste textiles. However, whether the EPO algorithm can also be used to correct this error requires further discussion. With the development of deep learning, using autoencoders to denoise data is a very effective method. Using an autoencoder to correct the near-infrared spectra of waste textiles affected by moisture is also a promising method, and further discussion is needed on its feasibility.
Footnotes
Declaration of conflicting interests
The author(s) declared no potential conflicts of interest to concerning the research, authorship, and or publication of this article.
Funding
The author(s) disclosed receipt of the following financial support for the research, authorship, and/or publication of this article: This work was supported by the Major Science and Technology Program of Xinjiang Autonomous Region: Development and Demonstration of Technology for Conversion and Utilization of Waste Textile Raw Material Resources(NO.2020A03002-4) and Project of Xinjiang Production and Construction Corps' Science and Technology Research Program: Technical Promotion of Intelligent Sorting and Packaging System for Cotton Spinning Yarn in Southern Xinjiang Textile Enterprises (NO.2019AB014).