
Abstract
The present work is an attempt to model the diameter of Poly Lactic-co-Glycolic Acid (PLGA) nanofibers by utilizing response surface methodology (RSM) and artificial neural networks (ANNs). Hence, determining the optimal electrospinning process conditions to produce a minimum fiber diameter. For modelling the average diameter of nanofibers, RSM approach based on four parameters (polymer concentration, high voltage and needle tip to collector distance and spinning angle) with five-level was compared to ANN technique. In the RSM approach, central composite design (CCD) was used to determine the individual and interaction impacts of the parameters on the average diameter of nanofibers. Several ANNs of single and double hidden layers with different number of cells for each were tried to obtain the best network structure. The experimental and predicted PLGA fiber diameters using an ANN showed a strong correlation, indicating that the network topology of 4-14-1 has good predictability for analyzing factors impacting PLGA fiber diameter. The average absolute relative error for predicting PLGA nanofibers’ diameter using ANN (2.24%) is slightly less than that obtained from RSM (2.59%). The high regression coefficient between the variables and the response (R2 = 0.9636) shows a good second-order polynomial regression model for evaluating experimental data. The R2 value was 0.945, indicating that the ANN model was good fitting with the experimental results. The optimum combinations (PLGA concentration of 26 wt.%, high voltage 22 kV, needle tip to collector distance 20 cm, and spinning angle 60o) were developed by RSM model for electrospinning PLGA nanofiber that can produce fine, consistent, and high-quality nanofibers.
Introduction
Poly Lactic-co-Glycolic Acid (PLGA) is considered as one of the most popular biodegradable polymers approved by the U.S. Food and Drug Administration. 1 Poly Lactic-co-Glycolic Acid is one of the extensively coveted resorbable polymers, mainly due to its availability in different molecular weights, compositions, and degradation rates for medical devices and drug deliveries.2,3 The transformation of PLGA into textile structures such as micro/nanofibers, using the electrospinning technique, is complicated and depends on different variables during the process. 4 Modeling of the electrospinning process of PLGA micro/nanofibers is therefore highly desirable. Moreover, silk fibroin/PLGA electrospun nano-dressings displayed improved wound closure compared to just PLGA dressings and to control samples in an in vivo wound model of diabetic rats due to a demonstrated improved re-epithelialization process. 5 When polymer-based materials are produced in the form of nanofiber structure, they might have unique properties such as high surface area, high porosity, and superior mechanical, chemical, and electrical properties leading to a wide range of applications.6–10 Although there are other techniques to form polymer-based nanofibers, such as drawing, self-assembly, phase separation, template synthesis, etc. electrospinning method has been accepted as the most practical technique. 11 Electrospinning has received increasing interest and attention in recent years for fabricating micro/nanofibers of various materials; this is due to its versatility and capability of multiple field applications, including filtration, biosensors, tissue engineering, wound dressings, drug delivery, and composites. 12 Poly Lactic-co-Glycolic Acid nanoparticle has become the most popular form of drug delivery. Nanofiber is a new form of polymer morphology which can be produced by electrospinning technique with high efficiency and flexibility. This technique utilizes the electric field`s high voltage to pull polymer solution into nanofibers in electric field while evaporating organic solvent immediately. Poly Lactic-co-Glycolic Acid electrospun nanofibers have been widely used in drug delivery, biosensing, tissue engineering, and regenerative medicine. 13
Design of experiments (DOE) is extensively adopted in industry to improve processes, product design or obtain an optimal parameter-setting for process parameters. When utilizing DOE, response surface methodology (RSM) is frequently employed to obtain the optimal parameter-setting following analysis of variance (ANOVA) for identifying significant factors. Through RSM, an equation (i.e. response surface) representing the approximate relationship between a single response and control factors can be obtained based on experimental data. A contour plot is used to characterize the response surface graphically and determine the optimal parameter-setting. When multiple responses are considered, the optimal parameter-setting is obtained by observing overlay contour plots. 14 Design of experiment is a mathematical and statistical approach for modeling and optimization of synthesized nanoparticles. 15 Previous studies have investigated the effect of electrospinning parameters through one-factor-at-a-time method.16–20 But previous methods were time consuming and did not examine interaction effects. Especially, when studying the effects of various properties of the electrospinning solution, different properties are normally varied simultaneously as the concentration or the composition of the solution changes. To overcome these limitations, RSM is often utilized.21–25 As an effective statistical modeling tool, RSM can be used for enhanced inference, studying interaction effects, and parameter optimization. 26 It is a technique that maximizes inference while minimizing the number of experimental runs and costs of experimentation. 27 Optimization of mechanical performance of ramie and kenaf fibers in epoxy composites generated utilizing the hand layup approach. 28 Taguchi’s Coupled Grey Relational Analysis was used to optimize the machinability of Sic waste fillers reinforced polymer matrix composites. 29 The influence of various parameters on the tribological characteristics of pineapple/sisal/TiO2 filler incorporation was optimized by using Taguchi’s approach 30
Recently, artificial neural networks (ANNs) have been used as a new approach for modeling the interaction between nanofibers diameter and electrospinning parameters. 31 Artificial neural networks are computational tools for pattern recognition and use computer technology to model a biologic neural system. By training on a known set of data, ANNs learn complex interaction among inputs and are capable to produce an output for new inputs. 32 Sarkar et al. investigated the viability of ANNs as a tool for predicting the diameter of fibers formed by electrospinning process. Their results demonstrated the ability of the neural network approach as a promising tool for predicting nanofiber diameter. 33 Karimi et al. 34 proved the efficacy of the ANN technique in the prediction process of nanofiber diameter of polymers including poly (vinyl alcohol) and chitosan at different ratios. Moreover, Kalantary et al35,36 showed that although prediction process of the diameter of a nanofiber is very difficult, because of complexity of the interactions of the factors that have an influence on the diameter and the fact that there is no comprehensive technique for predicting a nanofiber’s diameter, ANN modeling results in high accuracy in comparison with multiple regression analysis results for the prediction of electrospun nanofibers’ diameter.
Several studies have focused on the investigation of electrospinning processes using RSM and ANN in recent years. This summarises the findings of studies on electrospinning modelling aimed at forecasting nanofiber diameter [e.g. Nylon 6,6,7,37 Polyacrylonitrile,25,38 Polyethylene oxide, 39 etc.]. Despite the fact that numerous polymers have been investigated, no attempt has been made to simulate the electrospinning process of PLGA nanofiber, which is widely employed in biomedical applications. Recent progress in the fabrication of PLGA nanofiber arrays has led to many biomedical applications, including guided tissue regeneration,40–42 enhanced human endometrial-derived stromal cell proliferation in cellular therapy, 43 potential local chemotherapy for breast tumor formation. 44 The aligned and random PLGA nanofiber arrays were tested for their abilities to capture HCT116 cells, providing cancer cell capture efficiencies of 66 and 80%, respectively. 45
Given the importance of the biological applications of PLGA, it was necessary in this research to cover the shortcomings found in previous studies by modelling the variables related to the manufacturing process and controlling the diameter of the PLGA fibers. This paper attempts to analyze various electrospinning parameters affect PLGA diameter. Among the most widely utilized polymers in biomaterials research, PLGA is described using two modelling methodologies in this paper. Solution concentration, high voltage, needle tip to collector distance, and spinning angle are the electrospinning parameters that are evaluated. In this study central composite design (CCD) was used to find the optimum conditions in preparation of PLGA nanofibers with the minimum diameter and best morphology. 46 The association between polymer fiber diameter and the aforementioned parameters is then investigated using RSM and ANN methodologies. In addition, this study compares and discusses the two proposed models.
Experimental work
Materials
Poly (D, L-lactic-co-glycolic acid) (PLGA, lactide: glycolide 65:35, Mw 40,000–75,000 g/mol) was supplied by Sigma-Aldrich. N, N-dimethylformamide (DMF) was obtained from Elnasr pharmaceutical chemicals company, Egypt.
Poly lactic-co-glycolic acid solution preparation and Electrospinning methodology
Poly Lactic-co-Glycolic Acid solutions of 22, 24, 26, 28 and 30 wt% concentrations were dissolved in DMF before the electrospinning approach. The homogeneous solution was acquired after mixing under continuous stirring at room temperature for 3 h. Electrospinning was achieved at room temperature. Poly Lactic-co-Glycolic Acid solutions were poured into a 10 mL glass syringe with a stainless-steel needle of 0.9 mm inner diameter. A high voltage power supplier (Genvolt, model 73030P of 30 kV maximum voltage) was used to perform electrospinning. A clamp was utilized to conduct the positive charge (ranging from 16 to 28 kV) to the tip of the needle, while the negative charge was conducted to the grounded metal collector with dimension of 15 × 15 cm. The metal collector was covered with aluminum foil. The electrospun fibers were collected on the metal collector at 16–24 cm from the tip of the needle and spinning angle ranging from (30°–90°). Figure 1 shows the electrospinning experiment setup. Electrospinning experiments setup.
Design of electrospinning experiments
Response surface methodology
Experimental factors and levels.


Performed experimental results and the predicted values of RMS and ANN.

The ANOVA was used to examine the given mathematical model. The significance of each term in the developed model can be restricted when F and p-values were studied. p-values < .05 indicate that the factor has a significant impact on the nanofiber diameter. 47 Also, to verify the accuracy and fitness of the adequate model Coefficient of determination (R2) and adjusted-R2 were studied. R2 depicts the proportion of the total variability demonstrated by the regression model. Therefore, a value greater than R2 indicates that the model is more reliable. The larger values of (R2) and adjusted-R2 indicate how well the model agrees with the experimental results.48,49
Artificial neural networks
The used multilayer neural network, Figure 2(a) consists of an input layer contained four cells (each one is corresponding to an experimental factor) connected to the output layer (one cell) via hidden layer(s). Each cell in the layer is connected to the next layer’s cells through weighted connection. The construction of the hidden layer’s and output layer’s cells were shown in Figure 2(b). Adjusting the values of the weighted connection called the training operation. Twenty-five experiments, from the twenty-seven executed runs, are used to obtain an ANN to predict the electrospun PLGA nanofibers’ diameter. Experiment 25 is chosen from the identical runs (25, 26 and 27) stated in Table 2. These twenty-five experiments are randomly reordered and divided into 3 groups, training, validation and test. The 1st group contained 60% of the experiments (15 ones) used in training the ANN. While the other two sets, 20% of the experiments for each, were used as validation and test sets, respectively. Where the validation set was used to stop the training operation and the test one was used to test the obtained ANN. ANN for fiber diameter prediction.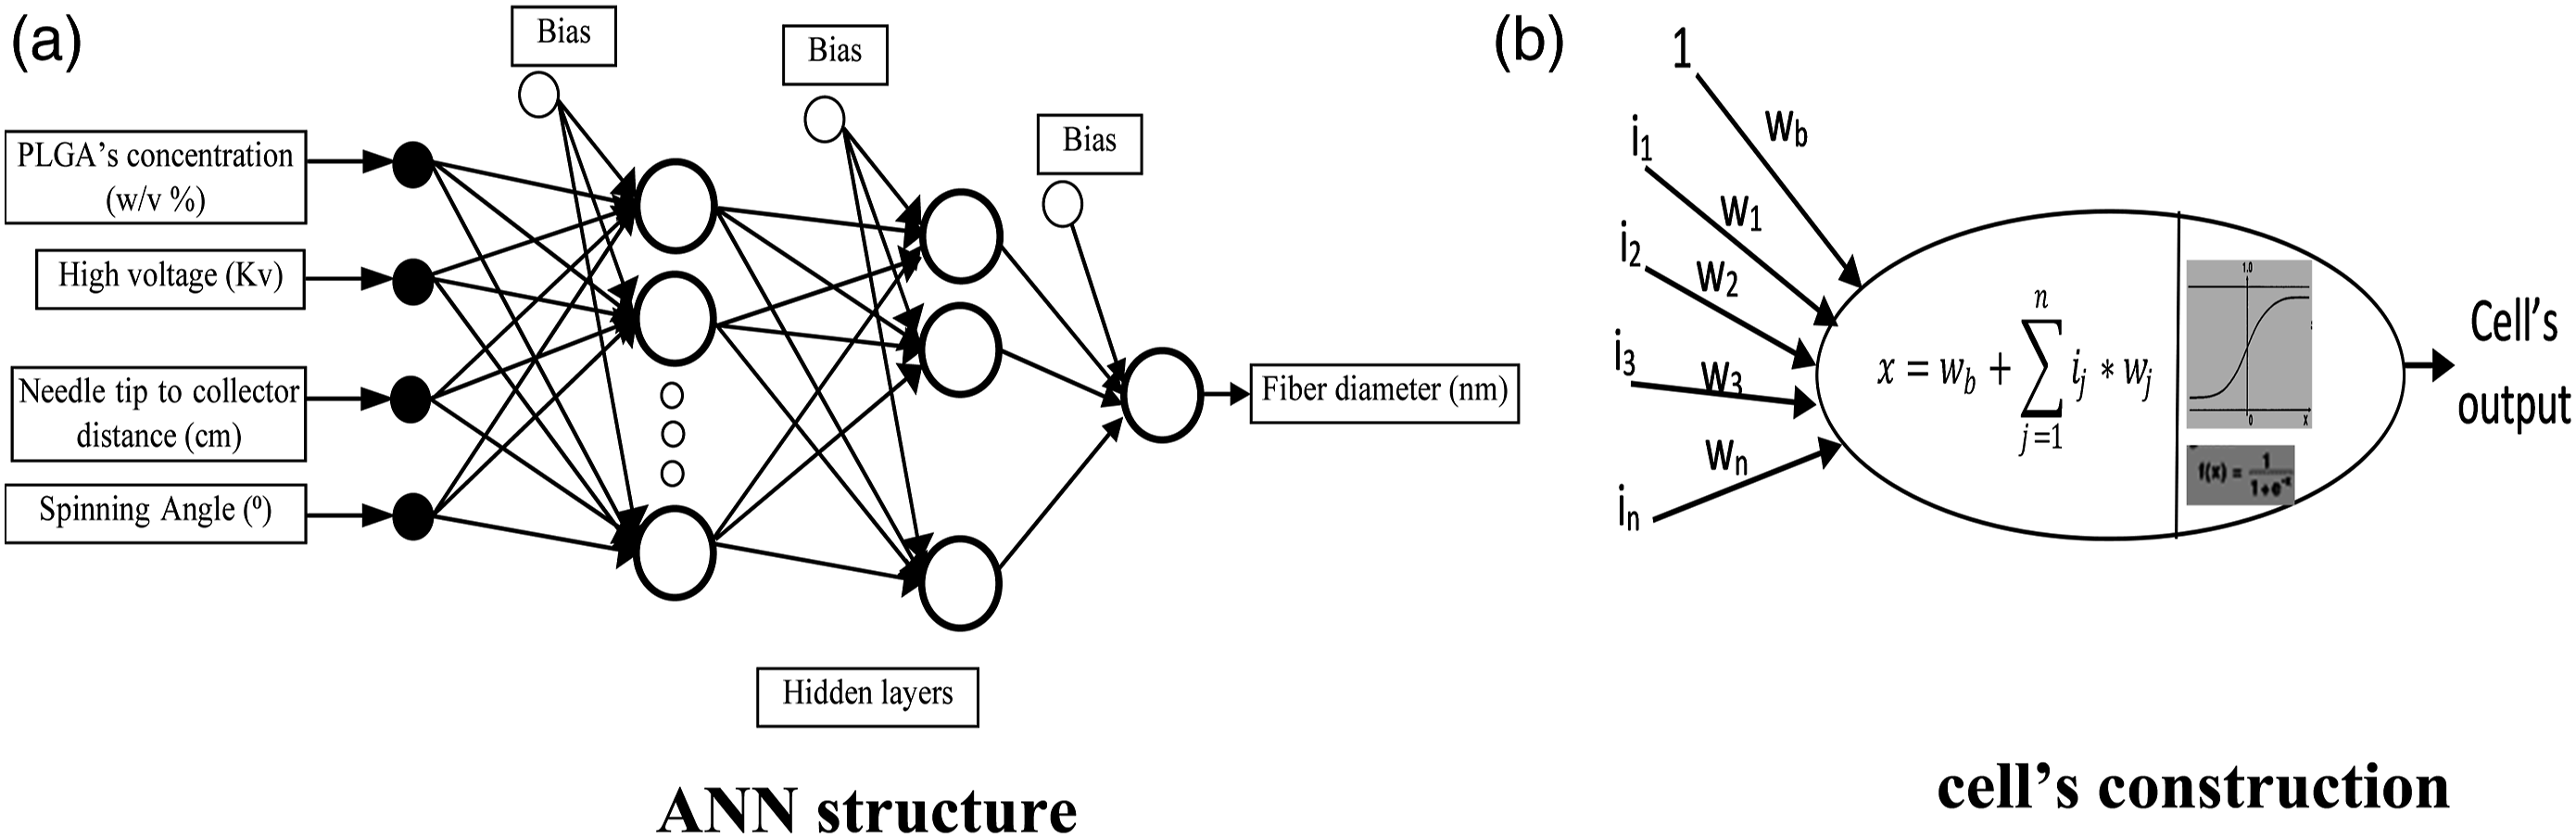
The input and output data for the ANN were pre-normalizing between 0.1 and 0.9. Different ANNs structures were tried, one or two hidden layers with different number of cells for each, to obtain the most suitable one. Backpropagation learning algorithm which is a supervised learning algorithm and one of the most considered multilayer ANN’s learning algorithm was used in the training for the present job. 50 One of the most stable and fastest backpropagation algorithms is Levenberg–Marquardt algorithm51–53 will be used through the present training process of the developed ANNs.
Measurement of intrinsic viscosity (η)
Time versus PLGA/DMF concentrations.

The intrinsic viscosity is defined as the ratio of specific viscosity (
The intrinsic viscosity (
The computed values of
Characterization of fibers morphology
The diameters and morphology of the electrospun fibers were characterized by utilizing scanning electron microscope (FEI Quanta 250, Hillsboro, Oregon-USA) at the Egypt Desalination Research Center of Excellence (EDRC), [Desert Research Center (DRC), Egypt]. The average diameter and distribution of the electrospun fibers were measured precisely by correlating the number of the points (about 100 random nanofibers). Image J software was utilized to measure distance from the SEM in each image under a suitable magnification. A typical SEM photograph of an electrospun nanofiber mat and its related histogram of fiber diameter distribution are presented in Figure 3(a) and (b). (a) A typical SEM photograph of electrospun nanofiber diameter. nanofiber mat, (b) corresponding fiber diameter distribution (PLGA concentration: 30 wt.%, needle tip to collector distance: 20 cm, high voltage: 22 kV and Spinning angle: 60°).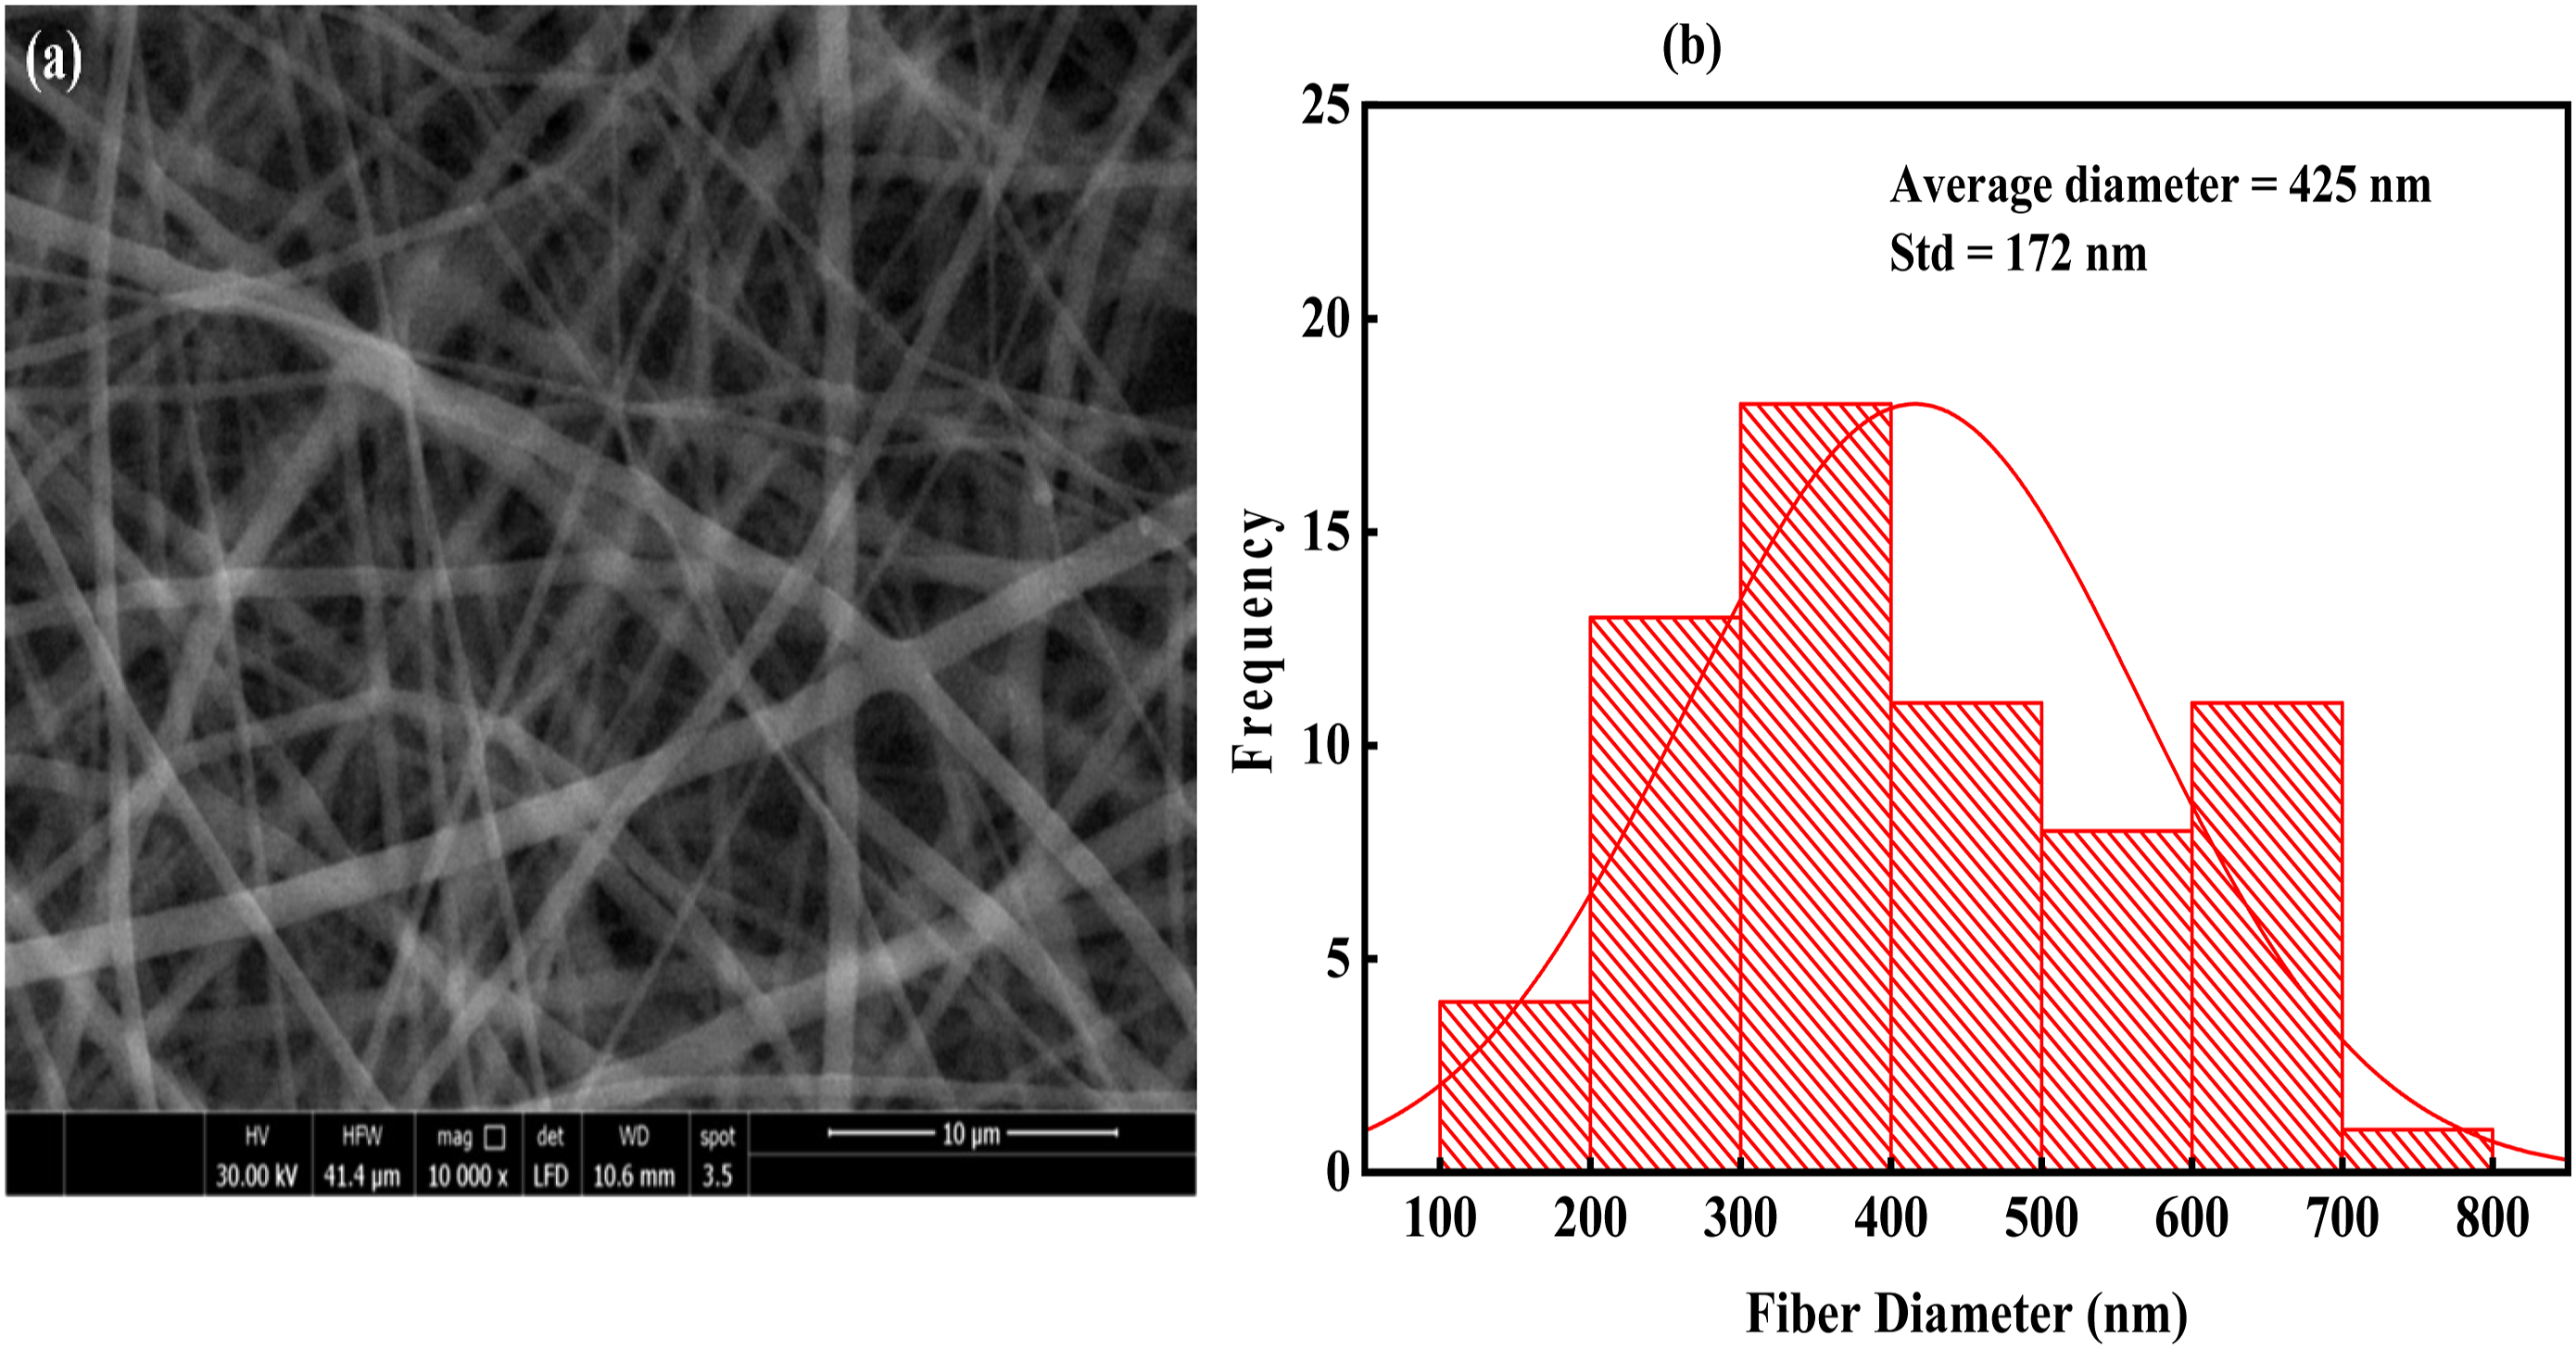
Results and discussion
Intrinsic viscosity of PLGA/DMF
The intrinsic viscosity value (η = 1.0475) for the PLGA/DMF polymer solution has been estimated from the intercept of the fitting lines with the vertical y-axis as explained in Figure 4. Intrinsic viscosity for PLGA/DMF solution.
Morphology characterization of electrospun PLGA fiber
The morphology of electrospun PLGA fiber has been impressed by the dimensionless parameter (Berry’s number). Berry’s number essentially includes polymer(s) concentration, polymer(s) molecular weight, and polymer/solvent solubility parameters. Berry’s number is a measure of the degree of the molecular chain entanglement. Berry’s number can be calculated as followed:
Figure 5 represents the morphology of electrospun PLGA fibers collected by electrospinning from input parameters, recorded in Table 2. A transformation of the fibers from beaded to bead-free was inspected as the concentration raised from 22 to 24, 26, 28 and 30 wt.%. Beading is a common occurrence in electrospinning, and it can be caused by a variety of process conditions. According to the low viscosity, the starting jet cannot be sufficiently extended under the applied electrical field when the concentration is low, and the low viscoelastic force is insufficient to overcome the surface tension. Beads were formed because of the capillary instability.54,55 Morphology of electrospun PLGA nanofibers for the design matrix shown in Table 2 (the scale bar is 20 μm).
Small bead defects and short fibers formation was collected at 22% concentration of PLGA in DMF solvent (Be# = 23), high voltage = 22 kV and distance = 20 cm as shown in Figure 5 (Exp. 17). The fiber with beads are collected at 24% concentration of PLGA (Be# = 23), high voltage = 25 kV and needle tip to collector distance = 18 cm as shown in Figure 5 (Exp. 3 and 11). A spindle like beads and uniform fibers were collected at the increase of 28% concentration of PLGA (Be# = 29.3), high voltage = 25 kV and needle tip to collector distance = 18 cm as shown in Figure 5 (Exp. 4 and 12). As Berry’s numbers increases (Be# = 31.4) beads on the electrospun fibers were disappeared and more uniform fibers were formed (see Exp. 18). The average fiber diameter increased as the polymer concentration and applied electrostatic field intensity increased, which is consistent with previous results listed in literature.56–58 The average fiber diameters values were exploited in the forthcoming statistical analysis.
Development of mathematical model equation and adequacy of the model
Twenty-seven experiments were designed by using CCD for regression analysis of four parameters at five levels based on RSM (Table 2). Based on coded variables the mathematical equation of the best-fitted models to the data set can be expressed as presented in equation (5).
Analysis of variance (ANOVA) of the response surface mathematical model for PLGA nanofiber diameter.

As presented in Table 4, p values lower than .05 indicate that terms of the model is significant, while p values higher than .05 mean that they are not significant. Implementing an optimization inquiry applying ANOVA analysis on concerning results confirmed that the model terms,
The best fit of the developed model can be specified from the not significant lack of fit value, as obtained from results of Table 4. The F value of 22.69 exhibits that the developed model was significant for the diameter of PLGA nanofiber and there was only a 0.01% chance that “Models’ F value” occurs due to noise. The R2 value of the model for the diameter of PLGA nanofibers is concerned at 0.9636. Furthermore, the adjusted R2 value is concerned 0.9211. The results exposed that model is strongly significant.
Influence of electrospinning factors on the response
The data recorded in Table 4 demonstrate that the coefficients of three independent variables X1, X2,X3, one interactive cross-product coefficient of X1X2, and one quadratic term coefficient of X1^2 with p-value < .05, significantly impact the average fiber diameter, whereas the other coefficient terms have insignificant impact. Based on the ANOVA results (Table 4) and main effect plots (Figure 6(a)), PLGA concentration is the most significant effect on the fiber diameter. With increasing the PLGA concentration in electrospinning solution, the fiber diameter rises. As a result, Increased polymer concentration leads to increased viscoelastic force, which leads to larger diameter polymer fibers, according to the literature.62,63 Main effect plots for fabrication of PLGA nanofibers as a function of PLGA concentration (a), high voltage (b), distance (c), and spinning angle (d).
There is a weaker relationship between high voltage and fiber diameter, with a moderately increasing trend (Figure 6(b)). Furthermore, tip-to-collector distance and spinning angle had only a mild effect on PLGA fiber diameter (Figure 6(c)) and (Figure 6(d)), respectively.
Figure 7(a) presents the interactive impacts of PLGA concentration and high voltage on average fibers diameter note that these variables are the most significant factors affecting the diameter of the fibers. Moreover, PLGA concentration has the farthest important role in electrospun PLGA fibers diameter by enhancing the PLGA concentration from 22 to 30 wt%, the average diameter of the fibers increments from 215 nm to 505 nm. Response surface plot for the effects of (a) high voltage and PLGA concentration, (b) tip to collector distance and PLGA concentration.
Figure 7(b) shows the 3D plot of average diameter of electrospun nanofibers at varied polymer concentrations and nozzle-collector distances. Increases in distance result in finer fiber diameter at lower concentrations, but thicker fiber diameter at higher concentrations. Furthermore, raising the polymer concentration increases the nanofiber diameter at any given distance.
Artificial neural network prediction results
Several ANNs with single and double hidden layers with different number of cells for each were trained using Neuro Solutions software. 35 Among the tried ANNs structures, the ANN of structure 4-14-1 has the minimum coefficient of determination (R2) which is 0.945, Table 2. The values of the experimental results were plotted against the ANN’s predicted one, Figure 5(b). All the training data set were perfect modeled with zero error, while all the errors in the validation and the test sets were less than 10%, most of them (70%) less than 5%. The results in Table 2 revealed that, the average absolute relative error for predicting PLGA nanofibers’ diameter using ANN (2.24%) is slightly less than that obtained from RSM (2.59%). This indicated that, the electrospun PLGA nanofibers’ diameter was modeled by ANN with a very good manner.
Sensitivity analysis test for fiber diameter model.


Fiber diameter vernation for varied inputs (a) Concentration (wt. %), (b) High voltage (KV), (c) Tip to collector distance (cm) and (d) Spinning angle (º).
Validation of experimental and model predictions
Comparison between the average diameter of PLGA nanofibers acquired from experiments with the average diameter predicted by the RSM and ANN models as shown in Figure 9. Figure 9(a) show the predicted against experimental values of the fiber diameters by a diagonal line indicating a random uniform scatter of all the points having a linear correlation.
46
There was a strong correlation between the actual and ANN computed results in the Figure 9(b).64,65 The figure demonstrating that network topology of 4-14-1 provides good prediction for analyzing parameters affecting on fiber diameter. Predicted against experimental values of average fiber diameter. (a) RMS, (b)ANN.
Validation study of RSM and ANN models using optimal combination of electrospinning variables.

Conclusions
In this current study, the impact of electrospinning process variables on the diameter of PLGA nanofibers were studied using RSM and ANN statistical models. The main conclusions and findings of this research can be summarized as follows. 1. The diameter of PLGA nanofiber has been modeled by RSM and ANNs methods. 2. The solution concentration, high voltage and needle tip to collector distance were found to be significant parameters in the minimization of PLGA nanofibers diameter. 3. The ANN of structure 4–14-1 has the minimum coefficient of determination (R2) of 0.945. 4. All the training data set were perfect modeled with zero error, while all the errors in the validation and the test sets were less than 10%, most of them (70%) less than 5%. 5. The average absolute relative error for predicting PLGA nanofibers’ diameter using ANN (2.24%) is slightly less than that obtained from RSM (2.59%). Therefore, the technique of ANNs can be efficiently used to predict the electrospun PLGA nanofibers’ diameter. 6. The Optimum combinations of experimental parameters for the PLGA fiber diameter predicted by RSM model were 26 wt% PLGA concentration, high voltage (22 kV), needle tip to collector distance (20 cm), and spinning angle (60°). 7. Future biological applications, such as the treatment of burn pain or hyperplastic scarring, have been discovered to benefit from the use of PLGA nanofibers.
Footnotes
Declaration of conflicting interests
The author(s) declared no potential conflicts of interest with respect to the research, authorship, and/or publication of this article.
Funding
The author(s) received no financial support for the research, authorship, and/or publication of this article.