
Abstract
This paper focuses on using response surface methodology (RSM) and artificial neural network (ANN) to optimize the diameter of Gum tragacanth (GT)/poly(vinyl alcohol) (PVA) nanofibers. However, producing curcumin-loaded GT/PVA nanofibers with using these optimized conditions is another aim. RSM methodology based on four variables (voltage, feed rate, distance between nozzle and collector, and solution concentration) with three levels and ANN technique were compared for modeling the average diameter of nanofibers. In the RSM method, the individual and interaction effects between the parameters on the average diameter of nanofibers were determined using Box-Behnken design (BBD). Data sets of input–output patterns were used for training the multilayer perceptron (MP) neural networks trained with back-propagation algorithm for modeling purpose. Experimental results for both ANN and RSM techniques showed agreement with the predicted fiber diameter. High-regression coefficient between the variables and the response displayed that the performance of RSM for minimizing diameter of nanofibers was better than ANN. Based on response surface model, optimum conditions (polymer concentration of 4.2% (w/v), distance between the capillary and collector 20 cm, applied voltage of 20 kV and flow rate of 0.5 mL/h) were obtained for producing GT/PVA nanofibers with minimized diameter. Then curcumin-loaded GT/PVA nanofibers were produced with acquired optimum condition and the effect of curcumin concentration (3 and 5% (w/v)) on the morphology, diameter and biological properties of nanofibers was investigated.
Keywords
Introduction
Recently, many researches have been conducted using polymeric biomaterials for the fabrication of porous 3D-structure nanofibers due to mimicking the size scales of fibers from extracellular matrix (ECM) which compose the native tissue and organs. Electrospinning is a unique technique which allows the design and modification of suitable nanoscale biomaterials for having better cell migration, proliferation, and differentiation on the injured site and subsequent tissue regeneration [1–3]. Nowadays, systematic investigations about the effect of electrospinning variables on the diameter and morphology of electrospun fibers are of great interest [4,5]. The diameter of nanofibers is affected by numerous parameters such as polymer type and its molecular weight, polymer concentration, solvent type and polymer solution properties (viscosity, conductivity, and surface tension); process parameters such as electric potential or voltage, flow rate of polymer solution, distance between the capillary and collector and other parameters (temperature, humidity, and air velocity) [6–8]. Therefore, it is necessary to select the parameters that have major effects on the diameter and morphology of nanofibers. Fabricating ultra thin nanofibers from several polymers and polymer blends has been studied using the electrospinning technique. Response surface methodology (RSM) is a mathematical technique for designing experiments, building models, evaluating the effects of several factors, and achieving the optimum conditions for desirable responses with a limited number of planned experiments where the response of interest is influenced by several variables and the aim is minimizing the response [9–13]. The main advantage of RSM is its ability to exhibit the factor contributions from the coefficients in the regression model. This ability is powerful in identifying the insignificant main parameters and interaction factors or insignificant quadratic terms in the model. The modeling using RSM has a lower-order non-linear behavior with a regular experimental domain and relatively small factors region, due to its limitation in building a model to fit the data over an irregular experimental region. Recently, several studies have been carried out to minimize the diameter of electrospun nanofiber with RSM [14–17]. Sukigara et al. [18,19] used RSM to study the effect of electrospinning parameters such as applied voltage, distance between nozzle and collector and solution concentration on the morphology and diameter of regenerated silk nanofibers. They concluded that concentration was the most important parameter for producing uniform cylindrical nanofibers.
When highly non-linear behavior is favorable, artificial neural networks (ANNs) perform modeling and optimizing better than the other techniques using small number of experiments without creating an equation [20]. ANNs which are simplified models of the biological neuron system simulate the processing manner of information in human brain and have been presented as promising ways in dealing with non-linear and complex relations [21,22]. Insights into using ANNs models in investigating electrospinning processes is determined by Sarkar et al. [23]. They used ANNs for studying the diameter of electrospun nanofibers with changing input variables such as concentration of the solution, electrical conductivity, flow rate, and strength of the electric field. The results of the computer model indicated satisfactory viability for the neural network to predict the diameter of the nanofibers. Faridi-Majidi and coworkers [24] used from ANNs to determine parameters controlling the diameter of nanofibers produced from nylon-6,6. Their results showed that the flow rate and polymer concentration were important factors in diameter optimization.
Gum tragacanth (GT) is an anionic polysaccharide which is exuded from the trunk of some species of Astragalus. It is categorized as generally recognized as safe (GRAS) material at a level of 0.2–1.3% in food stuffs [25]. GT besides other synthetic polymers has been used for application in skin regeneration, drug carrier applications, and periodontal defect regeneration [26,27]. Poly(vinyl alcohol) (PVA) is water soluble, semi-crystalline, fully biodegradable, nontoxic, and biocompatible, and therefore it finds use in a broad spectrum of applications such as biomedical fields [28]. The natural curcumin, a polyphenolic pigment isolated from the dry rhizomes of Curcuma longa (turmeric), has found uses in traditional medicine for the treatment of skin diseases, wound healing, abdominal spasms and inflammation because of its excellent biological and biocompatible properties [29,30].
In this study, for the first time in literature, we aimed towards the fabrication of curcumin loaded composite scaffolds from GT/PVA with minimized diameter. At first, the effects of solution concentration, applied voltage, feed rate, collector distance, their individual and interactive effects on the diameter of GT/PVA nanofibers were studied by RSM and ANN method for producing nanofiber with minimized diameter. Then, curcumin-loaded GT/PVA (GT/PVA/Cur) nanofibers with using optimized condition were fabricated. GT/PVA/Cur nanofibers were analyzed for biocompatibility and cell culture behavior. These nanofibers can be good candidate for carcinoma, healing hyperplastic scar, or burn pain treatment.
Experimental part
Materials
At first, for finding the best kind of gum tragacanth (GT) with spinning capability, we chose four different species of gum tragacanth exuded by Astragalus fluccosus, Astragalus rahensis, Astragalus gossypinus and Astragalus microcephalus which were collected from plants growing in different provinces of Iran with high-quality ribbon type. The raw gum was grounded into a fine powder. Based on the solubility and electrospinability behavior of the gums, A. fluccosus was selected as the suitable polymer for producing nanofibers for modeling and further experiments. Poly(vinyl alcohol) (PVA) (Mw = 94–120 k Da) and curcumin were purchased from MERK, Co. All other chemicals in this experiment were analytical grade and used without any further treatment.
Electrospining process
Known amounts of GT was dissolved in deionized water and stirred for 8 h. PVA was added to the solutions (total concentration of solution was 5% (wt)) and stirred for 12 h. The solutions were fed into a 20 mL plastic syringe fitted with a needle (19G). The feeding rate of the syringe pump changed from 0.5 to 2.5 mL/h. High voltage in the range of 10–20 kV was applied using a power supply. GT/PVA electrospun nanofibers were deposited and collected on the collector plate with the distance of 10–20 cm from the needle tip. The results obtained from electrospinning are reported elsewhere [31]. After finding an optimum condition for electrospinning, curcumin-loaded GT/PVA nanofibers (PVA/GT/cur) with 3 and 5% (wt) of curcumin were prepared. For improving the stability of the nanofibers, cross-linking was done in a desiccator containing saturated glutaraldehyde vapors for two days. Then the scaffolds were kept in a fume hood overnight and vacuum dried for three days before being used for cell culture and other studies.
Characterization
The morphology of the electrospun nanofibers was assessed by scanning electron microscope (SEM, AIS-2100, Seron, Korea) at an accelerating voltage of 25 kV under magnification of 15,000× and the average diameter of fibers was measured with the SEM images using Image J software (National Institute of Health, USA) from 100 fibers samples.
Experimental design and data analysis
Response surface methodology

Experimental range and levels of independent variables for diameter of GT/PVA nanofibers.

The typical response surface model equation for four input variables can be proposed as (equation (2))

A given mathematical model can be acceptable when its ANOVA reaches high statistical significance, with F values at a level of confidence of 95% and p-values <0.05. So, the analysis of variance (ANOVA) and R2 were used to check the adequacy of the developed model. The responses, model regression, plotted figures, and optimization analyses of variance (ANOVA) were assessed using Minitab 16.1.0.0 Statistical software (Minitab Inc., State College, PA, USA).
Artificial neural network
In this paper, multilayer perceptron ANN with one hidden layer on the basis of Kolmogorov’s theorem was applied for modelling the diameter of nanofibers [34]. According to this theorem, two-layered back-propagation networks (with one hidden layer) can approximate any function with certain accuracy while non-polynomial transfer function in the hidden layer is used [34]. The transfer function of the hidden layer neurons has been set the hyperbolic tangent sigmoid function (tansig) (equation (4)), while the output layer employed linear transfer function (purelin) (equation (5)) [35]. The input layer has four nodes, including voltage, distance between nozzle and collector, concentration and flow rate.


The experimental data were divided into two groups of training and test sample. All calculations were carried out in Matlab mathematical software (version 7.6) with ANN toolbox. To determine the optimum number of neurons in hidden layer, a series of topologies were used in which the number of neuron varied from 2 to 10. Each topology was repeated three times to avoid random correlation due to random initialization of the weights and bias. The optimal architecture of the ANN model and its parameter variation were determined based on the minimum value of the mean square error (MSE) of the training and testing sets which had been calculated from (equation (6)) where N is the number of the patterns, P, the index number for patterns, tp the target value for the pth pattern, Op the output of the pth pattern, and ep the difference between tp and op.
Biological tests
Cell Morphology studies
GT/PVA/cur nanofibrous mats were sterilized by UV-ray and then washed with sterilized phosphate buffer saline (PBS) for three times. Then the scaffolds were immersed in a culture medium for 12 h. Cell culture was done according to ASTM-F813 and NIH 3T3 cells were cultured in Dulbecco’s Modified Eagle Medium (DMEM) (Gibco, USA) supplemented by 10% fetal bovine serum (FBS), 1% antibiotic solution at 37℃ under a humidified atmosphere of 5% CO2, 99% relative humidity (RH). About 5×10³ cells/cm2, fibroblast cells were seeded on GT/PVA and curcumin loaded GT/PVA nanofibers on 12 well plates and incubated for facilitating cell growth. The cell-seeded nanofibers were refilled with fresh medium every day. After 48 h of the experiment, the scaffold was rinsed twice with PBS, fixed in 2.5% glutaraldehyde for 2 h and subsequently was washed thrice with PBS for 12 h. Then the sample was immersed in osmium tetroxide 0.1% for 30 min and dehydrated in increasing concentrations of acetone (20, 30, 50, 70, 90, and 100%) for 10 min each. Finally, the samples were freeze-dried and sputter coated with gold for cell morphology observation by field emission scanning electron microscopy (FESEM).
Proliferation test
Cell viability and cell proliferation on GT/PVA/cur membrane was done by using the colorimetric 3-(4, 5-dimethylthiazol-2-yl)-2, 5-diphenyltetrazolium bromide assay (MTT). Fresh culture medium was used as negative control. Human fibroblast cells were plated in 90 µL of Dulbecco’s modified Eagle’s medium (DMEM), 10% FBS, at a density of 10,000 cells/cm2. After three days of cell seeding in a 24-well plate, the original medium was removed and 1 mL fresh medium and 100 µL MTT solution were added to each well. Cells were allowed to incubate at 37 ℃ (5% CO2) for 4 h. After removing media, the scaffolds were gently aspirated, and the formazan reaction products were dissolved in dimethyl sulfoxide (DMSO) and the plates were shaken for 20 min. The solution was used for spectrophotometric analysis. The optical density of the formazan solution was read on an ELISA plate reader at 570 nm.
Results and discussion
Effect of GT species on the morphology of nanofiber
Gum tragacanth is hard, odorless, and its color varies from white to brownish yellow in different species. The viscosity of gum tragacanth is highly dependent on concentration. The more concentrated the solution, the more viscous it is. It has been reported that gum tragacanth from different species of Astragalus has different ratios of the two fractions, different chemical compositions and also varying physicochemical properties [36]. The sugar compositional analysis of gum tragacanth from different species of Astragalus showed different values for each of the sugar components and different functional properties. So, different physicochemical and rheological properties of four species of gum tragacanth affect electrospining properties of GT/PVA solution. It seems that increasing the solution part in GT composition could result in surface tension decreasing and production of nanofibers with best morphology. Hence, Table 2 shows produced nanofibers from A. fluccosus with more ratios of water soluble component had smooth and uniform nanofibers and was selected for further experiments (Figure 1).
SEM images of different species of GT with PVA. (a) A. gossypinus, (b) A. microcephalus, (c) A. rahensis, (d) A. fluccosus, electrospun at d = 15 cm, V = 15 KV, flow rate = 0.5 mL/h 15,000×, 6 w/v%, 40/60 w/v% (GT/PVA). Chemical composition of tragacanth, tragacanthin and bassorin reported in previous investigations [36].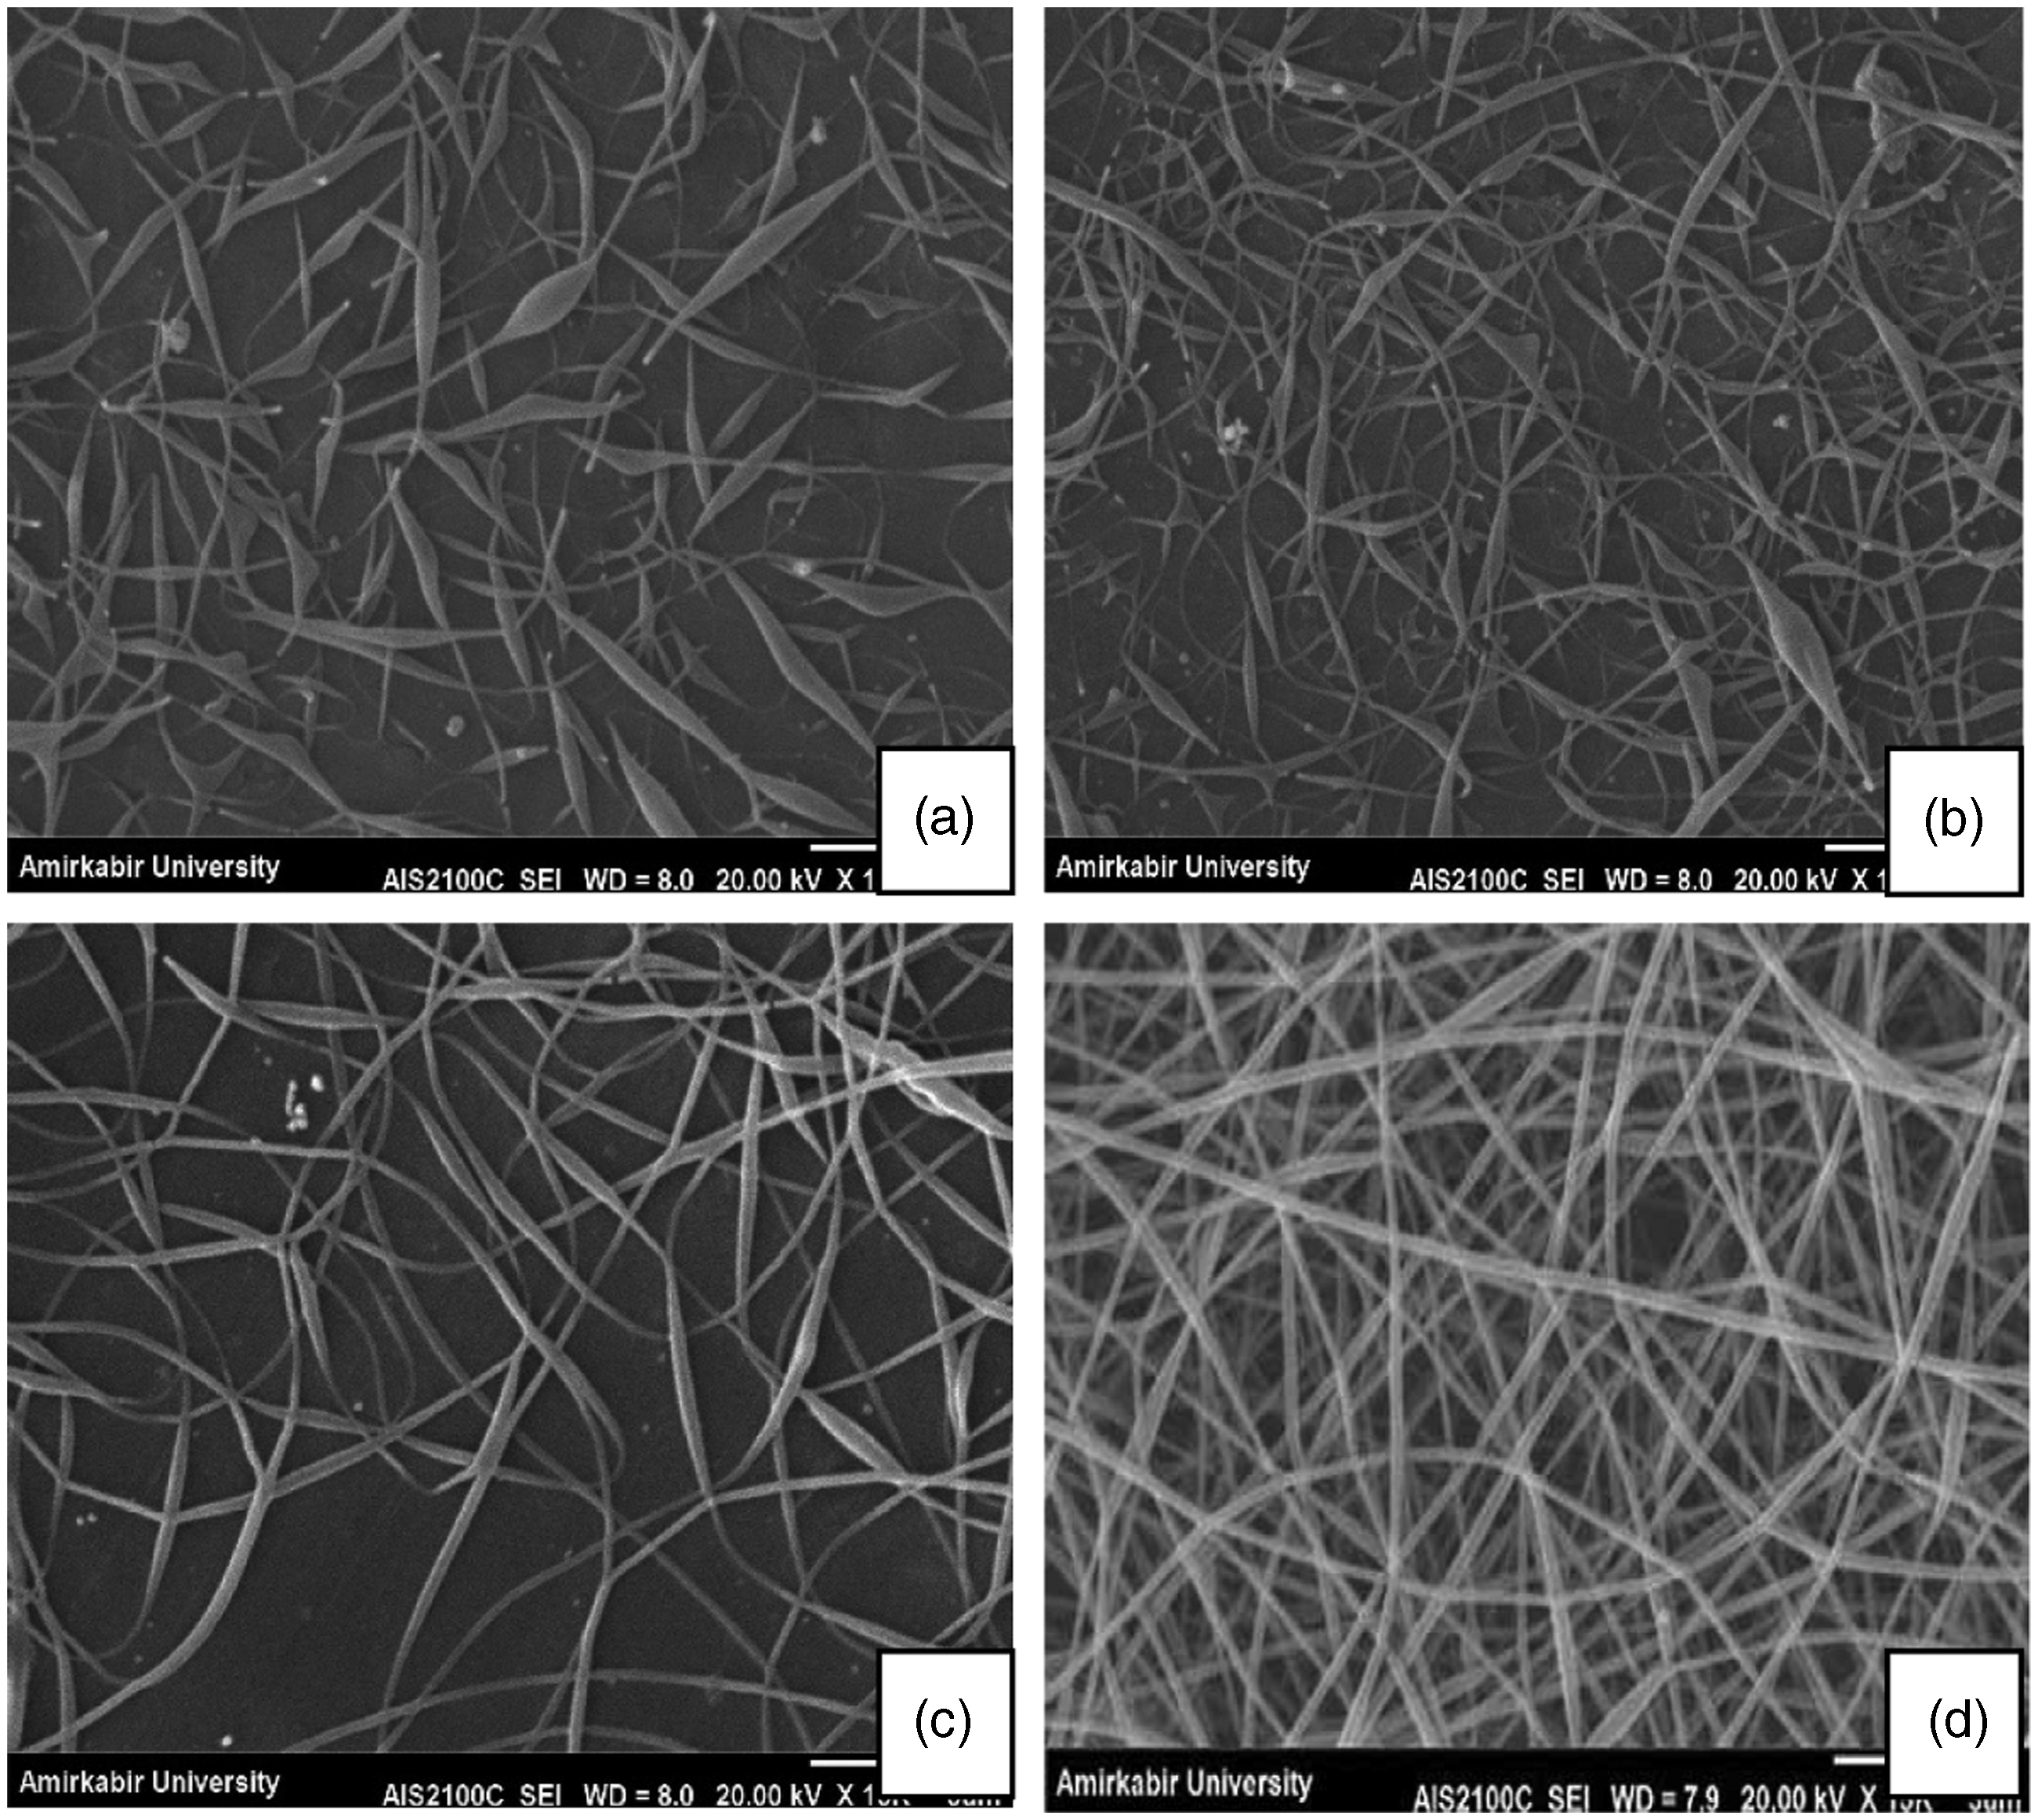

Development of regression model equation and validation of the model
Responses of dependent variables for the diameter average of GT/PVA nanofibers.


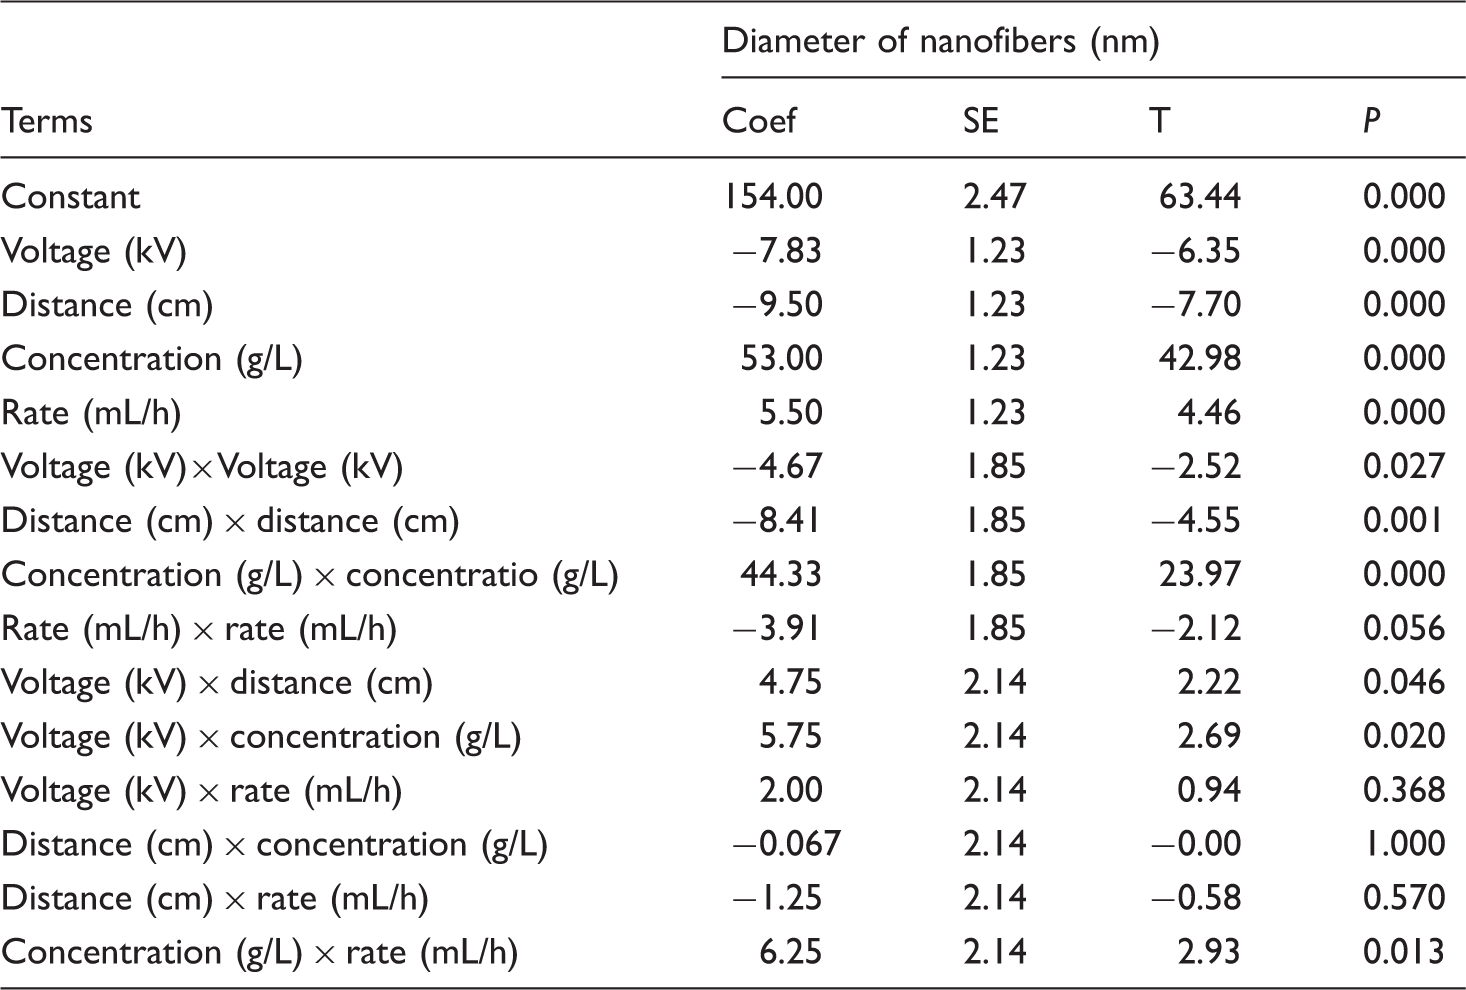
Estimated regression coefficients for diameter of nanofibers in coded units.
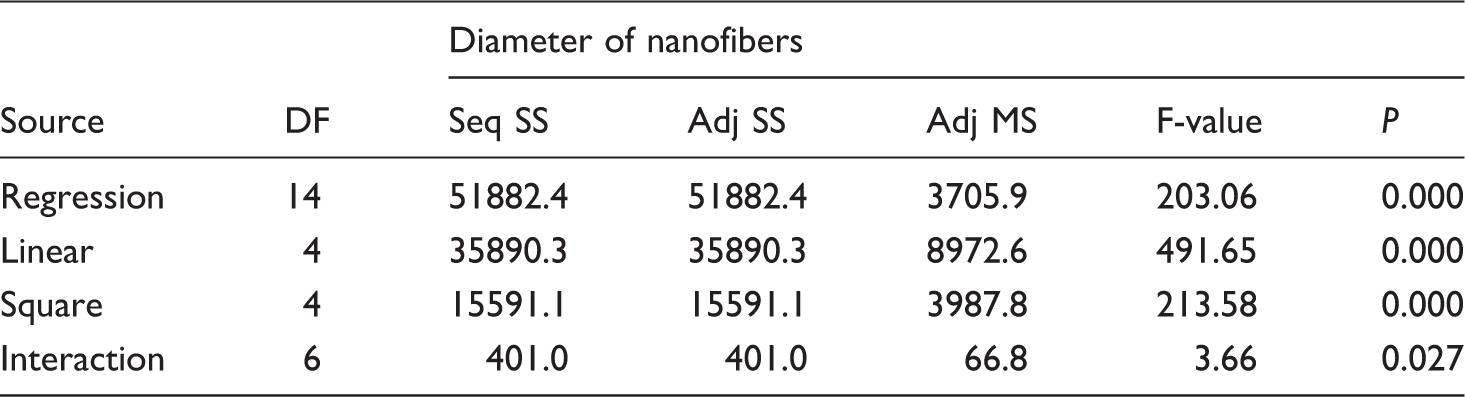
ANOVA for diameter of GT/PVA nanofibers.
Artificial neural networks results
The advantages that artificial neural network (ANNs) offer are numerous and achievable only by developing an ANN model with high performance. However, determining the suitable training and architectural parameters of an ANN still remains a difficult task. These parameters are typically determined in trial and error procedure, where a large number of ANN models are developed and compared to one another. In this study, we used a two-layered perceptron neural network (with six artificial neurons in hidden layer) for modeling of GT/PVA nanofiber diameter (Figure 2).
Optimized two-layer perceptron neural network structure.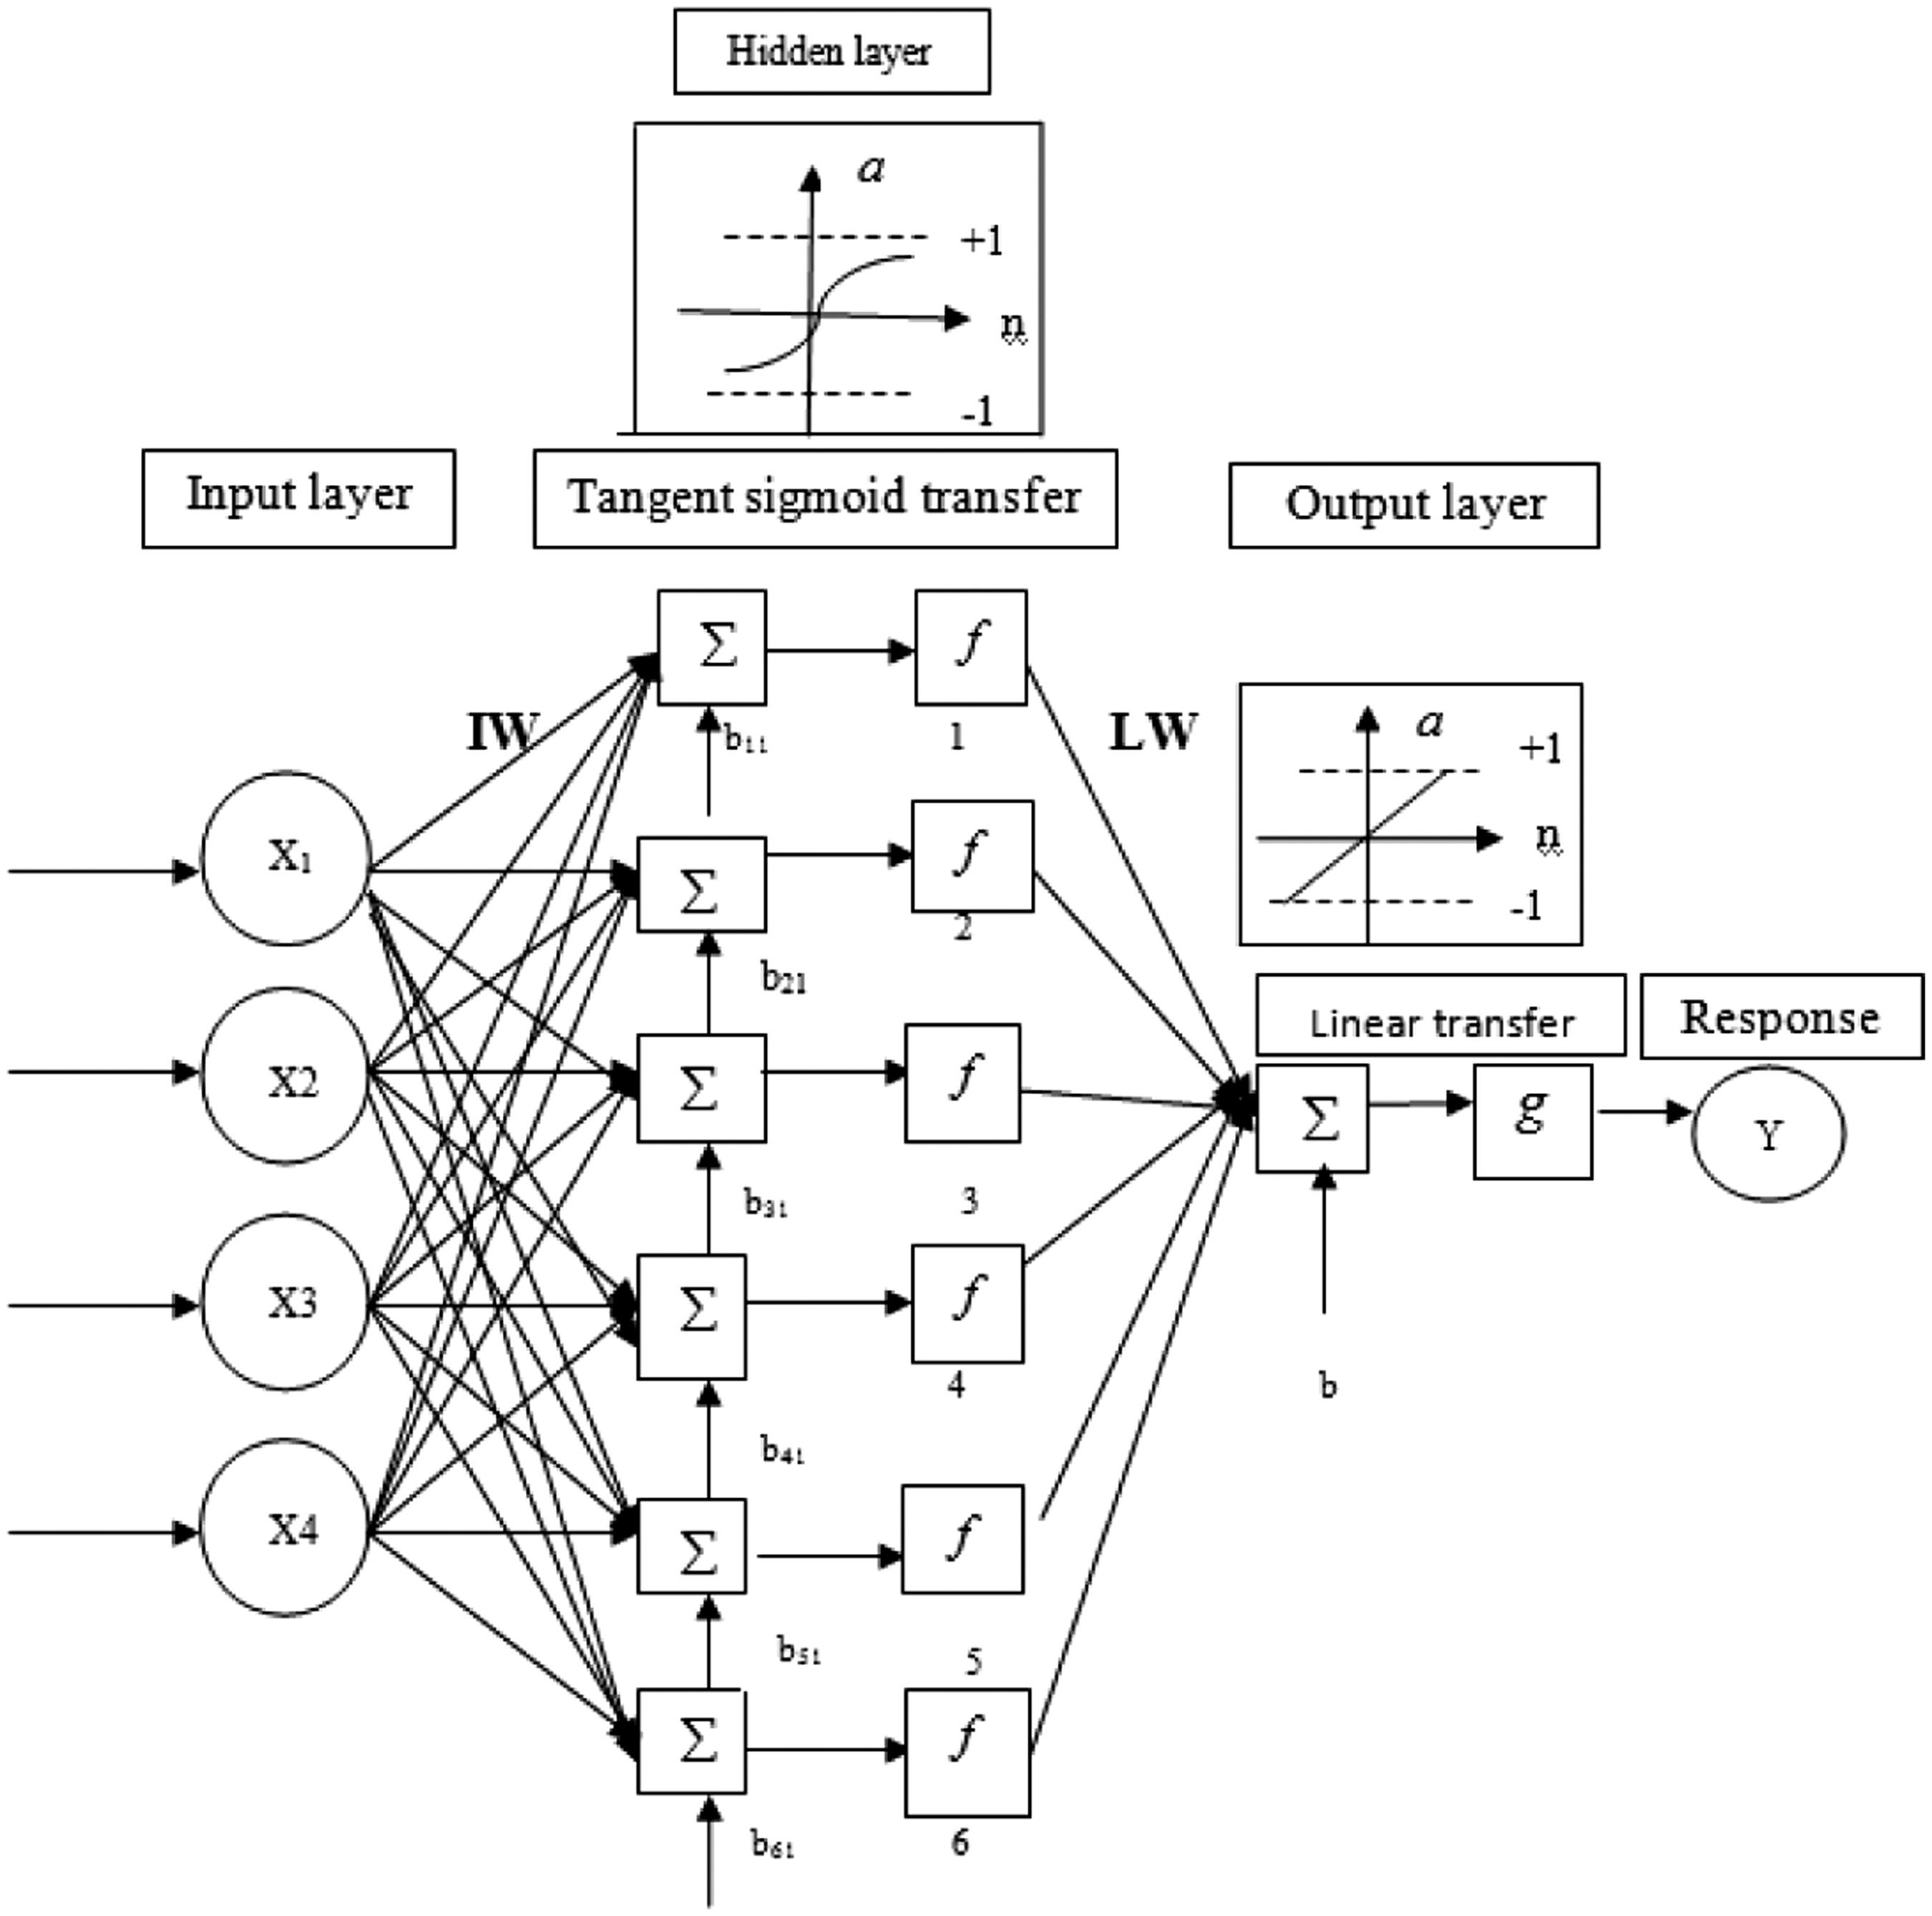
The mean square error (MSE) of the training and prediction set was used for determination of optimal architecture of the ANN model and its parameter variation. Figure 3 indicates the dependence between the neuron number and MSE in the hidden layer. In optimization of the neural network, two neurons were used in the hidden layer as an initial estimate. With four hidden neurons, the MSE decreased significantly. With a further increase in the number of neurons from 4 to 5, a gradual decrease was observed in the MSE. With six hidden neurons, the MSE reached its minimum value. Hence, the neural network containing six hidden neurons was chosen as the best case. The weights and the bias of ANN for the diameter of electrospun nanofiber are given in Table 6. The R2 value was 0.971, which demonstrates that the ANN predicts the diameter of GT/PVA nanofibers well compared with the experimental data.
Effect of the number of neurons in hidden layer on the performance of the ANN. Weights and bias obtained in training ANN.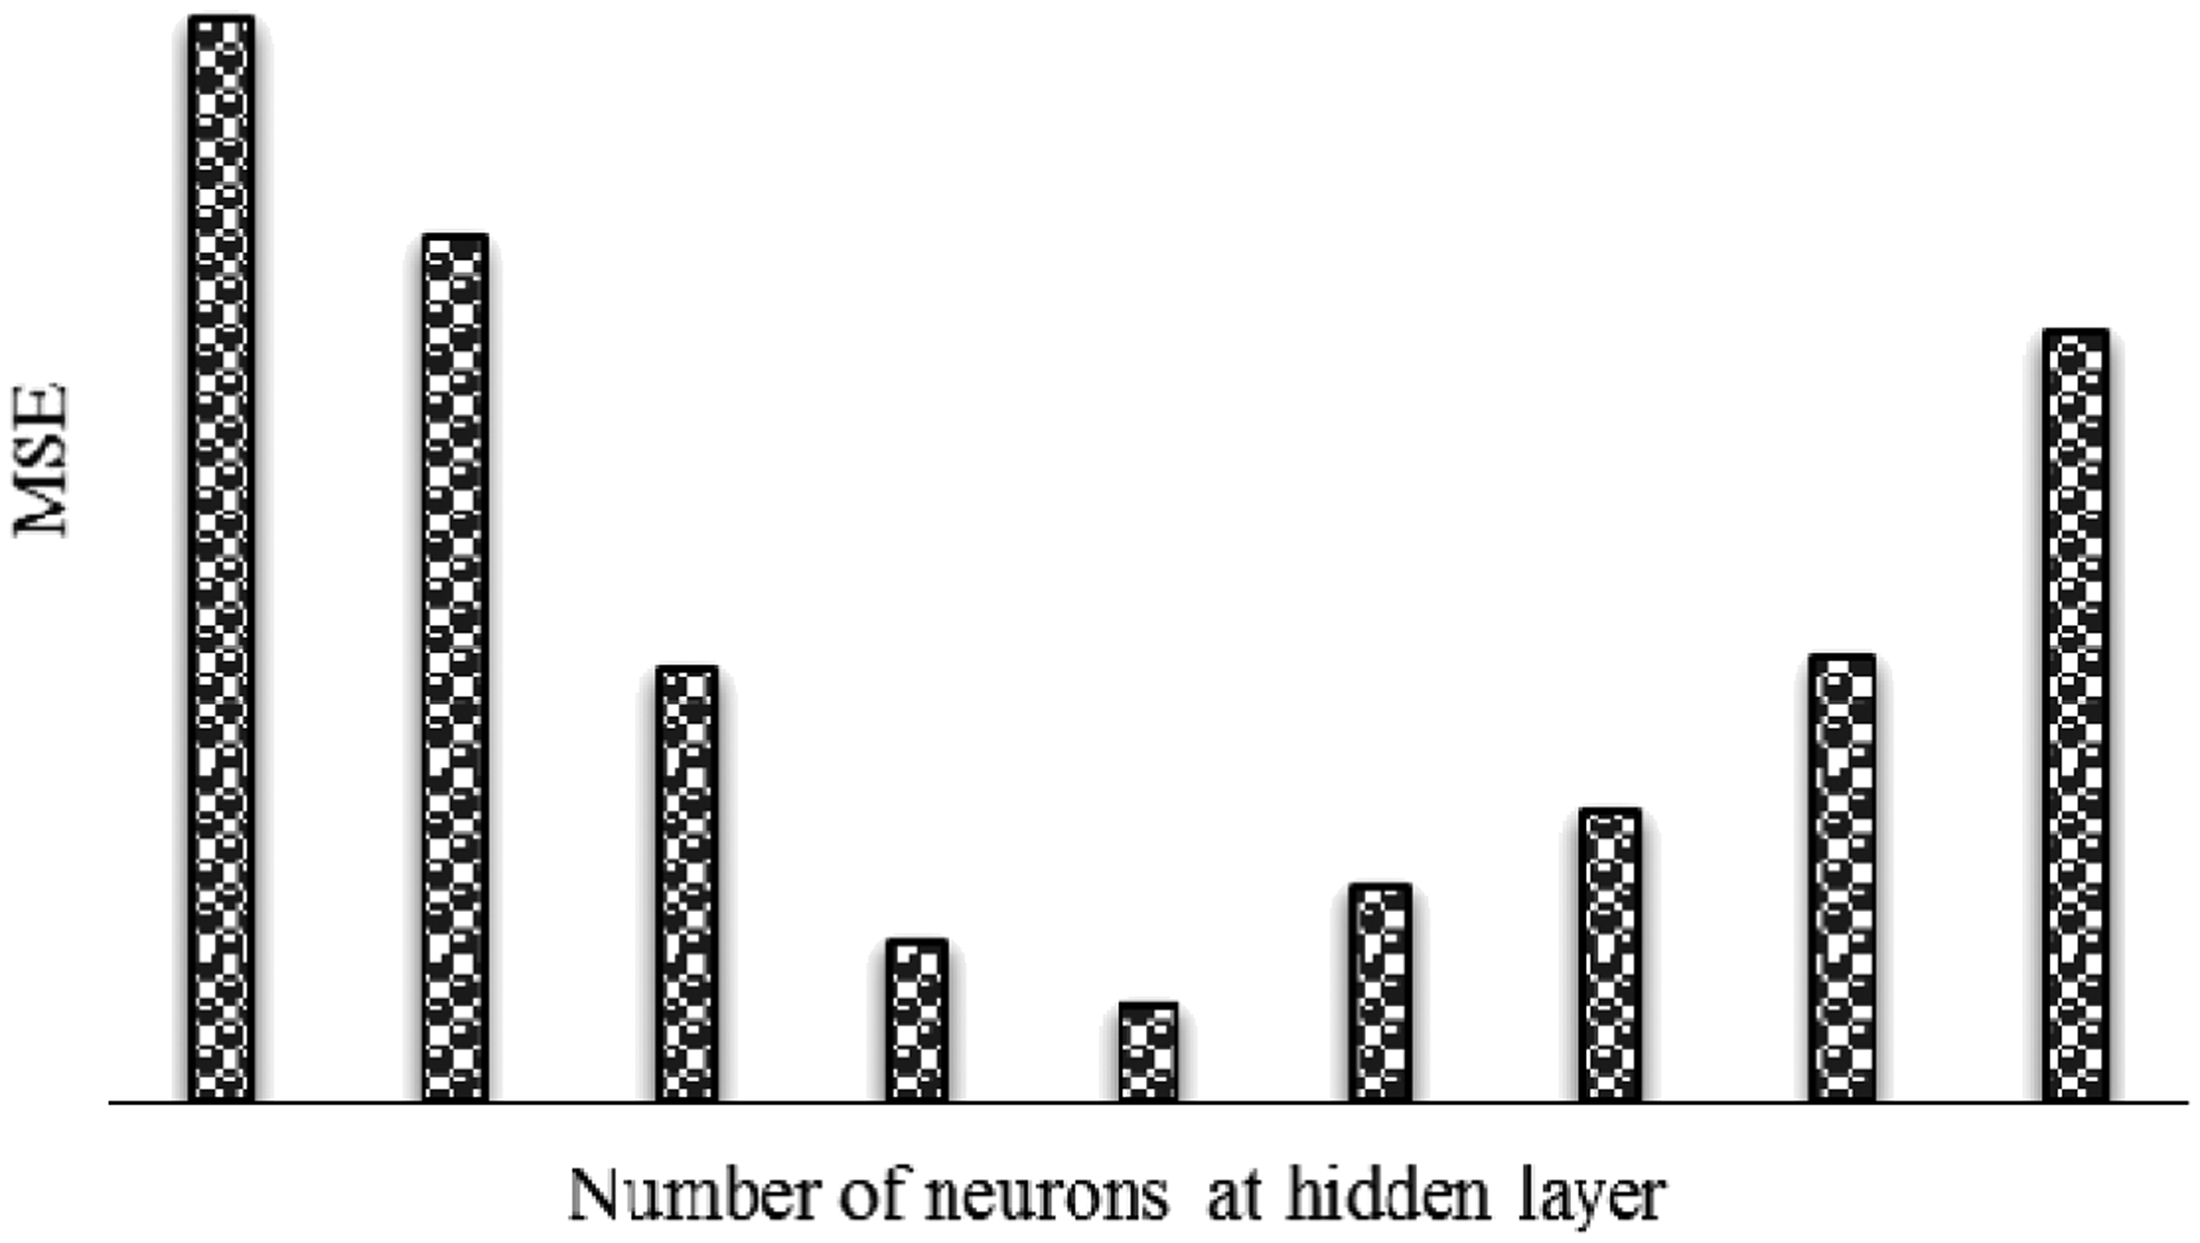

Effects of significant parameters on response
Nanofibers have a high surface area to volume ratio, which increases the interest of these structures for biomedical applications. The properties of the obtained nanofibers depend on various parameters [37]. For a better explanation of the independent variables, the main effect of different parameters on the diameter of GT/PVA nanofibers is shown in Figure 4. As illustrated in Figure 4, increasing applied voltage and distance will decrease the diameter of GT/PVA nanofibers. An increase in the distance between the needle and the collector may break the formed jet into two or more jets and production of finer fibers [38]. A decrease in diameter of nanofibers with increasing applied voltage is thought to be a result of secondary jets during electrospinning or more stretching of polymer chains [39]. Decreasing the polymer concentration and feed rate reduced the diameter of GT/PVA nanofiber. Three-dimensional surface graphs and contour surface plots of the GT/PVA nanofiber diameter (nm) for the experimental factors (voltage, distance, concentration, and feed rate) are also presented in Figure 6 and Figure 5, respectively.
Main effect plots of parameters on mean diameter of nanofibers. Surface plots as a function of: (a) voltage and concentration, (b) distance and voltage, (c) feed rate and concentration. Hold values: (voltage 15 kV, distance 15 cm, concentration 6 g/L, and feed rate 0.5 mL/h). Relative importance of input variables on the value of electrospun fiber diameter.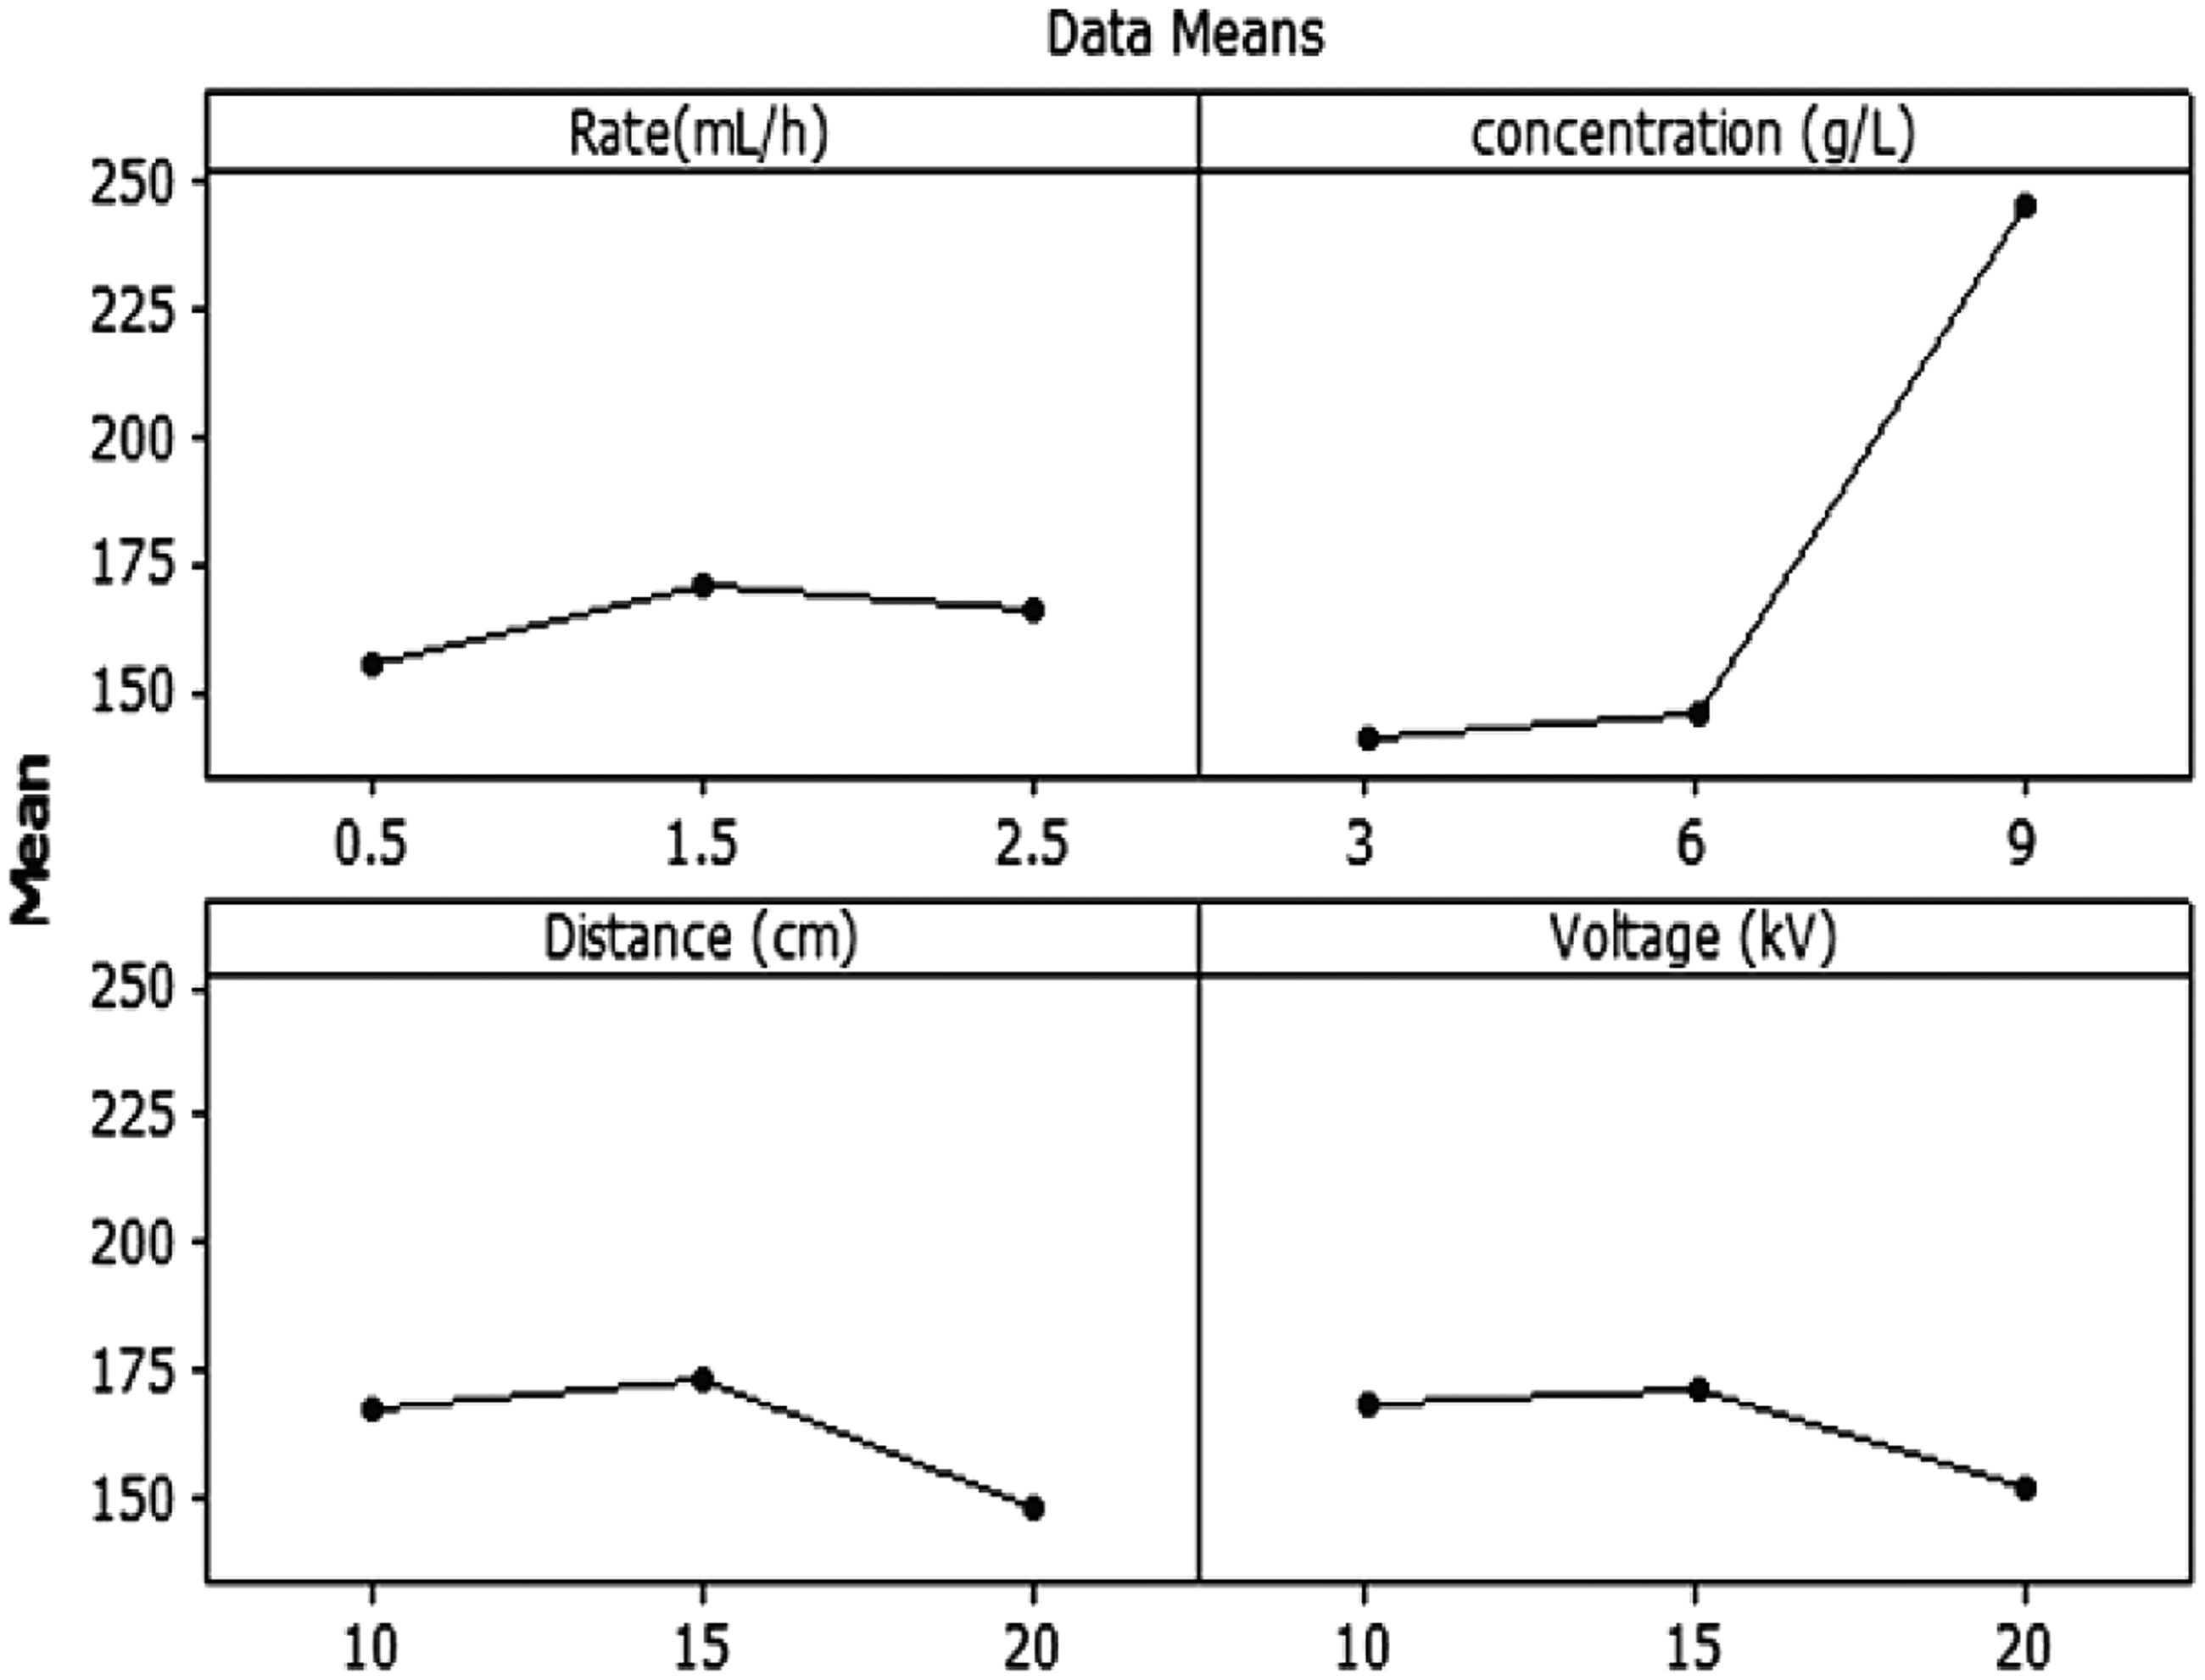


Figure 5 shows the estimated three-dimensional surface plots for diameter of nanofibers as a function of the independent parameters. In the figures, two of the four independent variables are set constant at center points. As it can be seen from Figure 5(a), the diameter of nanofibers increased when the voltage increased from 10 to 16 kV and concentration changes from 3 to 6 g/L and then decreased as the voltage reaches 20 kV and concentration is increased to 9 g/L. According to the results of Figure 5(b), higher voltage and lower distance would be required for higher diameter of nanofibers. In Figure 5(c), with increasing concentration from 3 to 6 g/L and feed rate from 0.4 to 1.4, the diameter of nanofibers increased too, and with increasing feed rate from 1.4 to 2.6, the diameter decreased.
The relative importance (RI) of the various input variables on the output variables has been exhibited by the neural network weight matrix. Equation (8) based on the partitioning of connection weights was proposed for calculating RI value [40] where RIj is the relative importance of the jth input variable on the output variable, Ni and Nh are the numbers of input variables and hidden neurons, respectively, IW and LW are connection weights, and subscript “n” refers to output response. In this work, j = 1, 2, 3 and 4, Ni = 4, Nh = 6, and n = 1.

The relative importance of input variables on the value of average nanofiber diameter as calculated by equation (8) was shown in Figure 6. It is clear that all of the variables (applied voltage, nozzle-collector distance, polymer concentration, and feed rate) have strong effects on the nanofibers average diameter. Therefore, none of the variables studied in this work could have been neglected from the present analysis. However, the polymer concentration and nozzle-collector distance, with relative importance of 52.5% and 20.9%, respectively, appeared to be more influential parameters in nanofiber average diameter. These results are in agreement with the ones obtained from response surface methodology (RSM).
Comparison between ANN and RSM
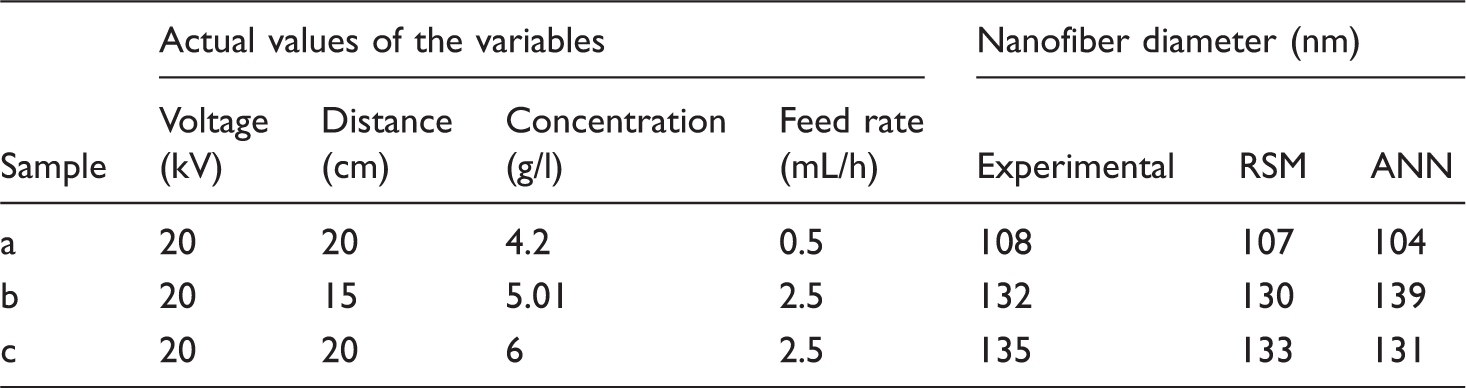
Experimental and predicted values of electrospun fiber diameter by RSM and ANN models.

Though both the models based on RSM and ANN offered stable responses in predicting the combined interactions of the independent variables with respect to the response, the RSM method was better in fitting with the measured response compared to ANN model and showed much lower absolute percentage error than the ANN model. However, it should be noted that both models are reliable.
To evaluate the validation of RSM and ANN, we measured the diameter of nanofibers produced under different conditions and compared it with the predicted data offered by RSM and ANN. For this, three different samples of nanofibers with changing each of the four factors (applied voltage, nozzle collector distance, polymer concentration, and feed rate) were prepared and analyzed using SEM. The diameter of nanofibers and the diameter calculated from RSM and ANN were very close, indicating that this method has favorable accuracy in predicting response (Table 8). Figure 7 shows the nanofiber morphology observed by SEM along with the corresponding histogram of the diameter distribution for nanofibers. According to SEM micrographs of nanofiber, RSM and ANN have proper prediction in new experimental conditions and the mentioned models are acceptable in all space designs.
SEM images of electrospun nanofibers and corresponding fiber diameter distribution. (a–c) are nanofibers from corresponding experiments in Table 8. Validation of RSM and ANN using different levels of polymer concentration, applied voltage, and nozzle-collector distance.
The effect of curcumin on the morphology and diameter of optimized nanofibers
According to the RSM method, optimum conditions (polymer concentration of 4.2% (w/v), distance between the capillary and collector 20 cm, applied voltage of 20 kV and flow rate of 0.5mL/h) were obtained for production of GT/PVA nanofibers and obtained diameter for nanofibers was 103 nm. The predicted value (103 nm) showed only 0.96% difference with experimental results in which the diameter of produced fibers under the same conditions was 104.18 nm. Our next aim in this study was fabricating submicron curcumin loaded GT/PVA nanofibers with aforementioned parameters and investigating about the effect of curcumin on the characteristics of theses mats. So, 3 and 5% (wt) curcumin-loaded GT/PVA solutions were electrospun. SEM images with the corresponding histogram of the nanofiber diameter have been shown in Figure 8. The results showed that with adding 3 (%wt) curcumin and increasing the amount of curcumin from 3% to 5% (wt), the diameter of nanofibers increased to 181±21 and 216±15 nm, respectively, and uniformity increased too. The nanofibers were crosslinked with glutaraldehyde vapor for further analysis.
SEM photograph of (a) electrospun nanofiber mat, (b) nanofibers with 3% (wt) curcumin, (c) nanofibers with 5% (wt) curcumin; (polymer concentration: 4.2 w/v%, nozzle-collector distance: 20 cm, applied voltage: 20 kV and flow rate = 0.5 mL/h).
Cell proliferation
MTT assay was carried out to evaluate the proliferation of fibroblast cells on electrospun GT/PVA, GT/PVA-3% cur, GT/PVA-5% cur scaffolds after 1 and 3 days and the results are shown in Figure 9. All samples as well as TCP showed increasing cell proliferation with increasing culture time from 1 to 3 days. Analysis of cell metabolism revealed that GT/PVA and GT/PVA-3% cur might present a significantly better support for cell attachment, adhesion, and proliferation compared to GT/PVA 5% cur. High concentration curcumin can inhibit effectively the fibroblast proliferation and collagen I synthesis. So, using from 3% curcumin in nanofibers can result in better healing effect with good fibroblast proliferation.
Proliferation of fibroblasts on electrospun nanofibers (GT/PVA, GT/PVA/3% Cur, GT/PVA/5% Cur) measured by MTT assay.
Cell morphology
The interaction between fibroblast cells and electrospun nanofibrous scaffolds (GT/PVA and GT/PVA/3% Cur) were evaluated after three days of cell culture and the results are shown in Figure 10. The cells were found to attach and proliferate well on PCL/GT and PCL/GT/cur nanofibers. The fibroblast cells exhibited stretched morphology on the nanofibers and covered all the surface of nanofibers. Curcumin-loaded nanofibers with anti-inflammation property, antibacterial characteristic and excellent biological behavior could be suitable in healing of inflectional wounds.
Scanning electron micrographs of fibroblasts on electrospun GT/PVA and GT/PVA/3% Cur nanofibers after three days of culture.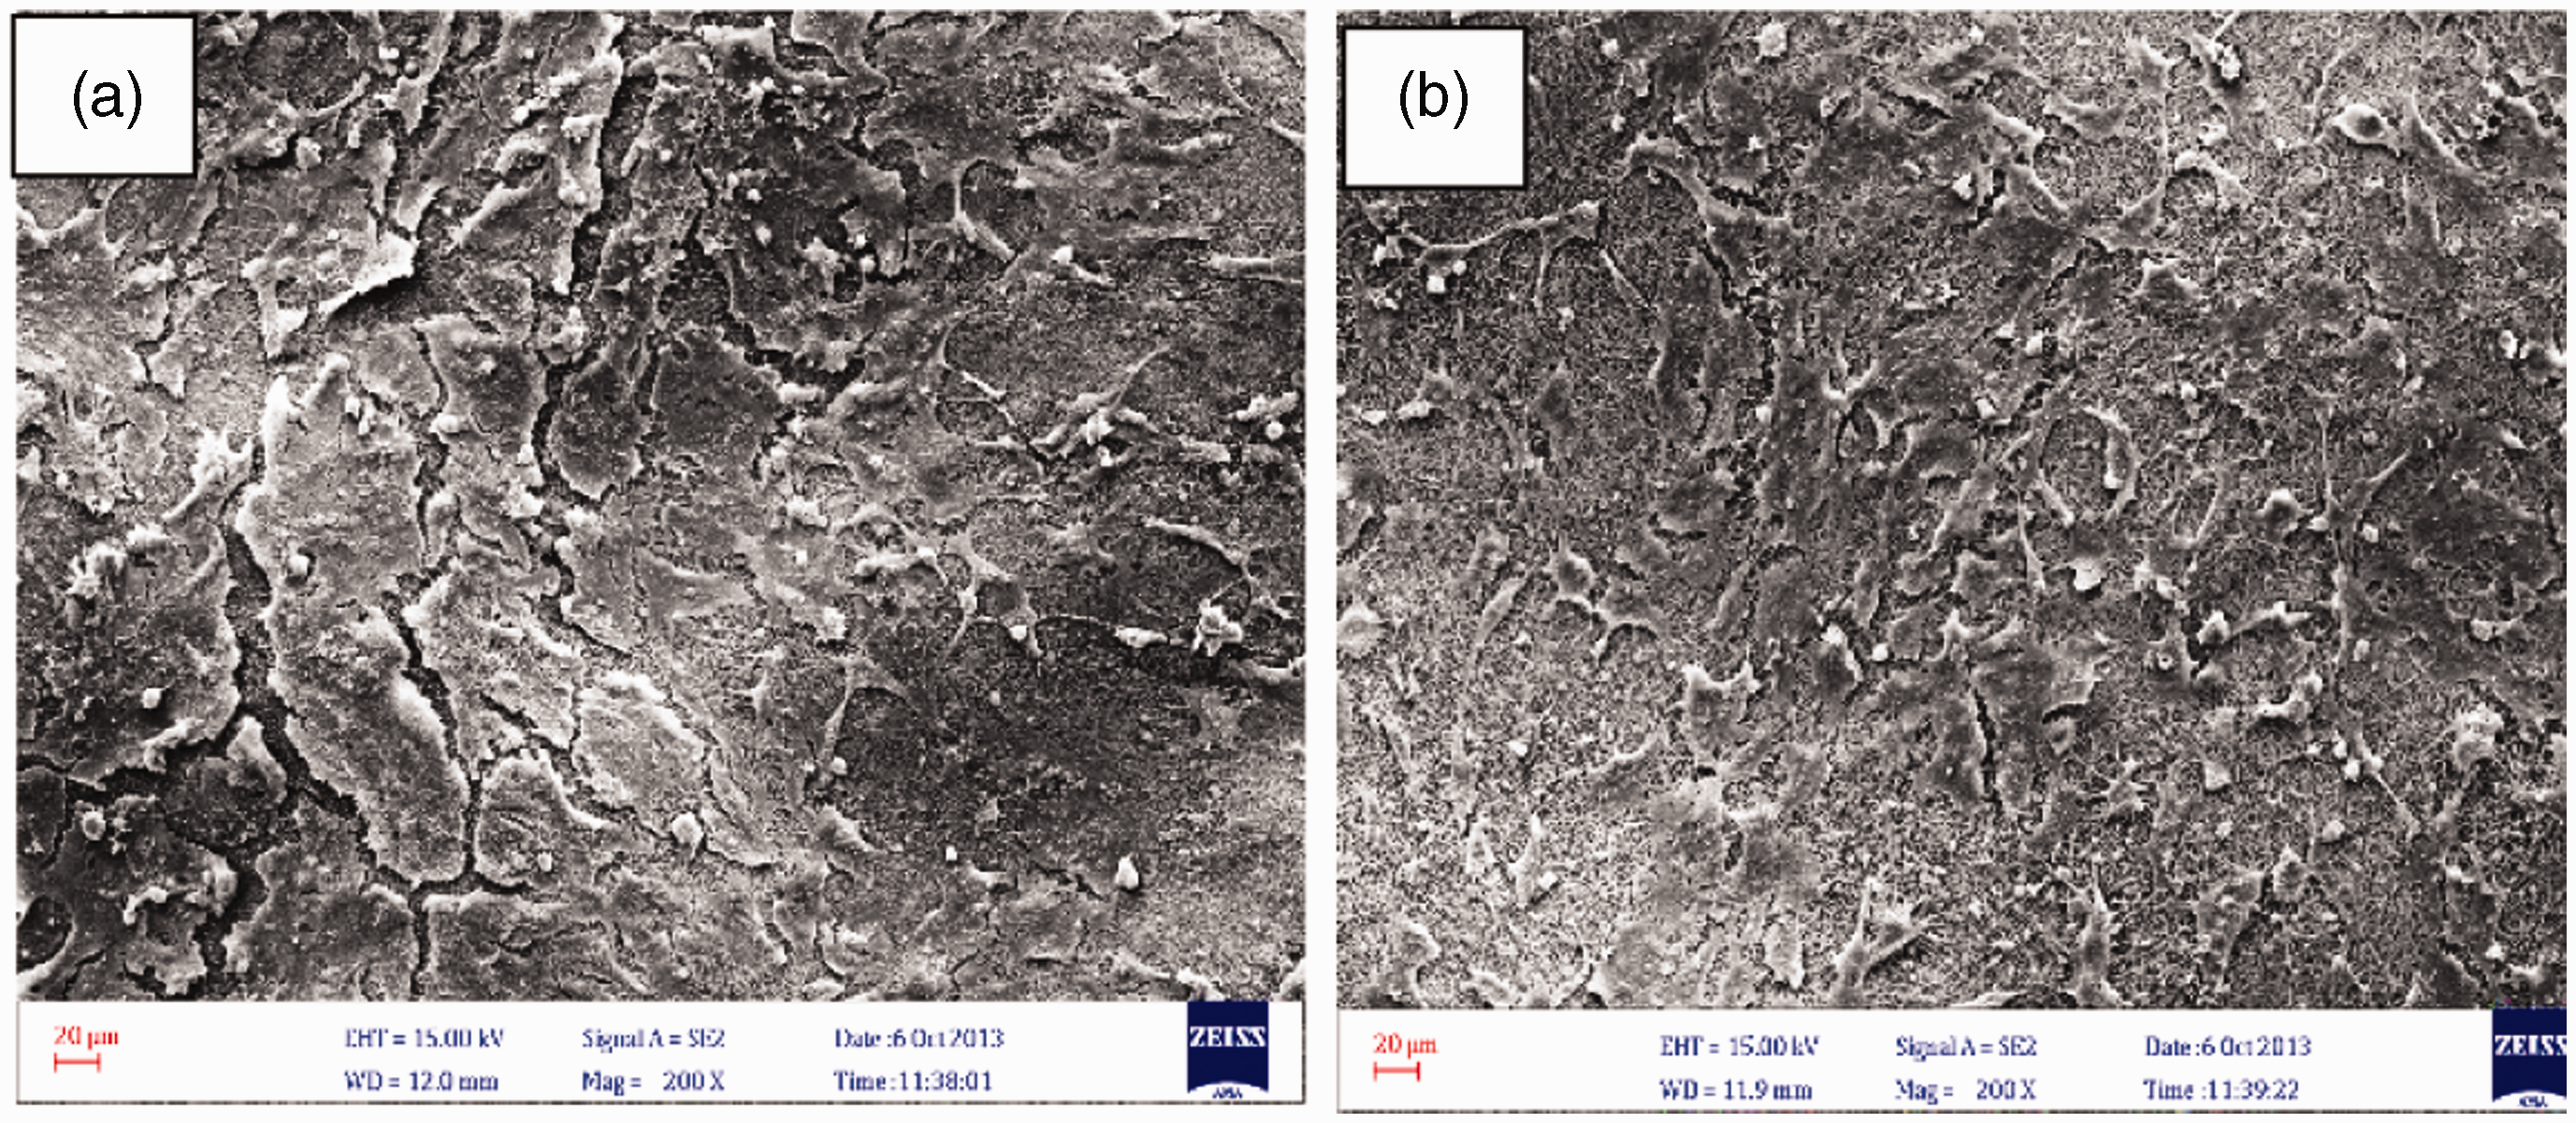
Conclusion
This study showed an overview on the impact of solution and processing parameters to the fabrication of GT/PVA electrospun nanofibers which may be used as nanostructure materials in medical industry. The diameter of GT/PVA nanofiber has been optimized by RSM and ANNs method. The applied voltage, distance between nozzle and collector, feed rate and solution concentration were found to be significant independent factors in the minimization of the diameter of nanofibers, but all square and interaction terms except x12, x22, x32, x1x2, x1x3, x3x4 were insignificant to the response. The 3D plots generated from this model well demonstrated the complexity and nonlinear relationships between the electrospinning parameters and nanofiber diameter. The configuration of the artificial neural network which gave the smallest MSE was a two-layer ANN with tangent sigmoid transfer function at hidden layer with six neurons, linear transfer function at output layer, and scaled conjugate gradient back-propagation training algorithm. High regression coefficient between the variables and the response for RSM and ANN model indicates the superiority of this model. Moreover, the RSM model shows much lower absolute percentage error than the ANN model. Therefore, RSM is an appropriate experimental design tool for the minimizing the diameter of GT/PVA nanofiber. Curcumin was used as herbal drug and was loaded on GT/PVA nanofibers. For doing this, the optimum condition of electrospinning was used from RSM and ANN model. Nanofibers with 3% (w/v) curcumin with good biological properties could be promising candidate for carcinoma, healing hyperplastic scar, or burn pain treatment.
Footnotes
Acknowledgments
The authors wish to thank the Center for Excellence Modern Textile Characterization, Tehran Iran for their support in providing the means for conducting experiments.
Declaration of Conflicting Interests
The author(s) declared no potential conflicts of interest with respect to the research, authorship, and/or publication of this article.
Funding
The author(s) disclosed receipt of the following financial support for the research, authorship, and/or publication of this article: This study was supported by Iran National Science Foundatio (INSF) under grant no. 91046806.