
Abstract
In this study, various tests are conducted to reveal the factors influencing the tearing resistance of coated fabrics. Firstly, a uniaxial shear test is designed to study the effect of the stress level on the shear modulus of P-type and G-type coated fabric membranes. The effect of crack length on trapezoidal test results is investigated and the influence of elongation at break on single-edge notched tearing strength and trapezoidal tearing strength is studied by conducting uniaxial cyclic tension. Then a statistical method is included to study the correlation between the single-edge notched tearing strength, trapezoidal tearing strength, tensile strength of single yarn, elongation at break, and shear modulus of four types of P-type and four types of G-type membrane materials. At the same time, the relationship between the single-edge notched tearing strength and crack length is fitted using four tearing theories, and the Thiele formula was proved to be the most recommended theory. Finally, the applicability and limitations of the single-edge notched tearing strength and trapezoidal tearing strength as evaluation indexes of tearing resistance of membrane materials are discussed.
Keywords
Introduction
Modern membrane structures, as a new form of long-span spatial structures, have been used globally owing to their excellent material properties such as aesthetic form, light weight, and fast construction speed. There are two types of building membrane materials: coated fabric and thermoplastic compound. The research object of this paper is coated fabric, which consists of a topcoat, coating, and substrate; its microstructure is displayed in Figure 1. Polyester and glass fibers are commonly used as substrate materials. Warp and weft yarns composed of fibers are woven according to specific weaving methods such as plain and Panama weaves. The external load is borne primarily by the substrate, which determines the mechanical properties of the membrane. The coating can be bonded to the substrate surface by coating or lamination to protect the substrate from rain and other pollutants. To further improve the durability of the membrane materials, a layer of topcoat is typically applied. Thus, a variety of building membrane materials can be obtained by combining different fiber substrates with resin coatings. According to the Technical Specification for Membrane Structures (CECS158:2015)
1
which is an important standard for the design, fabrication, installation, acceptance and maintenance of membrane structures in China, these coated fabric membrane materials are divided into two categories: P-type and G-type. The former refers to a membrane coated with a polymer continuous layer and an additional surface layer on the surface of the polyester fiber fabric substrate; the latter refers to a membrane coated with a polymer continuous layer on the surface of a glass fiber fabric substrate. At present, the widely used P-type and G-type membranes in China are membranes with PVDF surface layers, PVC coatings, polyester fiber fabric substrates, and membranes with PTFE coatings and glass fiber fabric substrates, respectively. Microstructure of coated fabric.
However, with the wide application of coated fabrics, damage to the membrane structures can occasionally occur. For example, Figure 2 displays the failure of the Japanese Kumagaya Dome caused by heavy snow in February 2014. Relevant investigations have indicated that tearing damage has become the main cause of these accidents.2,3 Specifically, during the production, installation, and use of membrane materials, wire breakage, cracks, creases, and other damage caused by external flying objects can occur. These defects can easily expand in strong wind or heavy snow, which frequently leads to overall damage to the membrane structure and poses a major threat to human health and economic development. For general fabric membrane materials, the tearing resistance is far worse than the tensile performance. However, at present, the technical specifications of membrane structures at home and abroad carry out strength checking calculation according to the tensile strength, and put forward requirements for the tearing strength as only a performance parameter of membrane materials. Therefore, more and more scholars have further studied the tearing behavior of membrane materials, in order to reasonably consider the tearing resistance of membrane materials in the process of membrane structure analysis and design. To evaluate the tearing resistance of coated fabric membranes, several different test methods have been proposed, such as out-of-plane, in-plane, and structural tearing tests. The out-of-plane tests include primarily single-tongue and double-tongue tearing tests. The in-plane tests include trapezoidal, single-edge notched, uniaxial, and biaxial central tearing tests. A selection of these test methods has been adopted in the relevant specifications.4–7 Failure of Japanese Kumagaya Dome due to heavy snow:
2
(a) before failure and (b) after failure.
Research on the tearing of fabric membranes has a long history, which can be traced back to 1915. 8 At that time, the trapezoidal tearing test and tongue (single tongue and double tongue) tearing tests were widely used in the garment field. In 1945, Krook 9 studied the single-tongue tearing of woven fabrics and proposed the concept of a del-zone for the first time. Hager, 10 Steele, 11 and Wang 12 studied the trapezoidal tearing test of woven fabrics and established theoretical models to predict the tearing strength. The results indicated that the trapezoidal tearing strength of woven fabrics depends primarily on the uniaxial tensile strength, elongation at break, effective clamping distance, clamping angle, and fabric structure density. Chu 13 and Witkowska 14 compared the characteristics of different uniaxial tearing test methods (single-tongue, double-tongue, wing-shaped, and trapezoid methods) and studied the correlation between their tearing results. Wang15,16 established a meso-scale finite element model of single tongue and trapezoid tearing, respectively, based on which she found that elongation at break, friction between yarns, weave density and structure of fabric, and coating all influence the tearing strength of the membrane material.
In recent years, with the wide application of fabric membranes in the field of construction and high-altitude airships, uniaxial and biaxial central tearing tests, and single-edge notched tearing tests have attracted increasing attention from scholars as they better simulate the actual engineering situation. Griffith 17 first established a general fracture theory for infinite isotropic elastic plates with cracks in 1920. Hedgepeth 18 proposed a two-dimensional micromechanical model of uniaxial central tearing for the first time and calculated the stress concentration factor at the tip of the crack. It was assumed that the yarn only transmitted the axial load, and the coating only transmitted the shear force in the model. Bigaud et al. 19 studied the tearing behavior of PVC membranes in detail by uniaxial and biaxial central tearing tests and calculated the fracture toughness of this membrane material using theoretical methods. Based on the Kawabata model, 20 Godfrey and Rossettos21,22 established a micromechanical model of a central tearing test considering the limited slip of the yarn, which was used to study the tearing propagation of coated and uncoated woven fabrics. Chen et al.23,24 and Wang et al.25,26 systematically studied the effects of the initial crack length, off-axis angle, crack angle, tensile speed, and warp/weft stress ratio on the uniaxial and biaxial central tearing behavior of airship envelope fabric materials, and derived relevant theoretical formulas. Meng 27 proposed a theoretical model of envelope material considering the interaction between warp and weft yarns, with which the tearing strength and damage mode of single-edge notched tearing specimens could be predicted. Zhang 28 performed a similar study on the uniaxial central tearing of coated fabrics for construction; the research variables included crack shape and size, specimen size, tensile speed, and off-axis angle. He et al. 29 studied the tearing resistance of PTFE membranes using uniaxial central tearing tests. The critical strain energy release rate G IC of the membrane material was measured using the virtual crack closure technique (VCCT), and the effects of boundary conditions and shear modulus were discussed. Chen et al. 30 proposed a modified formula based on Maekawa’s empirical formula to calculate the single-edge notched tearing strength of an airship envelope fabric; the results were compared with experimental data to verify their validity.
For structural tearing tests, Topping 31 and Maekawa 32 performed a pressurized cylinder test with cracks; the test results were fit using relevant theories including the Thiele empirical formula and critical stress field theory. The minimum crack size at the moment of tearing propagation under the limit stress was estimated.
A review of the existing literature indicates that the previous studies had limitations. Research on the factors influencing tearing resistance of coated fabric membranes have not been systematic nor comprehensive. As a composite material, the tearing resistance of a membrane is the result of the interaction of numerous factors including the coating and yarns. For the trapezoidal tearing, central tearing, and single-edge notched tearing tests, numerous factors influence the tearing properties, including test conditions, specimen configurations, and material properties. Specifically, the test conditions include uniaxial/biaxial loading mode, loading speed, and specimen clamping mode, among other factors. The specimen configurations include specimen length and width, crack length, and angle. The material properties are even more abundant, including tensile strength, elongation at break, tensile modulus, shear modulus, yarn density, thickness, knitting method, and membrane types. The above factors are important for establishing an ideal tearing prediction theory model and for understanding the tearing mechanism of membrane materials. For example, previous studies have indicated that the trapezoidal tearing test is widely used in domestic and foreign codes because of its simple failure mode and stable test results. However, research on the influence of external factors such as clamping angle, clamping distance, and crack length on trapezoidal test results has been less than sufficient and must be comprehensively investigated. In the tearing process, the load at the crack is transferred to the adjacent membrane surface through shear action, which directly leads to stress concentration at the tip of the crack. Therefore, shear action is important for the stress transfer of the membrane surface during the tearing process and directly influences the tearing strength results, whereas the shear modulus is less considered in current tearing research. In summary, research into the factors influencing the tearing resistance of coated fabric membranes is not sufficient and requires further investigation. Only by fully understanding the factors affecting the tearing strength of membrane materials obtained through various tearing tests, it is possible to establish the test or theoretical method for the analysis and design of tearing failure of membrane structures.
Moreover, the rationality of trapezoidal test results as an evaluation index of tearing resistance of coated fabric membranes must be further studied. If the trapezoidal tearing strength is significantly influenced by the test conditions and other external factors, the specific tearing strength value of the coated fabric membrane cannot be accurately obtained and its value as a comparative index of tearing resistance between different membrane materials requires further study. Furthermore, as a simplified form of the central tearing test, the single-edge notched test is considered to be a more accurate evaluation of the tearing failure behavior of an actual membrane structure when compared with the trapezoidal test. The correlation between the trapezoidal and single-edge notched tearing strengths has been rarely considered in the current literature.
Considering these issues, the influence factors of single-edge notched tearing and trapezoidal tearing tests are investigated in detail through the design of comparative tests and the application of statistical methods, including shear modulus, elongation at break, crack length, and tensile strength of single yarn. At the same time, several fitting theories of single-edge tearing strength are studied to clarify their applicability. Moreover, the correlation, applicability, and limitation of the tearing strength obtained by these two methods for evaluating the tearing resistance of coated fabric membranes are discussed. The results of this study provide theoretical support and reference suggestions for further understanding the tearing failure mechanism, perfecting the evaluation method of the tearing resistance of membrane materials, and reducing tearing failure accidents.
Materials
Specifications of testing membrane materials.

Test setup
Test equipment
In this study, all uniaxial and biaxial tests were conducted using the universal CMT4204 (Figure 3(a)) and biaxial testing (Figure 3(b)) machines, respectively. Test equipment: (a) universal testing machine, (b) biaxial testing machine, and (c) DIC equipment.
A three-dimensional (3D) digital speckle dynamic strain measurement and analysis system (Figure 3(c)) was used to obtain the deformation of the membrane surface. The basic principle of this system includes the digital image correlation (DIC) (Digital Image Association) method combined with binocular stereo vision technology and two high-speed cameras to acquire the speckle images at each deformation stage of the object in real time. Subsequently, the image correlation algorithm is used to stereo match the deformed points on the surface of the object, and the 3D coordinates of the matched points are reconstructed. Finally, by smoothing the displacement field data and visualizing the deformation information, a noncontact full-field strain measurement can be performed quickly, accurately, and in real time. The strain measurement range of the DIC equipment used in our study was 0.005%–2000% and the spatial 3D deformation could be measured.
Study of shear modulus
The shear performance of coated fabric membranes is an important issue in the field of fabric membrane research. It has an important role in the deformation behavior of the membrane structure, which causes the original flat fabric membrane to develop into a complex form after prestressing. It is also meaningful to study shear action for the research of tearing behaviors of coated fabric membranes because the stress concentration phenomenon leading to the tearing propagation of the membrane is, to a certain extent, due to shear. A uniaxial tensile membrane surface with cracks is displayed in Figure 4. When the specimen is subjected to a longitudinal tensile load, the external force originally borne by the yarns in the crack is transferred to the adjacent membrane surface through shear action, resulting in a clear stress concentration phenomenon near the crack tip, which is significantly different from the small and uniform stress distant from the damage. The breaking of the yarn at the crack tip leads to tearing propagation and significantly reduces the bearing capacity of the membrane material. As indicated in Figure 4, the ABCD area on the membrane surface is rectangular in the initial state and becomes a parallelogram under the action of shear deformation. This phenomenon is the visual expression of the load transfer at the crack through shear action. Membrane surface deformation of uniaxial central tearing test: (a) initial state and (b) after deformation.
The shear modulus reflects the ability of the membrane material to resist shear deformation. It can be easily determined that when the shear modulus is zero, the external force at the crack cannot be transferred to the adjacent membrane surface; hence, the material at the crack cannot bear the load and can no longer function, and the specimen degenerates into a uniaxial tensile state. Conversely, when the shear modulus is infinite, the load at the crack can be transferred to the distant membrane area and the membrane stress tends to be uniform. In conclusion, the shear modulus influences the stress concentration in the tearing process of the coated fabric membrane, which directly influences the tearing strength of the material. One of the goals of this study is to measure the shear modulus of a coated fabric membrane and study its correlation with tearing resistance.
The existing shear modulus testing methods include bias-extension, picture-frame, biaxial tensile shear, KES-F, cylinder shear, and T-shaped tests. The bias-extension test refers to the creation of rectangular specimens in a 45° direction from the warp and weft yarn,
33
as indicated in Figure 5(a). After uniaxial stretching, a shear force is produced on the membrane surface. It is generally assumed that the shear angle of Region C is twice that of Region B, whereas there is no shear deformation in Region A, and the shear angle of each region is considered to be uniform. Based on these assumptions, the mathematical formulas for calculating the shear stress and shear strain based on the displacement and load at the clamp can be derived. This method is simple and low-cost, and as such is the most commonly used. However, its main disadvantage is that the strain distribution in the specimen is not as uniform as assumed; hence, it is difficult to accurately measure the shear angle and the pretension is difficult to apply. Shear modulus tests: (a) bias-extension test, (b) picture-frame test, and (c) biaxial tensile shear test.
The method of measuring membrane shear modulus using the picture-frame test was adopted by DG/TJ08-2019-2007, 4 which refers to the Japanese specification MSAJ/M-01-1993. 34 First, pretension is introduced to a cruciform specimen by biaxial tension; then, four extension arms of the specimen are cut off, and the central membrane surface is fixed in a square frame formed by hinges. The warp and weft yarns of the membrane material are parallel to the frame. Subsequently, the picture frame is installed on the testing machine, as indicated in Figure 5(b), and uniaxial tensile and compressive loads are applied to the diagonal direction of the frame to the set displacement. Finally, the in-plane shear modulus is calculated based on the average values of the tensile and compressive loads. The picture-frame test has been adopted by numerous scholars;35,36 however, in this kind of test, it is difficult to apply the required pretension to the membrane surface, and the friction in the frame pin can influence the results.
The biaxial tensile shear test was first proposed by Blum et al. 37 First, a cross-shaped specimen, as displayed in Figure 5(c), is created, where the warp and weft yarn directions are at a 45° angle to the load direction. Based on Mohr’s circle principle, when the tensile and compressive stresses of the x- and y-axes are equal, a pure shear load can be observed on the 45°-inclined section. However, because the fabric cannot bear the compression load, the biaxial tension must be applied to a certain level of pretension at a ratio of 1:1. Then, the specimen is loaded by one axial tension and one axial compression, such that a linear change in the shear stress on the membrane surface can be achieved, the continuous triangular shear loading spectrum can be obtained, and the pretension level can be maintained constant. Finally, the shear stress is calculated using the plane stress formula, and the shear strain is indirectly calculated by measuring the tensile strain in three directions of the membrane surface. Compared with the picture-frame test, the biaxial tensile shear test can accurately control the stress value and period; however, it has higher requirements for the loading equipment and loading control mechanism, and the specimens must be specially processed.
Other test methods include the KES-F shear test, 38 T-shape test, 39 and cylinder shear test; 40 however, they are more complex and are not widely used in membrane tests.
Because this study focuses mainly on the uniaxial tearing resistance of coated fabric membranes, the shear properties of the material under uniaxial stress are primarily considered. Conversely, based on previous research, 37 it was found that the majority of the studies were based on the membrane surface working at a low stress level. However, during the tearing process, the membrane surface near the crack was in a high-stress state. In this case, the shear modulus could be clearly different from the value measured at a low stress level owing to the tension of the membrane material and enhancement of the contact effect between the yarns. In summary, research on the effect of stress level on the shear performance of coated fabrics remains lacking.
In this paper, a new method called the uniaxial shear test is proposed to study the shear properties of coated fabric membranes under different stress levels. The setting of the uniaxial shear specimen size refers to the biaxial tensile specimen introduced in DG/TJ08-2019-2007,
4
however, the two arms of the biaxial tensile specimen are cut off and the yarn direction is at a 45° angle to the loading direction. The biaxial tensile testing machine (Figure 3(b))and DIC noncontact strain acquisition equipment (Figure 3(c)) are used to apply a load and measure the membrane surface deformation. It should be noted that only uniaxial tension is performed by the biaxial machine. After cutting off a pair of extension arms, spray paint is applied to the middle part to produce speckles. The specimen sizes and clamping modes are displayed in Figure 6. We focus primarily on the central rectangular ABCD area, and it is assumed that the deformation of the membrane material in this area is pure in-plane shear with no wrinkles. As indicated in Figure 7(a), for the ABCD area, the dotted and solid lines represent the original shape and deformed shape of the area, respectively. After the specimen is stressed, Angle A increases and Angle B decreases; then, the reduction (radian) is regarded as the shear strain γ, and α is the inclination angle of the inclined plane at the boundary of the area. Compared with other shear tests, in this new shear test, the tensile stress that can be accurately controlled can be transmitted to the middle shear region more evenly, so as to ensure that the strain distribution in this region is relatively uniform. And the shear angle can be accurately measured with the help of DIC equipment. Specimen setup: (a) specimen size (mm) and (b) clamping mode. (a) Shear deformation in central region of uniaxial shear specimen and (b) loading protocol.


Shear modulus test setup.

Study of effect of elongation at break on trapezoidal and single-edge notched tearing tests
At present, there are many studies on the influence of factors such as specimen size and tensile strength on tearing strength of membrane materials. As an important aspect of membrane performance index, we know little about the relationship between elongation at break and tearing strength. Therefore, this part makes a detailed study on this aspect.
According to the previous test experience, it can be predicted that the initial relaxation of the coated fabric can be significantly eliminated by pre stretching, and the originally curled yarn will be tensioned, so as to reduce the elongation at break of membrane, which has little effect on the tensile strength. Therefore, we can investigate the effect of elongation at break on the single-edge notched and trapezoidal tearing strengths of the membrane material through the pretensioning process.
Referring to a previous study
41
and DG/TJ08-2019-2007,
4
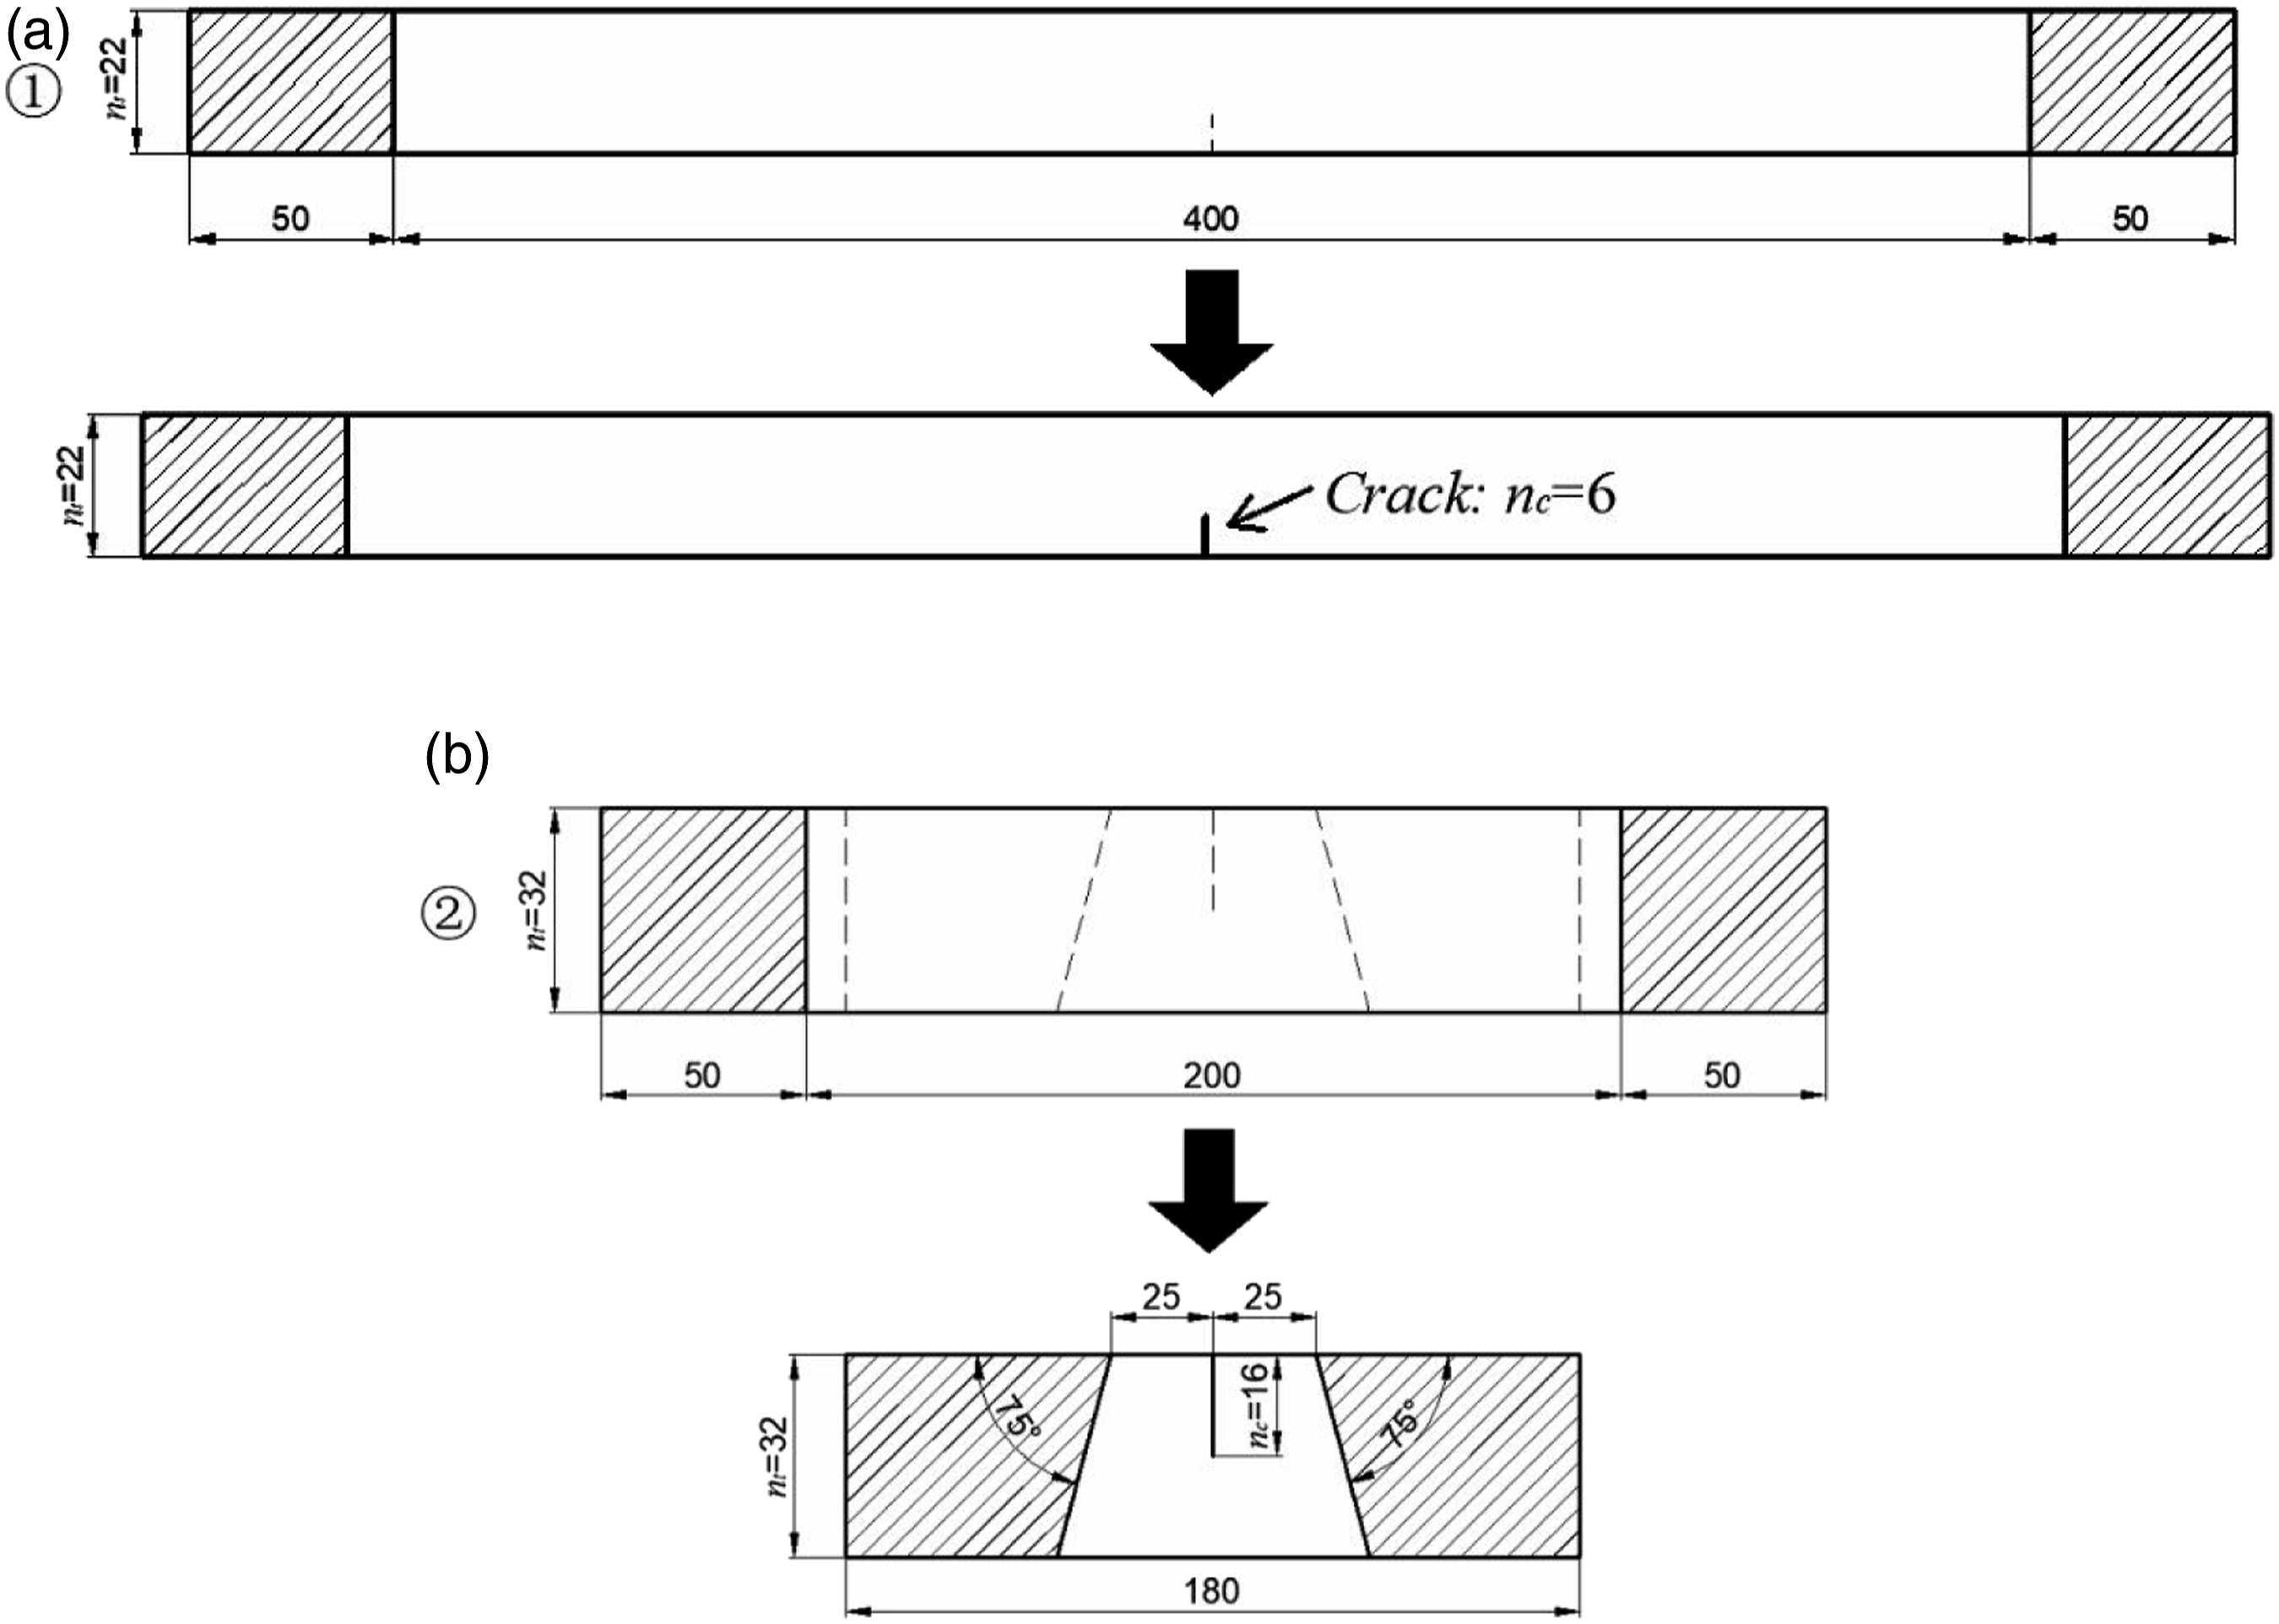
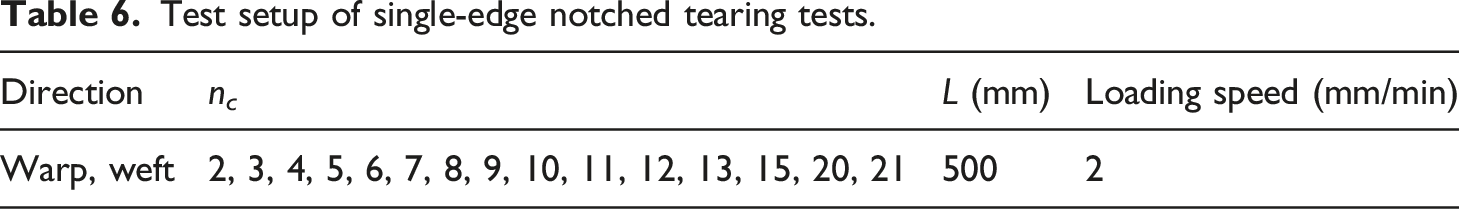
the dimensions of the single-edge notched and trapezoidal tearing specimens are displayed in Figure 8. The specific dimensions were adjusted according to the test purpose. During specimen preparation, the cut path and external load were parallel to the yarn direction. The cutting was performed along the centerline between neighboring yarns to avoid loss of fibers. In the following section, specimens where the warp and weft yarns are parallel to the direction of the external load are defined as warp and weft specimens, respectively. Uniaxial tests were conducted using a universal testing machine CMT4204 (see Figure 3(a)). Unless otherwise specified, the tension speed was set to 2 mm/min to ensure static loading. The sensor installed near the clamp could record the load and displacement data in real time. Configuration of (a) single-edge notched specimen and (b) trapezoidal specimen.
The preparation of the tearing specimens is explained as follows. The number of yarns is used instead of the typical international unit length to avoid damage to the yarns during specimen preparation, as the yarns bear the majority of the applied load. Therefore, the macro crack length 2a is replaced by n c , which represents the number of cutting-off yarns in the drawing direction. The total number of yarns in the width direction of the specimen is expressed as n t . The gauge length between the edges of the clamps is represented by L. The letters S and T refer to single-edge notched and trapezoidal tearing tests, respectively. The specimens with an external load direction parallel to the warp and weft yarns are defined as warp and weft specimens, respectively. Thus, the warp specimens in the trapezoidal tearing tests can be expressed as T-warp-n c -n t . The naming rules of the other specimens are analogous.
The flow chart of the production process is shown in Figure 9. The test setup and preparation of uniaxial tensile specimens ① and ② are listed in Table 3 and Figure 10, respectively. Referring to CECS158:2015,
1
it can be observed that owing to the safety factor considered in the design of the membrane structure, the actual stress in the structure can only achieve 1/4 of its tensile strength. Therefore, the peak loads of cyclic tension were set to 1/4σ
ult
, 3/8σ
ult
, 1/2σ
ult
, and 5/8σ
ult
, where σ
ult
represents the smaller value of the tensile strength of the membrane in the warp and weft directions. In the pretensioning process, Specimens ① and ② were loaded to the corresponding cyclic tension value and repeated three times. They were then left to rest for 30 min and cut along the dotted line into single-edge notched specimen S-warp-6-22 and trapezoidal specimen T-warp-16-32, respectively, as indicated in Figure 10. The n
c
value in trapezoidal specimen is set to 16, which refers to the standard practice in specification DG/TJ08-2019-2007.
4
For the single-edge notched specimen, the n
c
value is set to 6 to be small enough relative to the number of total yarns in width n
c
= 22, so that the test results will not be affected by n
c
value. All specimens in this section were made in the warp direction of the 250T P-type membrane (Table 4). Flow chart of the production process. Test setup of uniaxial tensile tests. Specimen preparation for (a) single-edge notched tearing test and (b) trapezoidal tearing test. Test setup of tearing tests.


Study on effect of crack length on trapezoidal tearing test
Trapezoidal tearing test setup with different number of cutting-off yarns.

Statistical analysis of tearing resistance
At present, the research on tearing resistance of coated fabrics used for buildings is based primarily on two kinds of tests: trapezoidal tearing and single-edge notched tearing. The former has been widely adopted by national standards; the latter can be regarded as a simplified form of the uniaxial central tearing test. 41 However, the current studies on these two kinds of tests are relatively independent and the types of membrane materials studied are relatively simple. From the point of view of engineering applications, it is necessary to introduce more membrane materials and systematically study the influencing factors of trapezoidal and single-edge notched tearing strengths. In this study, the trapezoidal tearing strength is defined based on DG/TJ08-2019-2007 4 and the single-edge notched tearing strength refers to the engineering stress obtained by dividing the external load at the moment of tearing propagation by the initial width of the specimen.
In this section, the mechanical properties of all P-type and G-type coated fabric membrane materials introduced in Table 1 were systematically studied. The effects of the tensile strength of a single yarn, elongation at break, and shear modulus on the trapezoidal and single-edge notched tearing strengths were investigated in detail using statistical theory tools. The correlation between these two common tearing strength indexes and their applicability in evaluating tearing resistance were compared and analyzed to improve the understanding of the tearing behaviors of coated fabrics, and provide theoretical and data support for how to reasonably consider the tearing effect in the membrane structure design and how to improve the tearing resistance of membrane materials in the production process.
The test methods used to obtain the uniaxial tensile strength of the membrane, elongation at break, and trapezoidal tearing strength of the coated fabric refer to DG/TJ08-2019-2007. 4 It can be observed from a relevant study that in trapezoidal and single-edge notched tearing tests, the tearing propagation starts from the breaking of the single yarn at the crack tip; hence, the tensile strength of a single yarn is more directly related to the tearing resistance of the fabric. Therefore, based on the weave density of each membrane material listed in Section 2, the uniaxial tensile strength of the membrane was divided by the number of yarns within the width of the specimen to calculate the tensile strength of a single yarn. In addition to the shear test, which was repeated three times for each type of membrane owing to the complexity of the specimen development and test processes, the other tests were repeated five times for each fabric to increase the credibility. The standard deviation was obtained to evaluate the dispersion and precision of test results.
Test setup of single-edge notched tearing tests.
Results of shear modulus
The test was performed according to the introduction in Section 3.2; test images are displayed in Figure 11. The shear deformation of the core area ABCD, the area of concern in this test, occurs after uniaxial tension, changing from a rectangular to rhombic shape. Uniaxial shear test of 250T membrane (a) before deformation and (b) after deformation.
Figure 12(a) displays the time history curves of shear stress τ
α
and shear strain γ of the 250T uniaxial shear specimen when the uniaxial stress σ
x
in the x-direction is loaded to 12 kN/m for three cycles. In this process, the area from rectangle to rhombic shape is reduced by 16.19%. The curves of the other stress levels of 3, 6, and 9 kN/m are similar. It can be observed that there is virtually no delay in the shear strain response with the change in stress, and after the first cycle, although the membrane stress is unloaded to zero, a large residual shear strain remains in the specimen; the shear strain tends to be stable in the later cycle. Figure 12(b) displays the typical shear strain-shear stress curve of 250T membrane, which reflects the typical characteristics of P-type membrane materials. It can be observed that the shear process of the P-type membrane exhibits strong nonlinearity. At the initial stage of loading, the curve is relatively flat, which means that the resistance of the membrane to shear deformation is small. At this stage, there is no extrusion between the warp and weft yarns and the external shear force is borne by the coating. However, with the increase of shear stress, the warp and weft yarns are squeezed, and the shear resistance of the fabric increases rapidly, which is reflected in the rapid increase in the slope of the curve. After loading to the target load, the specimen begins to unload; this process was repeated three times. In the process of repeated loading and unloading, it was found that the curves were stable and virtually coincided, and the loading section was approximately a straight line. There are several methods to calculate the shear modulus. Since the fabric is tensioned several times before installation in the actual membrane structure, the calculation method in this study used the straight line IJ (see Figure 12(b)) to connect the start and end points of the third cycle loading curve, where the slope of the straight line was considered as the shear modulus value of the fabric. Figure 12(c) displays the shear stress-strain curves of 250T Specimen 1 under different stress levels. It can be seen that the shapes of curves are similar under different stress levels, but compared with the case of high stress level, the curve in the cyclic tensile stage under low stress level is more gentle. (a) Three cycle loading curves with 12 kN/m peak load of 250T, (b) calculation schematic diagram of shear modulus of 250T, and (c) shear stress-strain curve of Specimen 1 of 250T.
For a G-type FGT800 membrane, the typical shear strain-stress curve is displayed in Figure 13(a). By comparing Figure 13(a) and Figure 12(b), it can be observed that the similarity between G- and P-type membranes is that their shear loading processes indicate strong nonlinearity. Although the curve exhibits a certain deviation after cyclic loading and unloading, it also tends to be stable, and the loading section after cyclic loading is similar to a straight line. Therefore, the slope of the line that connects the start and end points of the third cycle is also taken as the shear modulus of the G-type membrane. However, the curve section from the zero point to the first peak point of the G-type membrane material is clearly different from that of the P-type membrane. Specifically, the curve slope of the P-type membrane increases from small to large, whereas that of the G-type membrane indicates the opposite trend, which means that the G-type membrane has a greater resistance to shear deformation at the beginning. Figure 13(b) displays the shear stress-strain curves of FGT800 Specimen 1 under different stress levels. It can be seen that in the cyclic loading stage, the change rates of curves are relatively close whether it is at high stress level or low stress level. (a) Calculation schematic diagram of shear modulus of G-type membrane material and (b) shear stress-strain curve of FGT800 membrane.
Calculation results of shear modulus.

Effect of elongation at break on trapezoidal and single-edge notched tearing tests
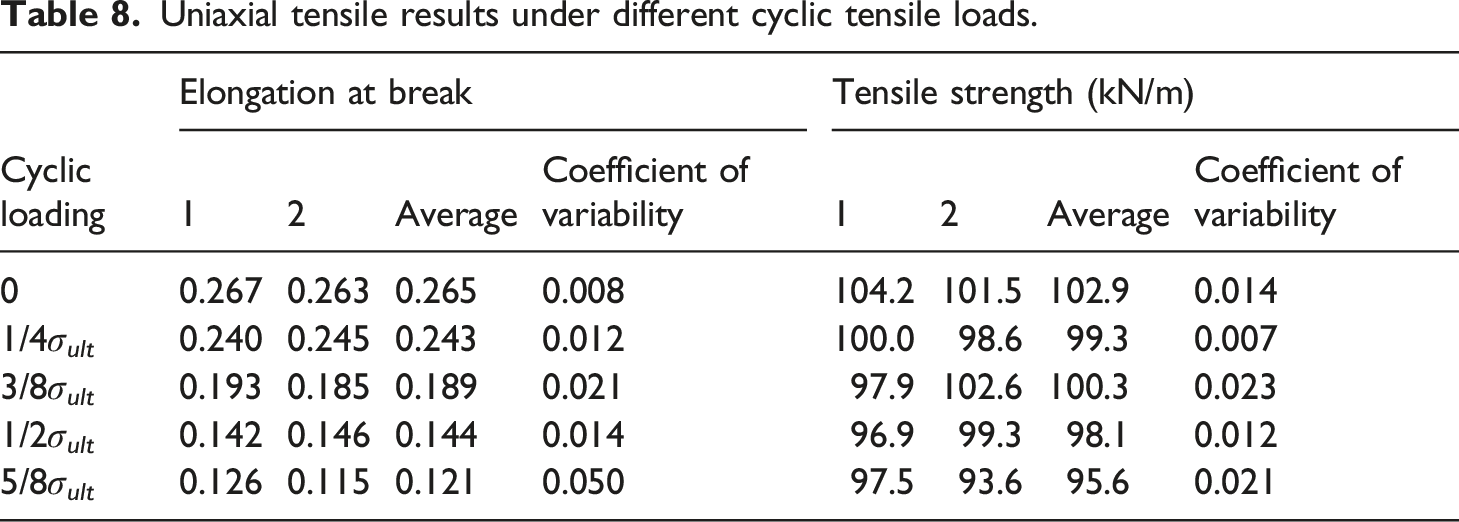
The typical cyclic tensile and uniaxial tensile curves after cyclic tension of 250T P-type warp specimen are displayed in Figure 14. The corresponding obtained elongation at break and tensile strength are summarized in Figure 15 and Table 8. It can be concluded that the elongation at break of the membrane material after cyclic tension decreased significantly, whereas the tensile strength remained virtually unchanged. Specifically, when the uniaxial specimens were cyclically stretched to 1/4σ
ult
, 3/8σ
ult
, 1/2σ
ult
, and 5/8σ
ult
, the elongation at break decreased by 9.4%, 27.2%, 44.2%, and 52.5% from 0.265, that is, to 0.243, 0.189, 0.144, and 0.121, respectively. (a) Cyclic tensile stress-strain curve and (b) uniaxial tensile curve after cyclic tension. Relationship between tensile properties and cyclic tension: (a) elongation at break and (b) tensile strength. Uniaxial tensile results under different cyclic tensile loads.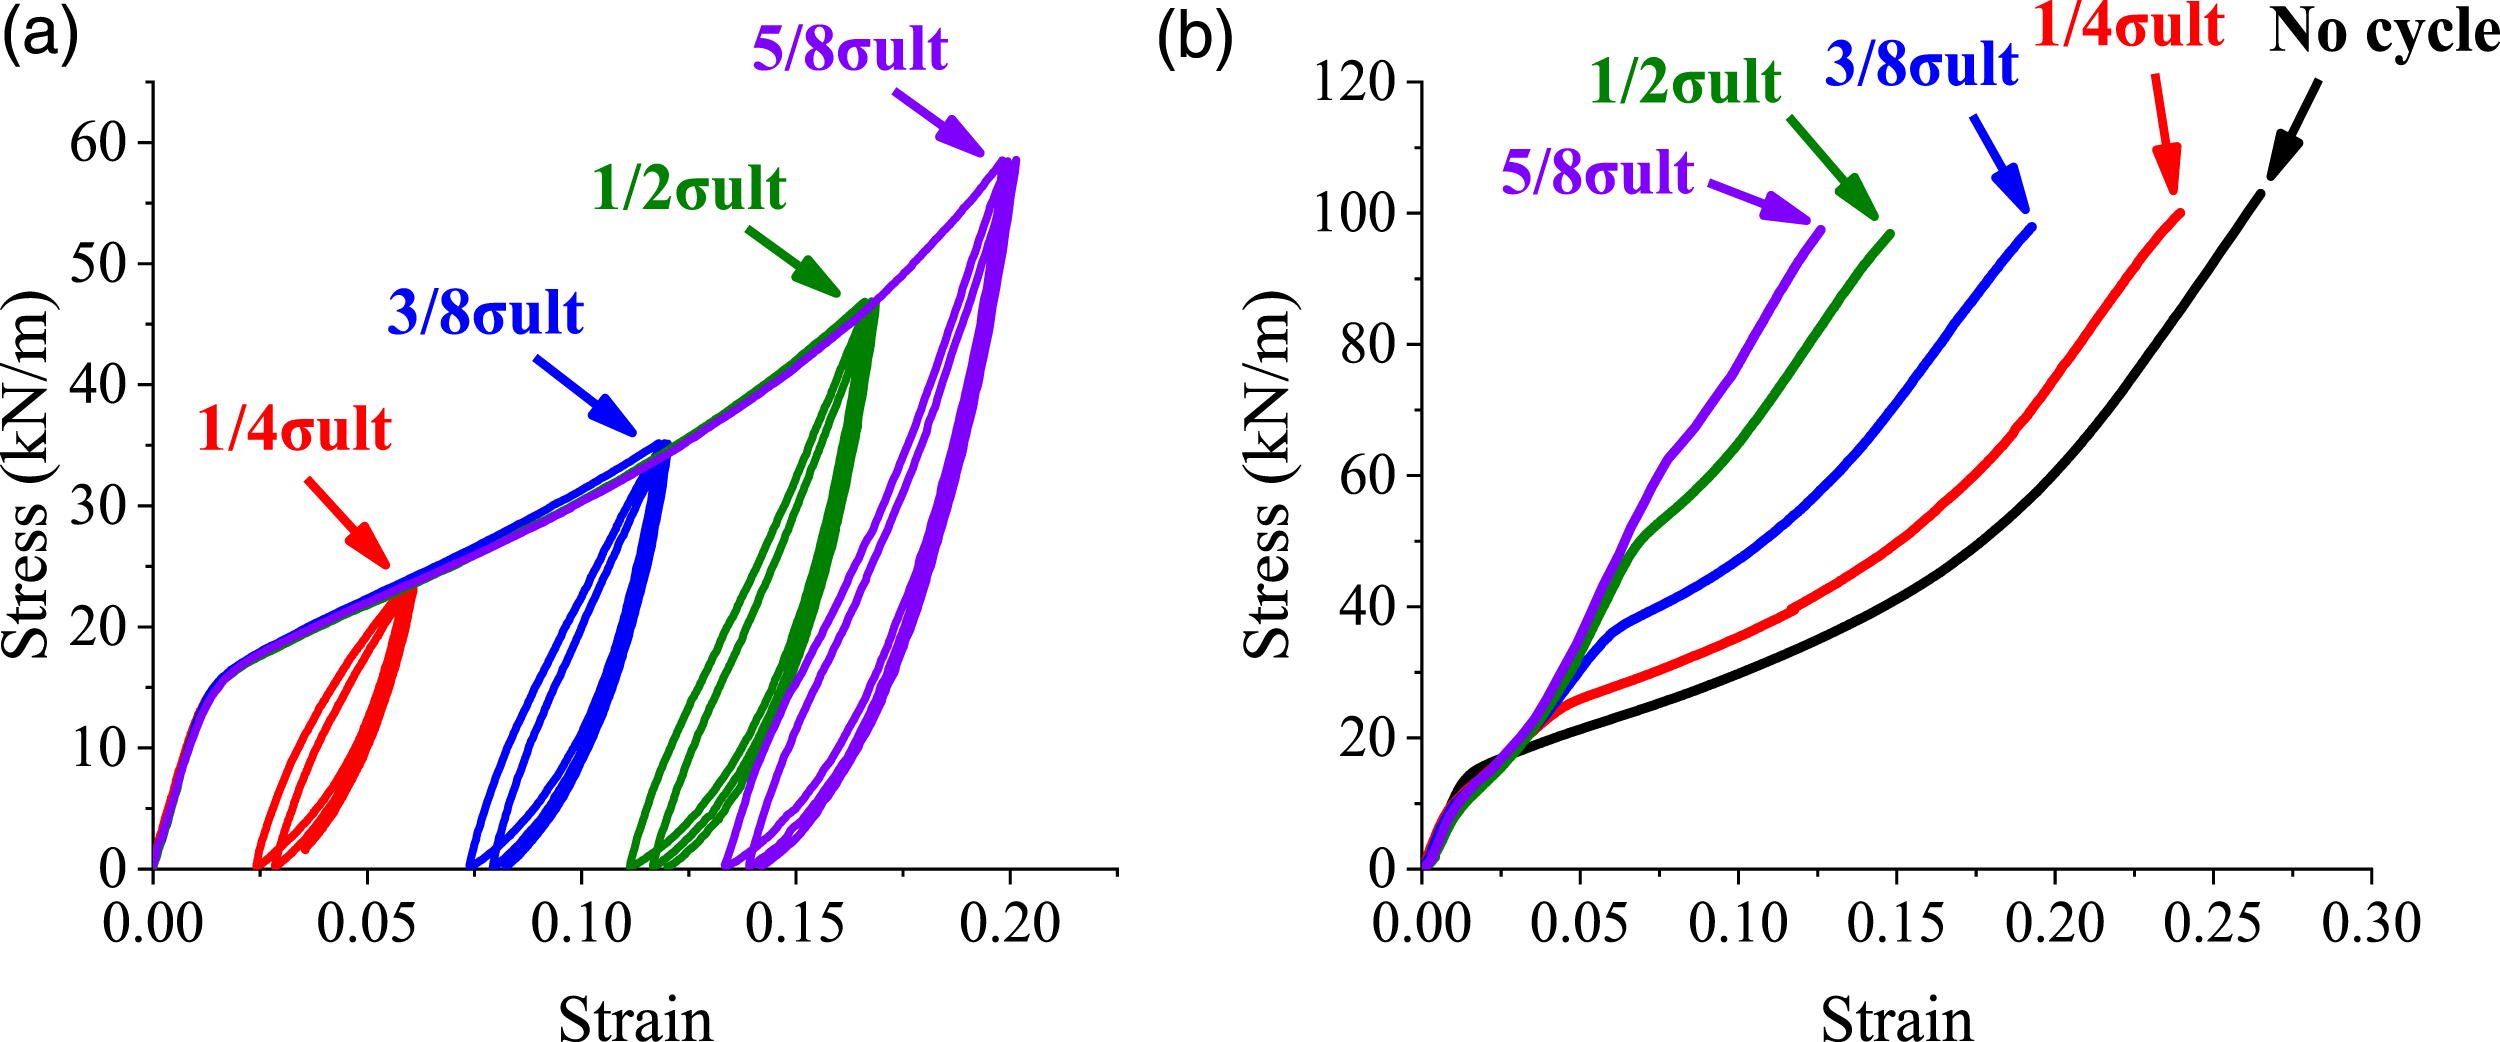

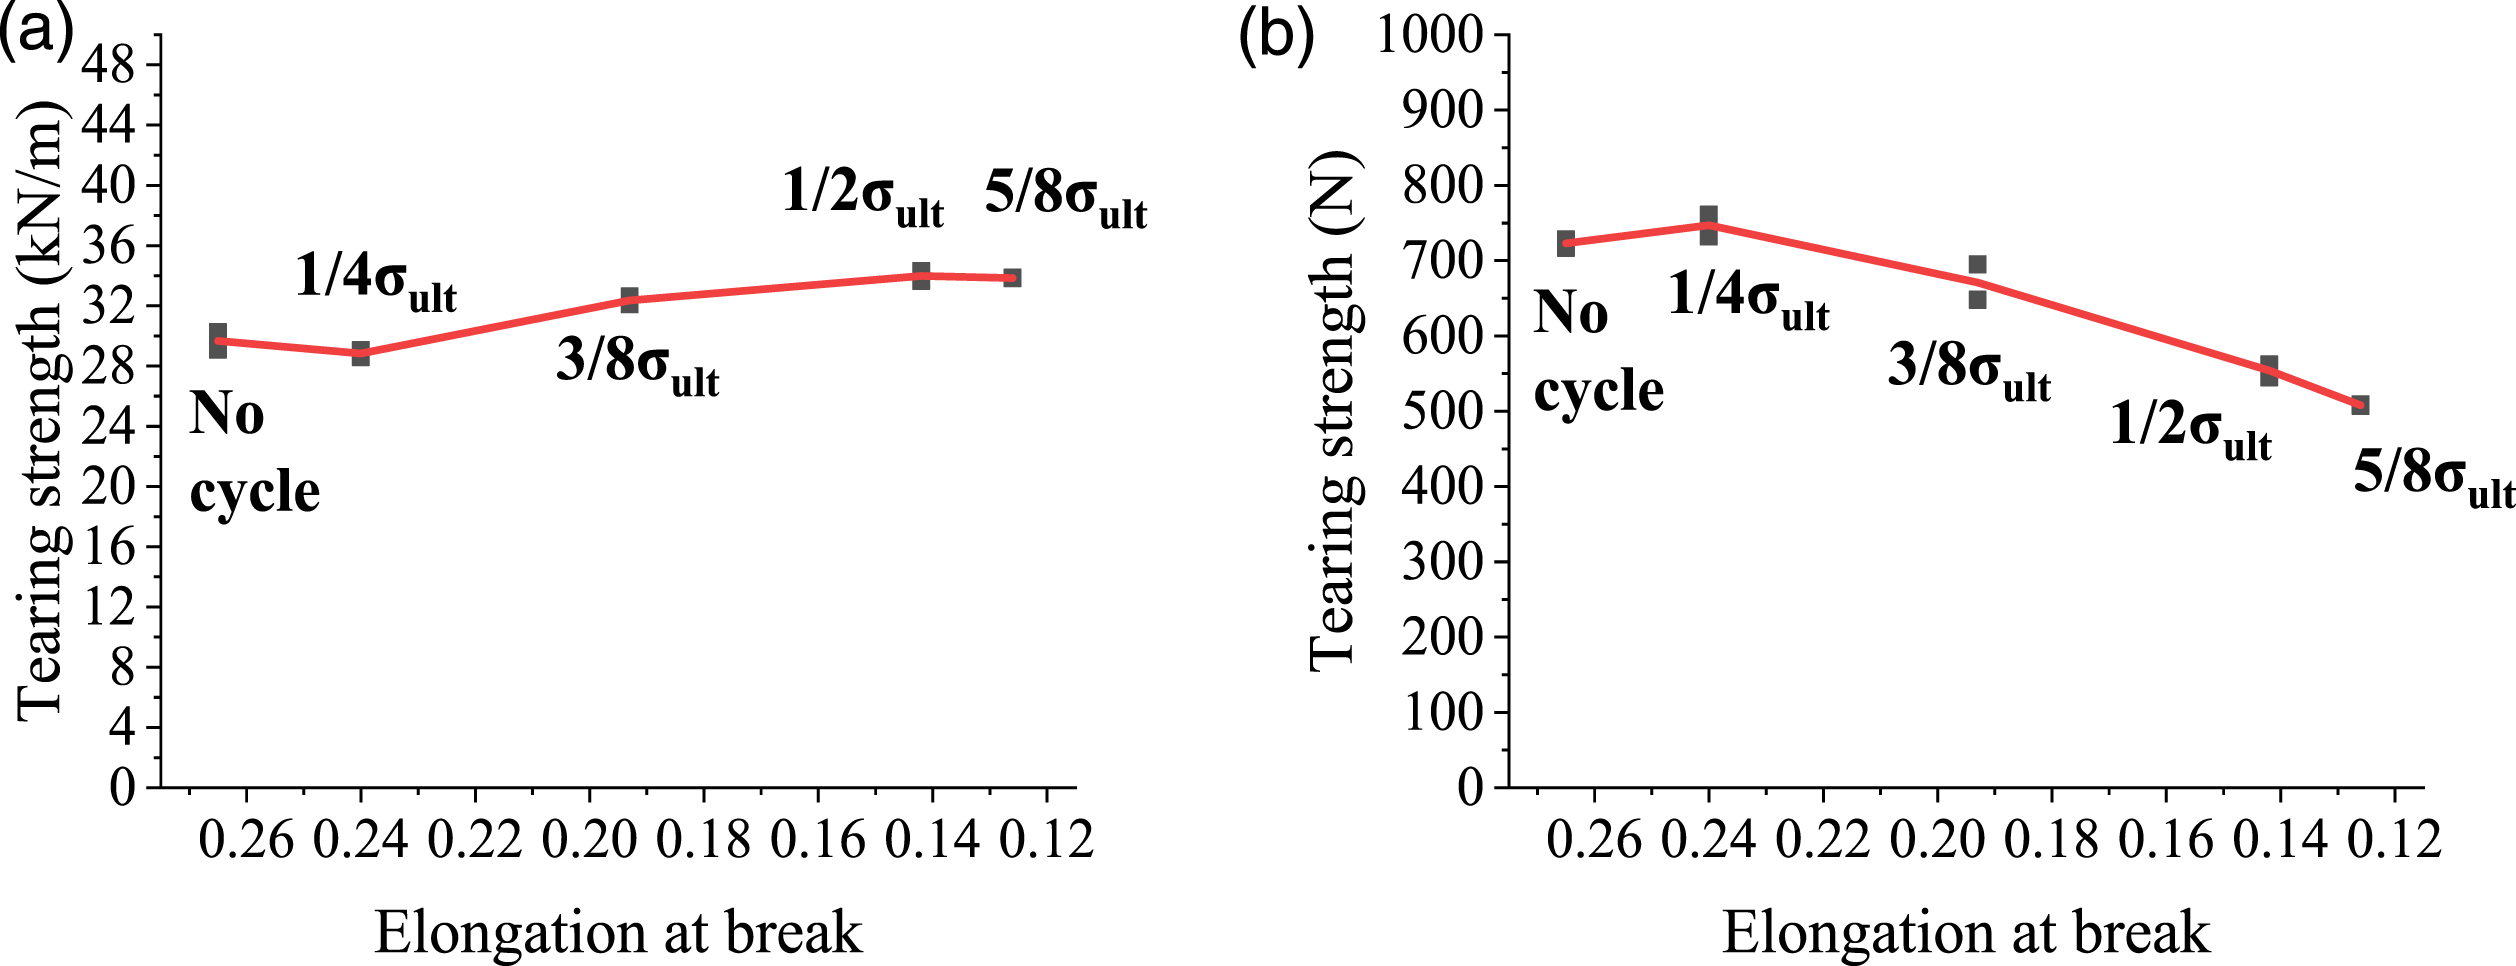
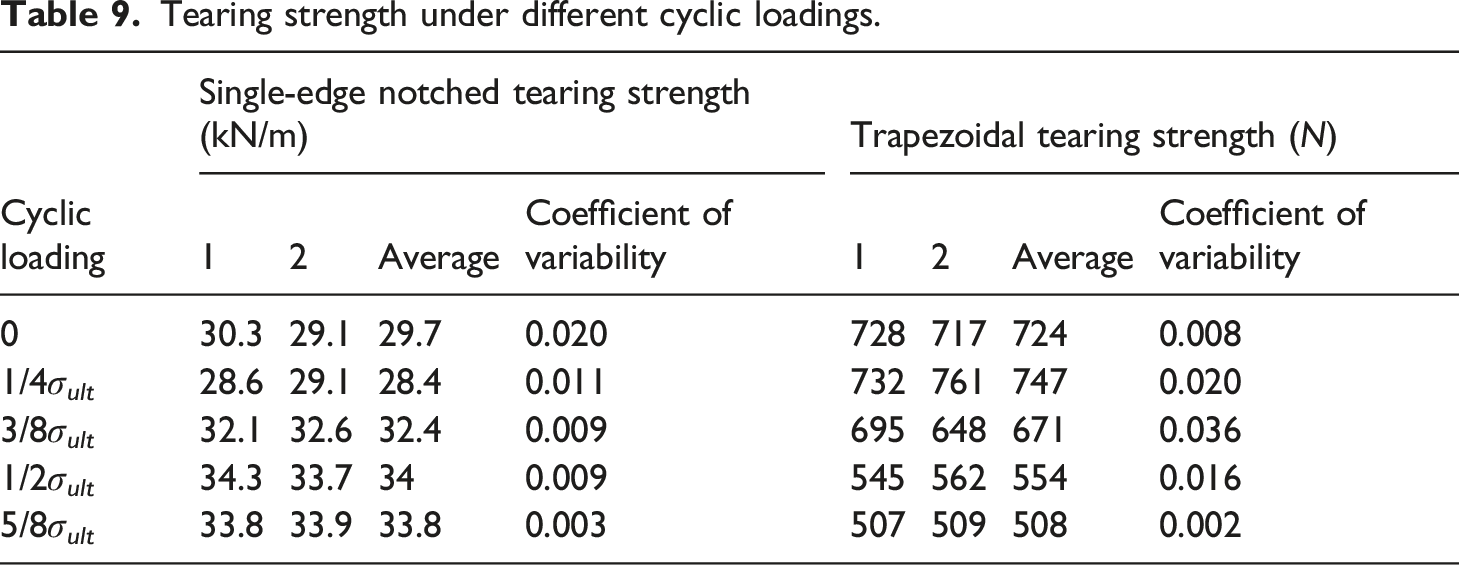
The tearing tests were conducted on a single-edge notched specimen S-warp-6-22 and trapezoidal tearing specimen T-warp-16-32, which were made from uniaxial tensile specimens after cyclic tension. The test results are presented in Figure 16, Figure 17 and Table 9. Figure 16 displays the typical single-edge notched and trapezoidal tearing test curves after cyclic tension. Figure 17 displays the relationship curves of the single-edge notched tearing strength and trapezoidal tearing strength with the decrease in elongation at break after cyclic tension. The specific results are summarized in Table 9. Based on the above results, it was determined that with a decrease in the elongation at break, the stiffness of the single-edge notched specimen represented by the slope of the tearing curve increased significantly, whereas the overall change in the corresponding tearing strength was not significant. Conversely, the effect of elongation at break on the trapezoidal tearing strength was more apparent than the specimen stiffness. Specifically, when the cyclic tension changed from zero to 5/8σ
ult
, the elongation at break decreased by 52.5% and the single-edge notched tearing strength increased by only 12.3%, whereas the trapezoidal tearing strength decreased by 42.5%. Tearing curves after cyclic tension: (a) single-edge notched tearing test and (b) trapezoidal tearing test. Relationship between tearing strength and elongation at break: (a) single-edge notched tearing test and (b) trapezoidal tearing test. Tearing strength under different cyclic loadings.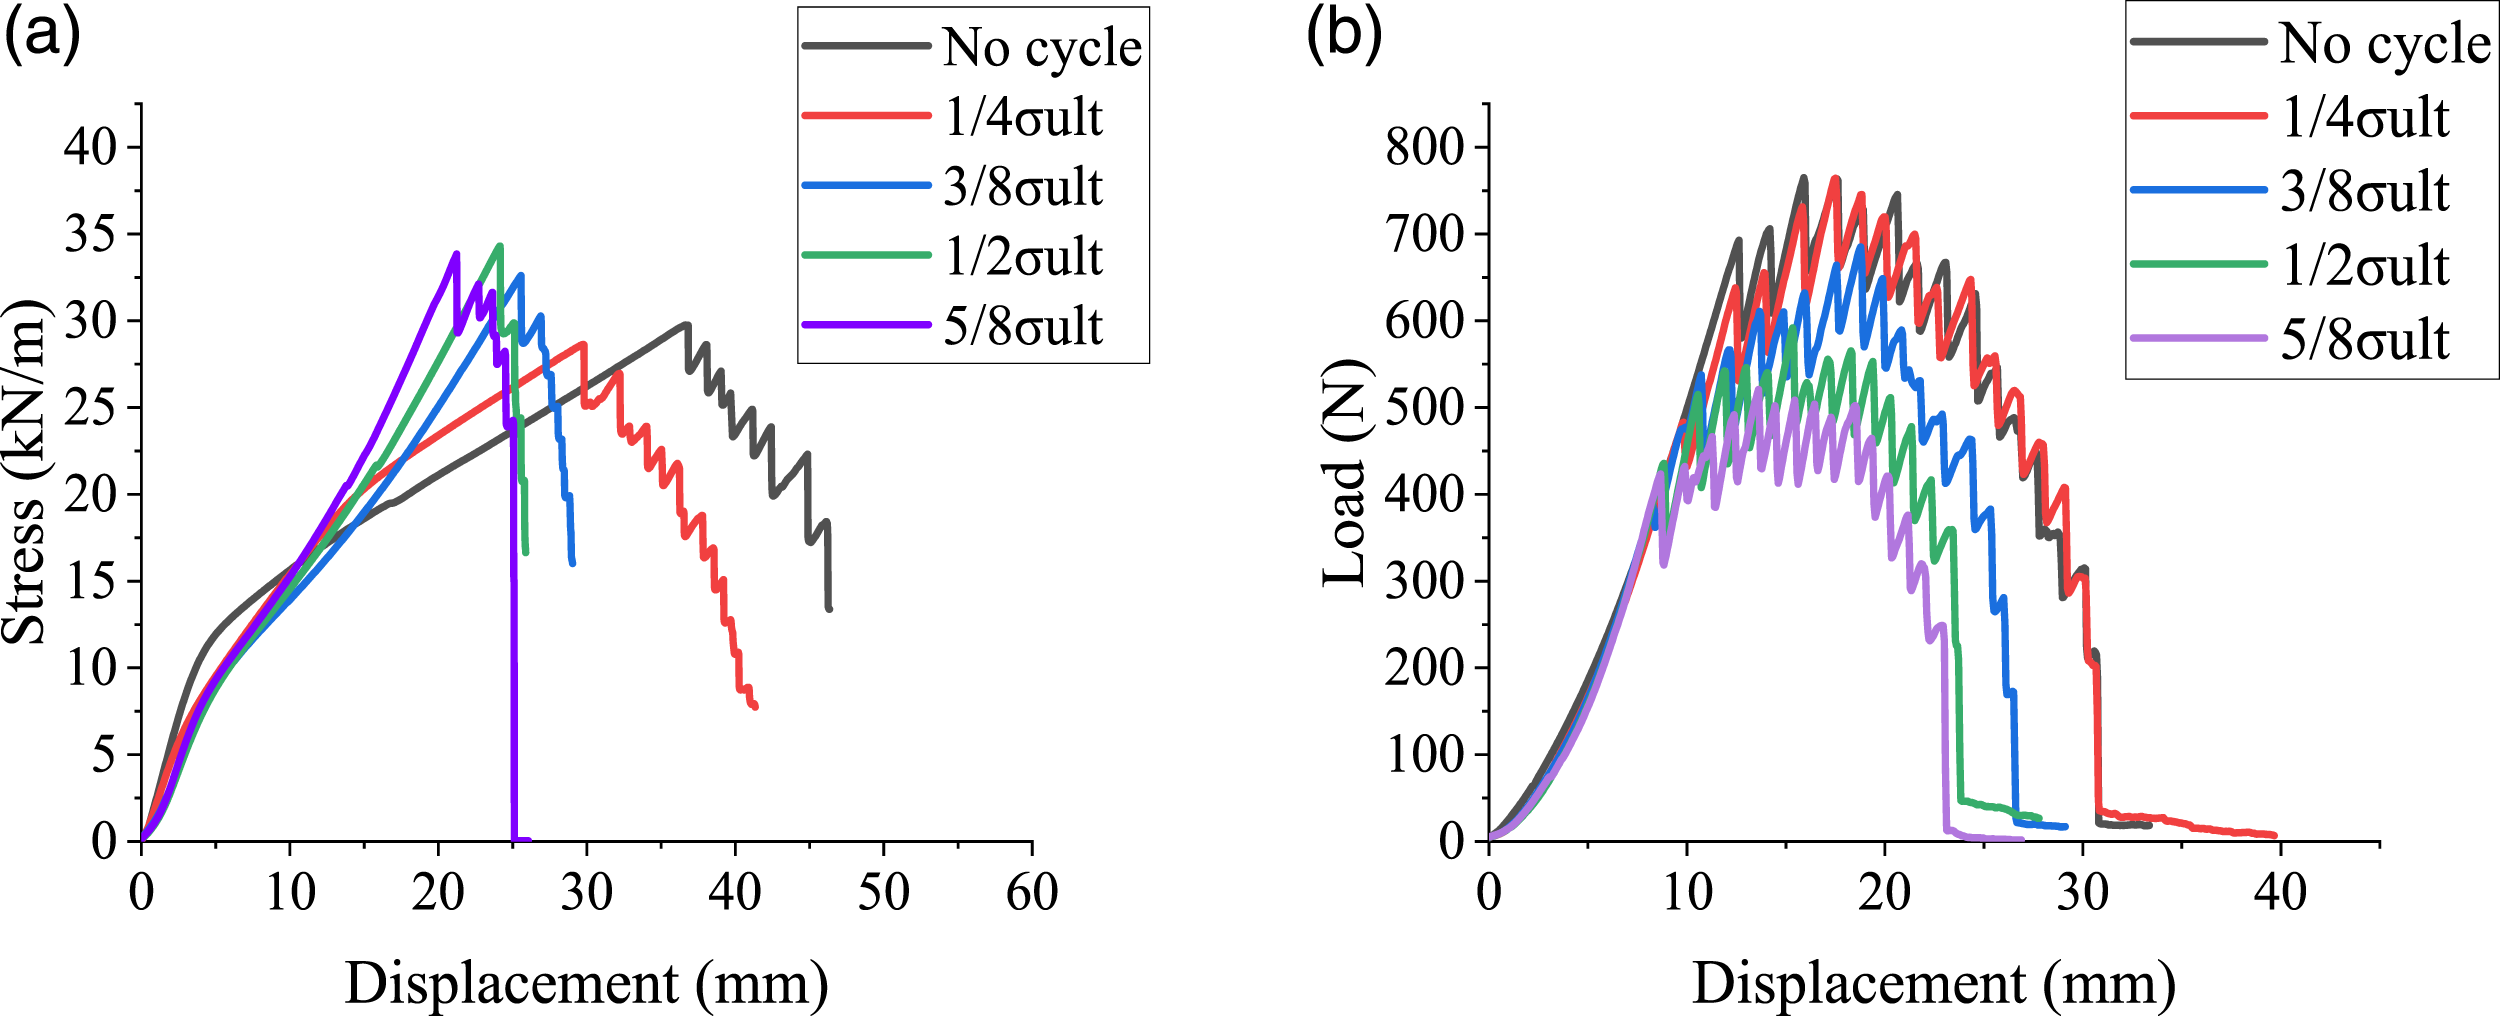
Effect of crack length on trapezoidal tearing test
The trapezoidal tearing test has been widely used in numerous standards owing to its convenient and simple specimen preparation and test process. The tearing process and bearing mechanism of the coated fabric in the trapezoidal test are displayed in Figures 18 and 19, and the typical load-displacement curves in the warp and weft directions are displayed in Figure 20. It can be observed that under an external load, the membrane surface near the crack of the trapezoidal specimen is tensed and flattened from the wrinkle state, and the yarn at the crack tip is stretched and deformed in turn, forming the tearing del-zone. Unlike the single-edge notched tearing test, only the load-bearing strip in the del-zone span bears the external load, and the membrane surface in other areas is in a state of fold relaxation. Then, with the further application of load, the del-zone increases gradually and the crack begins to propagate when the first yarn closest to the crack tip in this zone reaches the elongation at break, accompanied by the first peak and instantaneous unloading on the load-displacement curve. Subsequently, because the number of yarns in the del-zone and the width of the corresponding load-bearing strip gradually increase, the bearing capacity of the specimen is further enhanced. Consequently, the tearing curve climbs until the yarn on the other side of the specimen begins to enter the del-zone and deforms in tension; at this time, the curve reaches the maximum. Finally, the number of yarns in the load-bearing strip tends to decrease owing to the limitation of the specimen width; correspondingly, the curve begins to decline until the specimen is completely torn. Trapezoidal tearing test process: (a) initial state, (b) tearing propagation, and (c) overall destruction. Load diagram of trapezoidal tearing test. Typical load-displacement curves of trapezoidal tearing test: (a) warp and (b) weft.


The test setup of trapezoidal tearing with different crack lengths is presented in Table 5, where the trapezoidal specimens T-warp-n
c
-32 and T-weft-n
c
-32 are studied. The corresponding typical tearing load-displacement curves are displayed in Figure 21 and the relationship between the trapezoidal tearing strength and number of cutting-off yarns is displayed in Figure 22. The specific data are summarized in Table 10. Typical load-displacement curves of trapezoidal tearing tests with different number of cutting-off yarns. Relationship between trapezoidal tearing strength and number of cutting-off yarns. Trapezoidal tearing strength (N) with different number of cutting-off yarns.


The results indicate that with an increase in n c , the trapezoidal specimens have clearly different load-displacement curves and their tearing strength demonstrates a linear downward trend. The strength values in the warp and weft directions under any n c are similar. Quantitatively, when n c increases from 4 to 20, the strengths in warp and weft decrease by 42.4% and 43.5%, respectively. This is because the smaller the number of complete yarns across the crack section, the smaller the width of the load-bearing strip during tearing propagation. In conclusion, the trapezoidal tearing strength cannot be used as the specific tearing strength of the coated fabric because it is significantly influenced by the number of cutting-off yarns.
Statistical analysis of tearing resistance
In this section, various material property parameters that may be related to the tearing resistance of various membrane materials studied are summarized, so as to systematically study the influencing factors of the tearing resistance of membrane materials from the perspective of statistical analysis.
Specifically, the following Section 7.1 lists the basic mechanical parameter values of each membrane material. And since single-edge notched tearing test is often considered to be closer to the tearing behaviours in the actual membrane structure, the single-edge notched tearing strength of each membrane material are statistically analyzed in Section 7.2 and the test results are fitted with the commonly used theoretical formula, so as to evaluate the applicability of each theory. Then, on the basis of sections 7.1 and 7.2, the influence of mechanical parameters on the tearing resistance of membrane materials based on statistical theory is analyzed in Section 7.3. Finally, in Section 7.4, the correlation between the results of trapezoidal and single-edge notched tearing tests are analyzed in detail to reveal their respective applicability.
Results of membrane mechanical parameters
Summary of mechanical parameters and statistical information of membrane materials.

The mechanical parameters of the coated fabrics we studied demonstrated different characteristics. In general, the tensile strength of the membrane in the G-type membranes was marginally greater than that in the P-type membranes. However, on the contrary, the tensile strength of single yarn of G-type membrane is lower than that of P-type. This may be because although the yarn strength of glass fiber is higher than that of polyester fiber, glass fiber is more likely to be damaged during weaving, resulting in reduced strength. For other parameters, the P-type membranes indicated greater elongation at break and lower shear modulus. In particular, the trapezoidal tearing strength of P-type membrane material is significantly higher than that of G-type membrane because the former has a large elongation at break, which means a larger del-zone will be formed at the crack tip during the tearing process. In other words, the trapezoidal specimen of P-type membrane will have more yarns to bear the external load.
Single-edge notched tearing strength
(1) Test results
Results of single side tear strength test results of membrane materials.

(2) Fitting of results using formulae of tearing theories
Four commonly used tearing theories were used to fit the results of the single-edge notched tearing tests of two kinds of P-type membranes (TX30 and 250T) and two types of G-type membranes (FGT800 and Sheerfill). These theories included stress field theory, Thiele’s empirical formula, stress intensity factor theory, and Hedgepeth theory; the corresponding fitting formulas are (3)–(6)


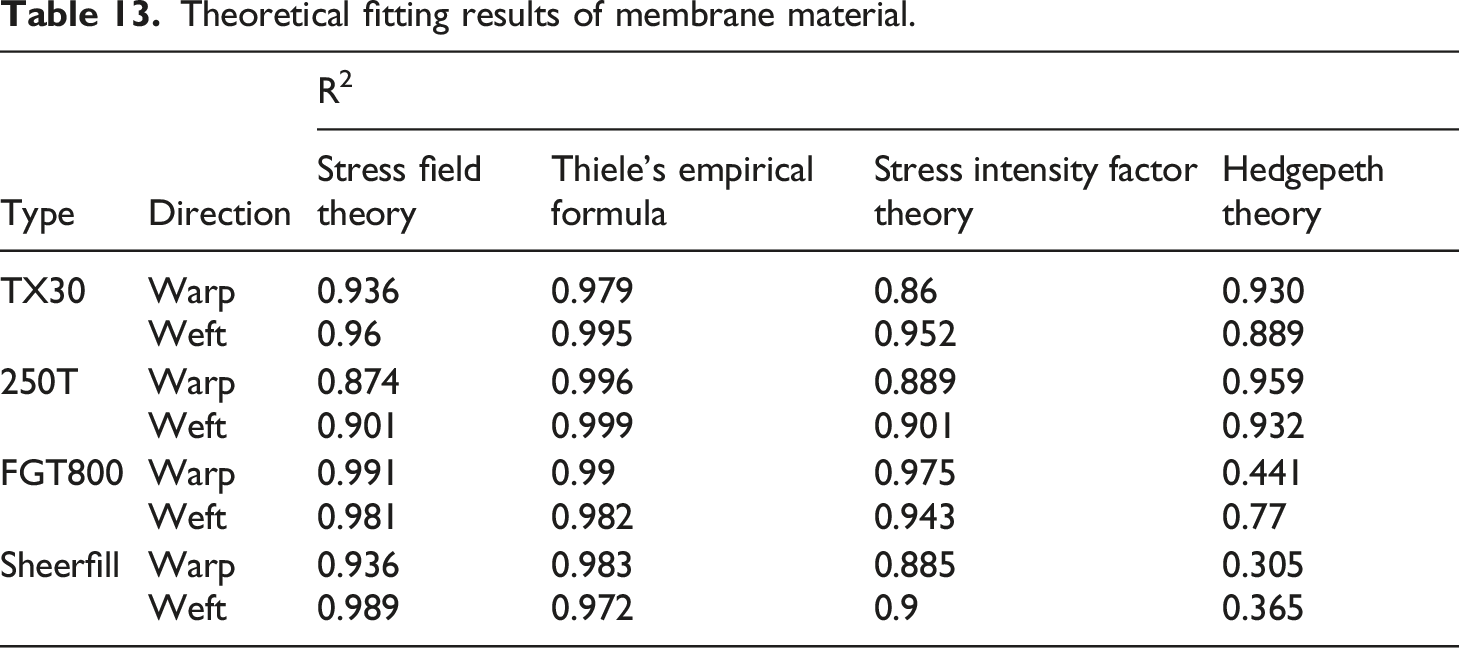
The fitting results of the above theories are displayed in Figure 23. Table 13 summarizes the values of the determined coefficient R2, which can quantitatively evaluate the fitting effect. The closer R2 is to one, the better the fitting effect. It can be observed that for the stress field and stress intensity factor theories, there was an acceptable fitting effect in the case of small cracks, whereas when the crack increased, the prediction of tearing strength tended to be less than the test values. Overall, the fitting effect of the stress field theory was superior to that of the stress intensity factor theory. The R2 value of the former was greater than that of the latter in all cases except for the warp specimens of the 250T membrane; moreover, this advantage was more apparent in the G-type membrane. Specifically, the R2 value of the stress field theory for P-type membrane materials was between 0.874 and 0.96, whereas the R2 value for G-type membrane materials increased from 0.939 to 0.991. Conversely, there was no significant difference in the fitting effect of the stress intensity factor theory between the P-type and G-type membrane materials. Fitting curves against tearing theories: (a) TX30 warp, (b) TX30 weft, (c) 250T warp, (d) 250T weft, (e) FGT800 warp, (f) FGT800 weft, (g) Sheerfill warp, and (h) Sheerfill weft. Theoretical fitting results of membrane material.
Based on the Hedgepeth theory, the fitting effect on the P-type and G-type membrane materials was considerably different. In general, the fitting error of a P-type membrane with a large crack was greater than that of a small crack. This phenomenon is obvious in TX30 weft specimen, in which when the crack length a increases from 3.1 mm to 20 mm, the fitting error also increases from 3.86% to 18.2%. However, the opposite was true for a G-type membrane. For example, in FGT800 warp specimen, when the crack length a increases from 2.85 mm to 19.95 mm, the fitting error decreases from 29.2% to 12.6%. Moreover, the fitting effect for a G-type membrane was clearly worse than that for a P-type membrane. The R2 value for P-type membranes was between 0.889 and 0.959, whereas for G-type membranes, the R2 value of the other membrane materials was typically less than 0.5. This error is mainly the result of the assumption that the membrane material is completely linearly elastic and ignores its strong nonlinear material properties. The stress concentration factor obtained at the end is not related to the material properties, which is also clearly unreasonable.
Finally, for Thiele’s empirical formula, the fitting accuracy was extremely high for both P-type and G-type membrane materials with large or small slits. The R2 value was between 0.972 and 0.999. This could be because there were two undetermined parameters to be fit in the empirical formula, which was more than other theories; hence, there was more room for adjustment.
In conclusion, based on the current statistical data, Thiele’s empirical formula can be considered to be the most appropriate formula for predicting the single-edge notched tearing strength of coated fabric at any crack length.
(3) Summary analysis
Based on the above conclusion, Thiele’s empirical formula was used to describe the relationship between the single-edge notched tearing strength and crack length of the eight membranes, as displayed in Figure 24. Summary of fitting curves of single-edge notched tearing strength against Thiele’s empirical formula.
It can be observed that, in general, the change trend of each curve was uniform. When the crack was small, when a is less than about 10 mm, the tearing strength of the P-type and G-type membrane materials decreased sharply with an increase in the crack length, whereas when the crack was long, the decline in the tearing strength gradually tended to be flat. As long as the crack length is the same, if the single-edge notched tearing strength of membrane A is higher than that of B in the case of small crack, this trend remains with the increase of crack length. Generally speaking, the ranking of single-edge notched tearing strength between different membranes will not be affected by the crack length, which made it possible to compare the single-edge notched tearing resistance of the membrane materials under any crack length. Finally, for these eight membrane materials, the single-edge notched tearing strength of the G-type membrane was typically greater than that of the P-type membrane, the relationship between the two is about 1.7 times, whether the crack is large or small.
(4) Definition of standard single-edge notched tearing strength
Standard single-edge notched tearing strength of membranes (kN/m).
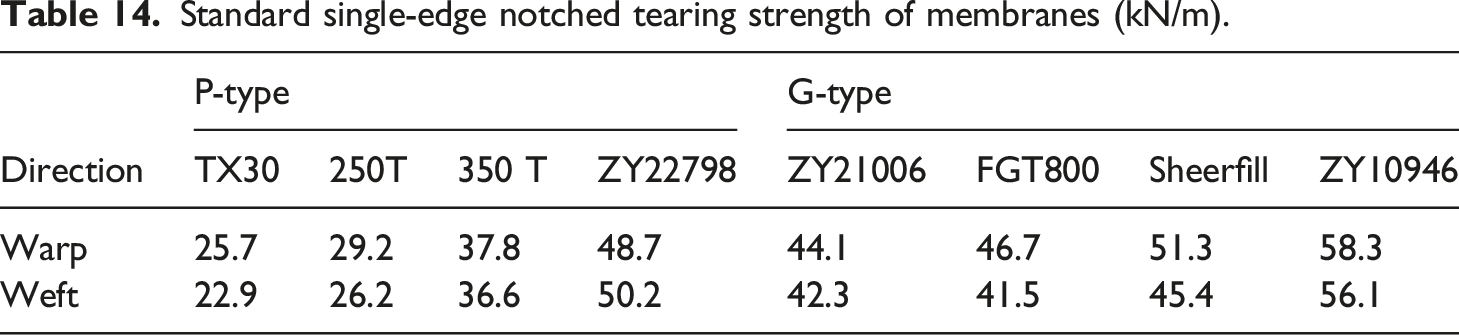

Histogram of standard single-edge notched tearing strength in (a) P-type and (b) G-type.
Study on influencing factors of tearing resistance
Trapezoidal and single-edge notched tearing strengths are comprehensive indices reflecting the tearing resistance of a coated fabric. They are influenced by numerous factors including the specimen configuration, test method, and mechanical parameters. The study of the effects of crack length and elongation at break were introduced in this study. Other studies have been conducted on the tensile strength of membranes and other factors. However, at present, research on the influence of the basic mechanical parameters on tearing strength has been neither systematic nor comprehensive, and has lacked the support of a variety of membrane test data. In this section, the correlation between the tensile strength of a single yarn, elongation at break, shear modulus, trapezoidal tearing strength, and single-edge notched tearing strength of coated fabric is systematically studied using statistical theory tools.
There are numerous methods available to investigate the correlation between two variables in statistics, among which the Pearson correlation coefficient method is most commonly used. For two variables X and Y, the calculation formula for the Pearson coefficient is as follows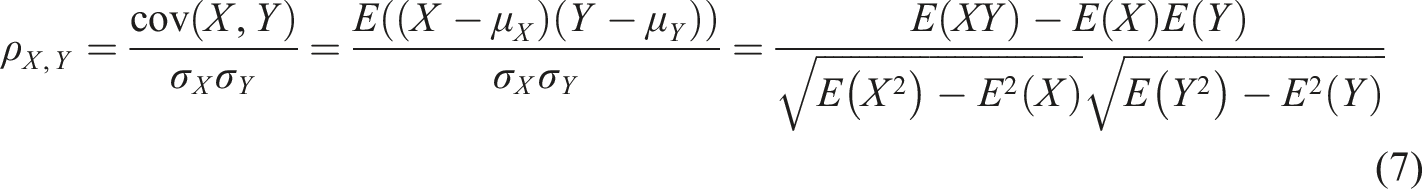
Based on the formula, the coefficient is equal to the covariance cov (X, Y) between variables X and Y divided by their respective standard deviations σ X and σ Y . The value of the coefficient is always between “-1.0” and “1.0”. When it is near “0”, variables X and Y are considered to have no correlation. When it is close to “1” or “-1”, the variables X and Y are considered to have a strong correlation. In this section, the Pearson coefficient method is used to study the influencing factors of tearing resistance.
Based on Table 11 and Table 14, the relationships between the tensile strength of a single yarn, elongation at break, shear modulus, trapezoidal tearing strength, and single-edge notched tearing strength of P-type and G-type membrane materials are plotted as scatter diagram in Figures 26–28. Pearson correlation coefficients were calculated and are summarized in Table 15. The P-type and G-type are investigated because there are significant differences between their substrate and coating, whereas the warp and weft directions are processed together and not discussed separately. Scatter diagram of correlation between tensile strength of single yarn and (a) trapezoidal tearing strength in P-type membrane, (b) single-edge notched tearing strength in P-type membrane, (c) trapezoidal tearing strength in G-type membrane, and (d) single-edge notched tearing strength in G-type membrane. Scatter diagram of correlation between elongation at break and (a) trapezoidal tearing strength in P-type membrane, (b) single-edge notched tearing strength in P-type membrane, (c) trapezoidal tearing strength in G-type membrane, and (d) single-edge notched tearing strength in G-type membrane. Scatter diagram of correlation between shear modulus and (a) trapezoidal tearing strength in P-type membrane, (b) single-edge notched tearing strength in P-type membrane, (c) trapezoidal tearing strength in G-type membrane, and (d) single-edge notched tearing strength in G-type membrane. Summary of Pearson correlation coefficients between different variables.
a
aBased on general experience, the absolute value of the Pearson correlation represents the following: 0.8–1.0 very strong correlation. 0.6–0.8 strong correlation. 0.4–0.6 moderate correlation. 0.2–0.4 weak correlation. 0–0.2 very weak correlation or no correlation.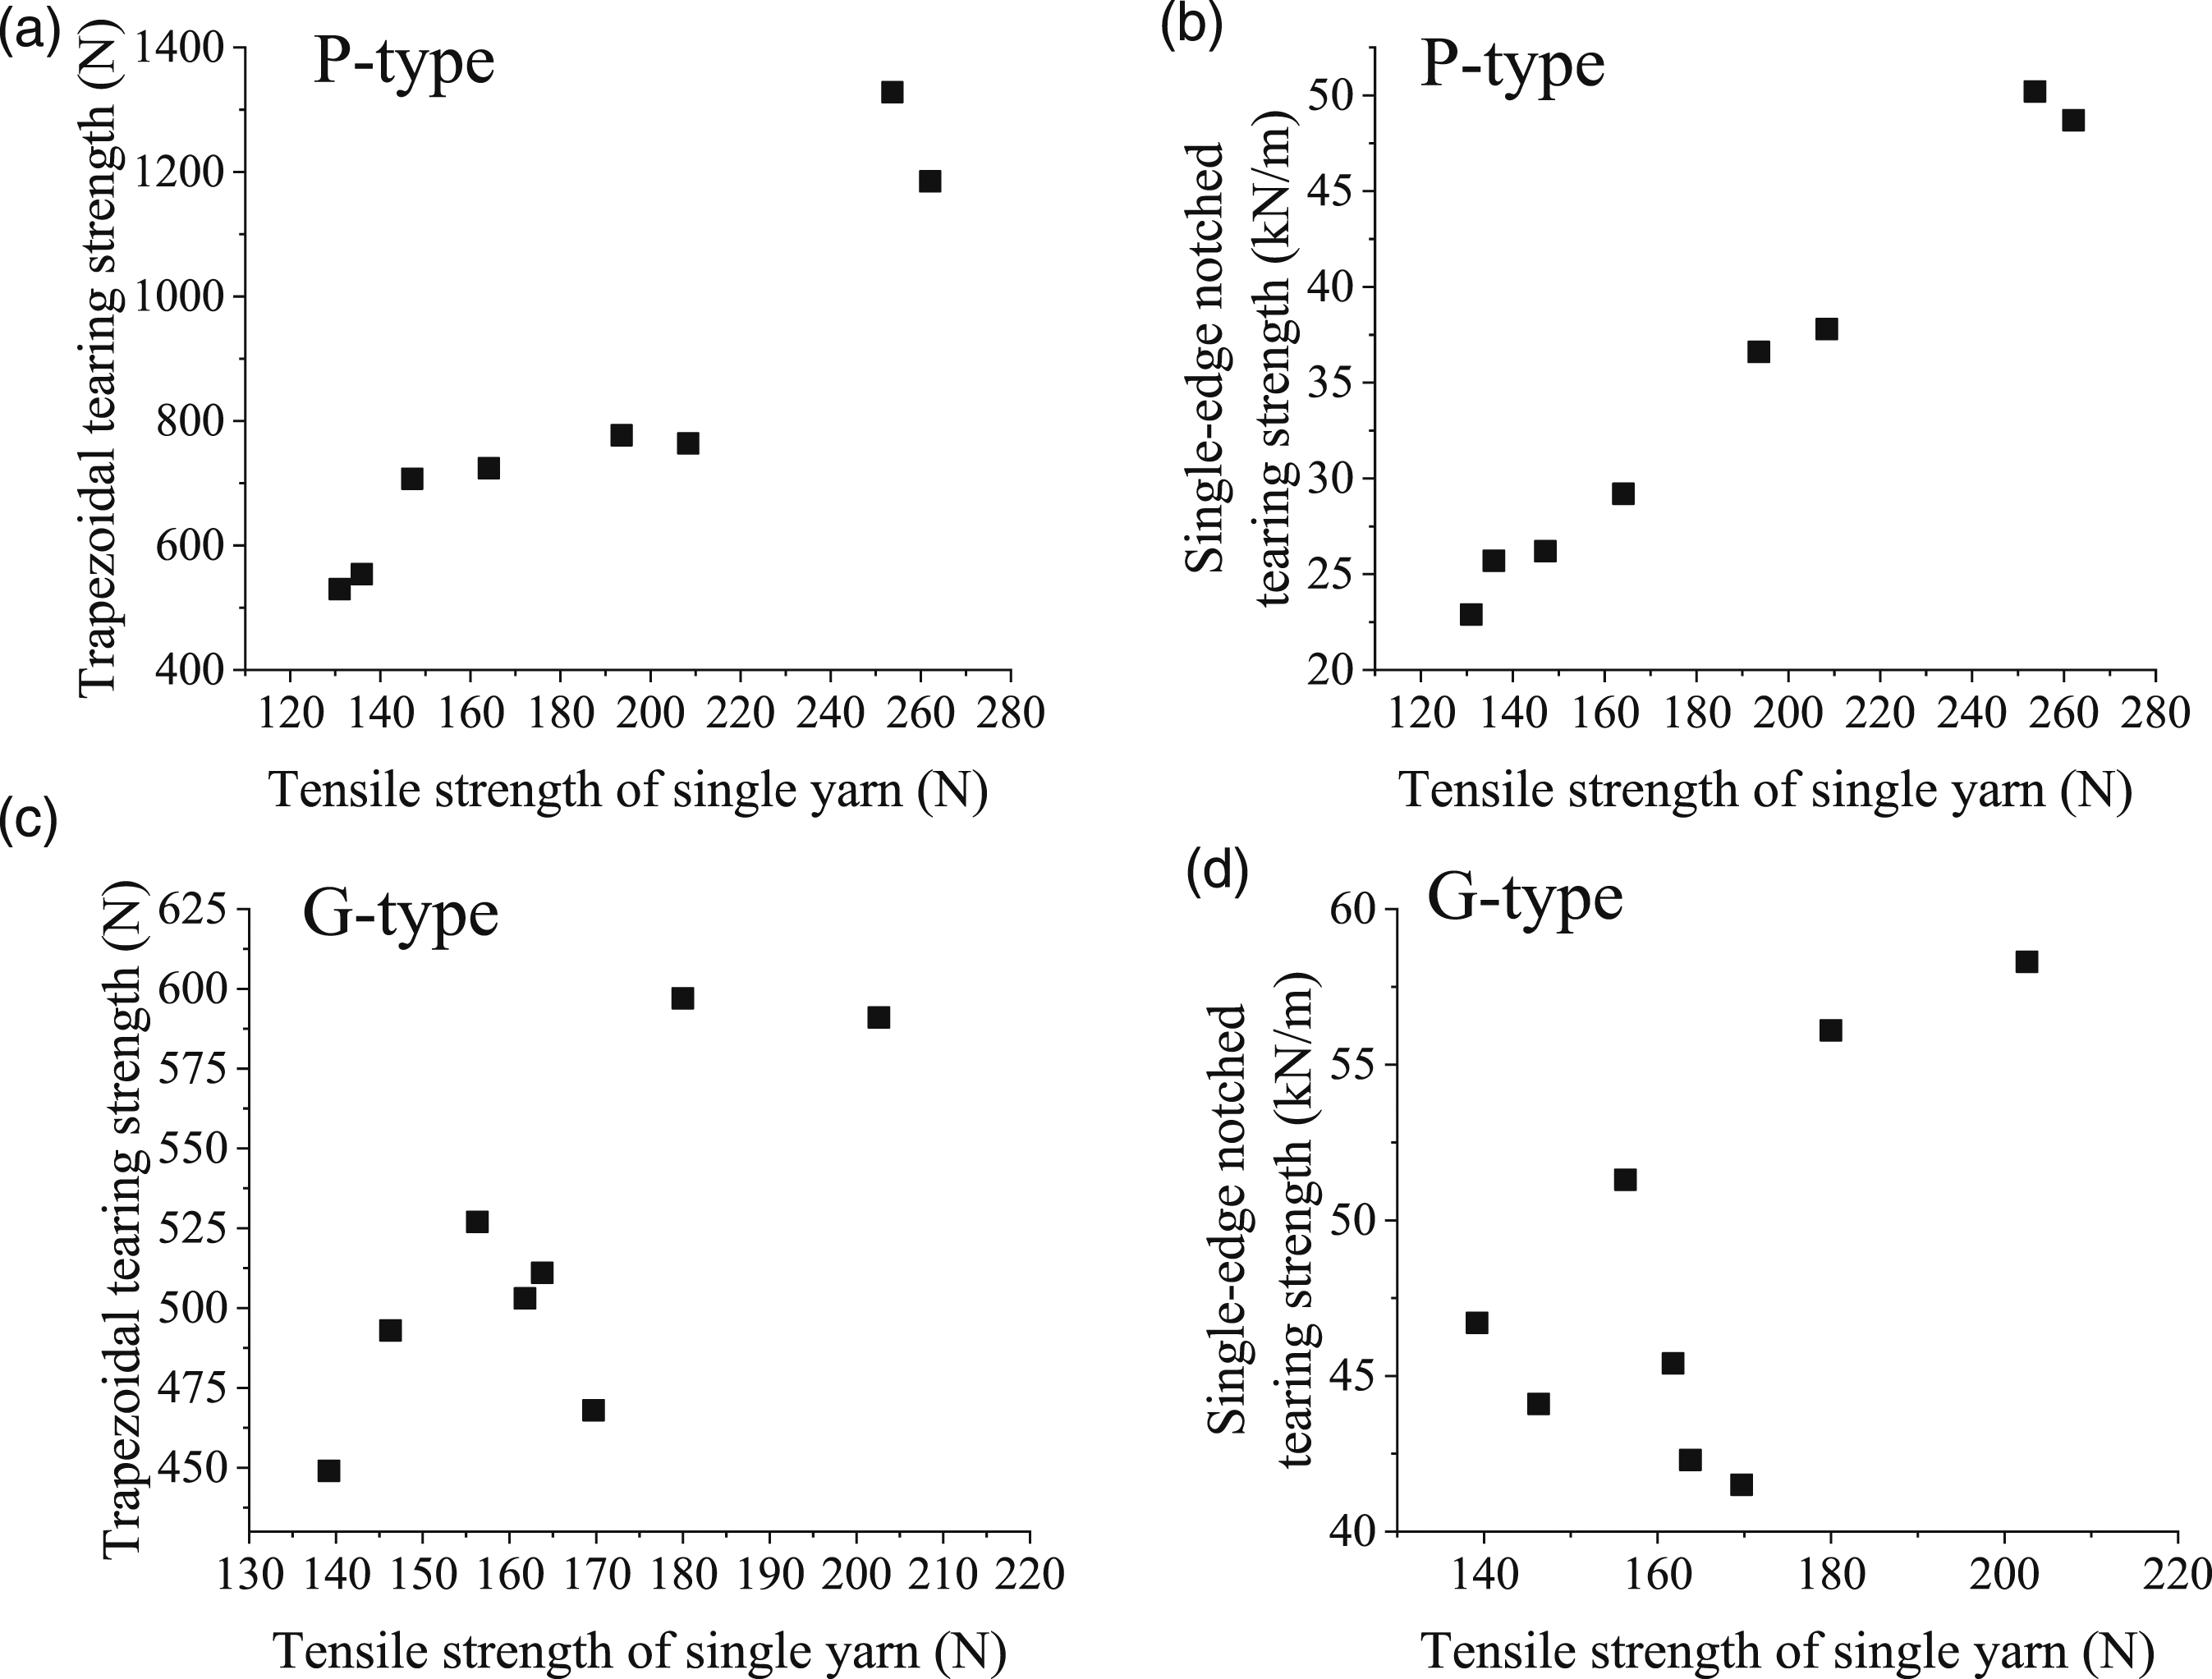


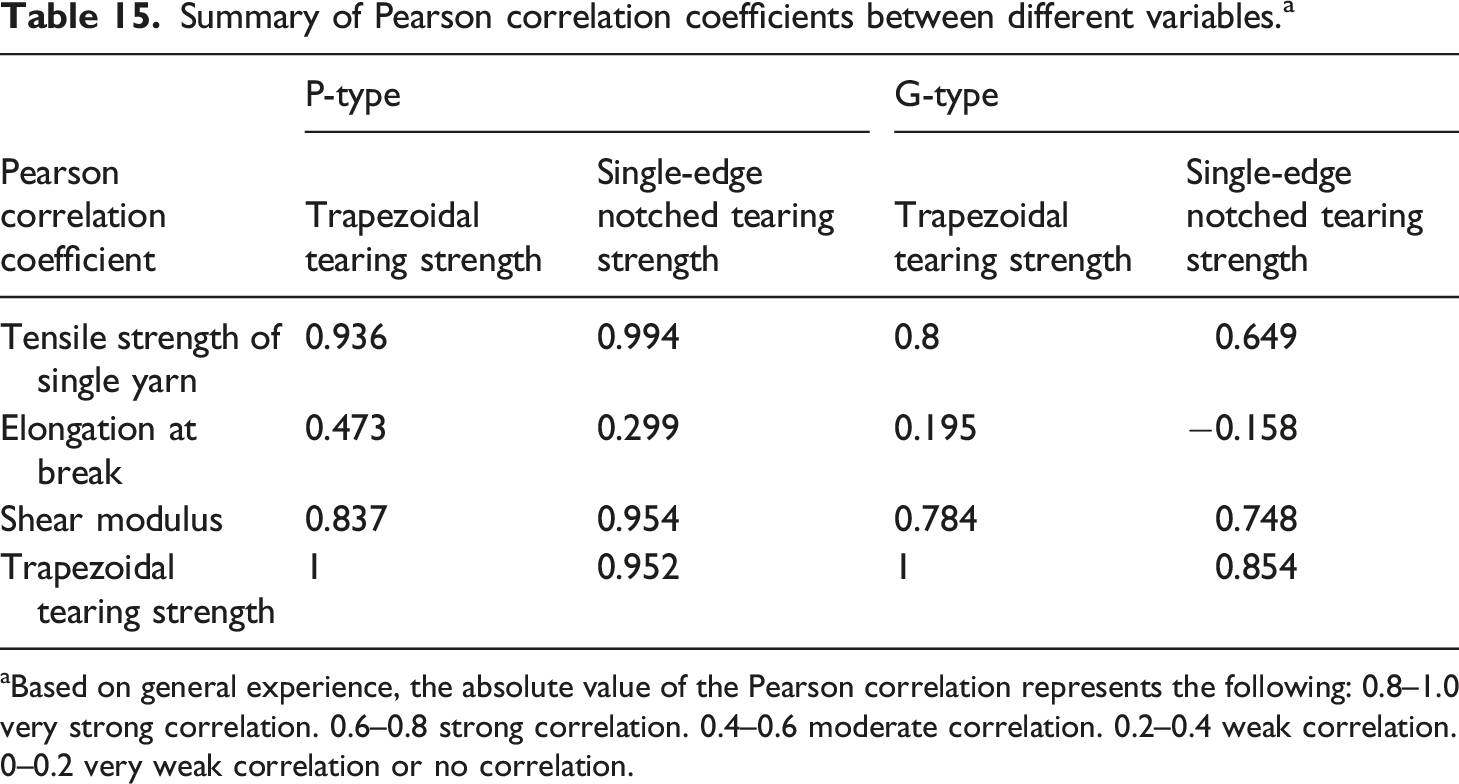
It can be seen from Figure 26 and Table 15 that the Pearson coefficient between the tensile strength of a single yarn and the trapezoidal tearing strength is 0.936, and for the single-edge notched tearing strength, this coefficient is also as high as 0.994. This means that they are highly positively correlated and the strength of a single yarn has a leading role in the tearing resistance of the P-type coated fabric. The strong correlation is due to the fact that the tearing propagation starts from the breaking of the yarn closest to the crack tip in the del-zone; thus, the greater the tensile strength of the yarn, the greater the tearing strength of the membrane. For G-type membrane materials, the relationship between the tensile strength of a single yarn and trapezoidal tearing strength, and the single-edge notched tearing strength remains strong; the corresponding coefficients are 0.8 and 0.627, respectively. Some scholars have also revealed the positive correlation between the tensile strength and the tearing strength of membrane materials through theoretical formula derivation and experimental research.13,32 And the Pearson values of G-type fabric are marginally less than that of the P-type fabric because the tensile strength of a single yarn, trapezoidal tearing strength, and single-edge notched tearing strength of the different types of G-type have little difference, except for ZY10946; the correlation calculation is significantly influenced by the test error, and the regularity between the tensile strength of a single yarn and the tearing strength is not obvious. However, overall, the tensile strength of a single yarn continues to have a significant effect on the tearing resistance of the G-type fabric.
For the elongation at break, the corresponding correlation scatter diagrams and values are displayed in Figure 27 and Table 15. It can be observed that the correlation between elongation at break and trapezoidal tearing strength is stronger than that between elongation at break and single-edge notched tearing strength. Combined with the conclusion in Section 5, we can conclude that elongation at break has a greater effect on the trapezoidal test than the single-edge notched test; however, compared with the tensile strength of a single yarn, the effect of the elongation at break is not dominant. For G-type membranes, the correlation coefficients between the elongation at break and trapezoidal tearing strength, and single-edge notched tearing strength are extremely small. This is also because the elongation at break of the different G-type membrane materials investigated is small and close, therefore, the numerical order of their elongation at break will be affected by test errors, such as the discreteness of test results, rather than being particularly clear.
For the shear modulus, it can be observed that the correlation coefficients between the shear modulus and two types of tearing strength indexes are high for both P-type and G-type membrane materials. This is only a preliminary conclusion because the value of the shear modulus does not distinguish between warp and weft, leading to limited data points in the scatter diagram. However, it can be determined from Table 11 that the tensile strength of a single yarn in the warp and weft directions of the ZY10946 G-type and 350T P-type membranes are close, and the effect of the elongation at break on the single-edge notched tearing strength can be neglected. Therefore, it can be concluded that an improvement in the shear modulus can significantly enhance the tearing resistance of a fabric because the shear modulus of ZY10946 is approximately twice that of 350T, and the single-edge notched tearing strength of ZY10946 is approximately 1.5 times that of 350T.
Correlation between trapezoidal and single-edge notched tearing strength
The trapezoidal tearing strength obtained from the trapezoidal test with a 25 mm crack has been adopted into the Chinese standard DG/TJ08-2019-2007
4
to characterize the tearing resistance of a coated fabric. However, based on Section 3.4, it can be found that the trapezoidal tearing strength varies with the crack length, and the tearing failure mode of the trapezoidal specimen is different from that of the actual membrane structure. Therefore, the specific tearing strength of a coated fabric cannot be obtained from the trapezoidal test. Whether the trapezoidal tearing strength can be used as a comparative index of tearing resistance between different membrane materials is the focus of this section. As a simplified form of uniaxial central tearing test, it is generally believed that the single-edge notched tearing test is closer to the tearing failure mode of the actual membrane structure than the trapezoidal test. Therefore, the corresponding single-edge notched tearing strength can better reflect the tearing resistance of architectural membrane materials compared with the trapezoidal tearing strength. However, the correlation and substitutability between them must be further studied. A scatter diagram of the correlation between the trapezoidal tearing strength and single-edge notched tearing strength of the eight membrane materials studied above is displayed in Figure 29; the corresponding correlation coefficient can be obtained in Table 15. It can be observed that the trapezoidal tearing strength is highly positively correlated with the single-edge notched tearing strength for P-type and G-type membrane materials, with correlation coefficients are as high as 0.952 and 0.842, respectively. This is because these two tearing strengths have common influencing factors, that are, the strength of a single yarn and the shear modulus of the membrane material. This means that although the standard trapezoidal tearing strength obtained based on the code is not the specific tearing strength of the membrane material, it can be used as an internal comparison index of P-type and G-type fabrics to compare the tearing resistance of the membrane. Scatter diagram of correlation between trapezoidal tearing strength and single-edge notched tearing strength in (a) P-type membrane and (b) G-type membrane.
However, the trapezoidal tearing strength is not suitable for comparing the tearing resistance between the P-type and G-type membranes. As indicated in Figure 22, the trapezoidal strength of the P-type membrane is typically greater than that of the G-type membrane, whereas Figure 25 indicates that the single-edge notched tearing strength of the P-type membrane is typically less than that of the G-type membrane. Therefore, on the premise that the single-edge notched strength can better characterize the tearing resistance of the coated fabric, when the trapezoidal tear strength is used to compare the tearing resistance of P-type and G-type membranes, incorrect conclusions could be obtained. Specifically, referring to Table 11 and Table 14, the tearing resistance of the 250T P-type membrane is superior to that of the FGT800 G-type membrane because the trapezoidal tearing strength of the former is approximately 1.5 that of the latter. In fact, the actual tearing resistance of 250T could be significantly worse than that of FGT800 because the single-edge notched tearing strength of the former is only 60% of that of the latter.
In summary, it can be concluded that when the membrane materials for tearing resistance comparison are limited to a certain type, that is, all P-type membranes or all G-type membranes, the traditional trapezoidal tearing strength is worth recommending as an evaluation index. When the tearing resistance between the P-type and G-type membranes is compared, the trapezoidal strength is no longer applicable and should be measured by the single-edge notched strength.
Conclusions
In this study, the influencing factors and evaluation methods of the tearing resistance of coated fabric membranes were systematically studied. The effects of the tensile strength of a single yarn, elongation at break, shear modulus, and crack length on the trapezoidal tearing strength and single-edge notched tearing strength were investigated. The rationality and limitations of using standard trapezoidal tearing strength as an evaluation index to compare the tearing resistance of different membrane materials were analyzed. The following conclusions can be drawn. 1. The shear moduli of the 250T P-type and FGT800 G-type membranes at different stress levels were measured by uniaxial shear tests. It was found that the stress level had a significant influence on the shear modulus of the 250T membrane. When the stress level changes from 3 kN/m to 12 kN/m, the shear modulus also increases by about three times. However, the shear modulus of the FGT800 membrane was relatively stable at different stress levels and was always about 3–6 times that of the 250T membrane. These conclusions may be generalized to general P-type and G-type membrane materials. 2. For a 250T P-type membrane, the elongation at break of the membrane could be significantly reduced by cyclic tension on the premise of maintaining the tensile strength unchanged. Based on this, single-edge notched and trapezoidal tearing tests were performed. It was found that with a decrease in the elongation at break, the single-edge notched tearing strength was not significantly influenced; however, the trapezoidal tearing strength was significantly reduced. Specifically, when the cyclic tension changed from zero to 5/8σ
ult
, the elongation at break decreased by 52.5% and the single-edge notched tearing strength increased by only 12.3%, whereas the trapezoidal tearing strength decreased by 42.5%. 3. The mechanism of the trapezoidal test was significantly different from that of the single-edge notched test. The load-displacement curve of the trapezoidal test first increased and then decreased after crack propagation, and its tearing strength was significantly influenced by the crack length. For 250 T P-type membranes, the trapezoidal tearing strength virtually linearly decreased with the increase in crack length. Quantitatively, when the number of cutting-off yarns n
c
increases from 4 to 20, the strengths in warp and weft decrease by 42.4% and 43.5%, respectively. And the obtained tearing results in the warp and weft directions were extremely close. This means that the specific tearing strength of a coated fabric could not be obtained using the trapezoidal test. 4. Based on statistical theory, the correlation between the mechanical parameters of four types of P-type and four types of G-type coated fabrics was studied, including single-edge notched tearing strength, trapezoidal tearing strength, tensile strength of single yarn, elongation at break, and shear modulus. The relationship between the single-edge notched tearing strength and crack length was fit using four common tearing theories. Thiele’s empirical formula was found to be the most suitable formula for predicting the tearing strength of coated fabrics. As long as the crack length is the same, if the single-edge notched tearing strength of membrane A is higher than that of B in the case of small crack, this trend remains with the increase of crack length. Generally speaking, the ranking of single-edge notched tearing strength between different membranes will not be affected by the crack length. For example, when the crack length was increased from 2 mm to 20 mm, the tearing strength of Shearfill membrane was always greater than that of 250T membrane under the same crack length. The elongation at break had a greater effect on the trapezoidal tearing strength than the single-edge notched tearing strength, whereas the tensile strength of a single yarn and shear modulus had significant effects on both. Trapezoidal tearing strength can be used as a comparison index of internal tearing resistance of P-type and G-type fabrics, respectively; however, it is not suitable for comparison of the tear resistance between these two types of membranes.
In future research, relevant test equipment will be designed to study the influence of biaxial stress on the shear properties of membrane materials. This is because the shear modulus has an important influence on the tearing resistance of the coated fabric and the biaxial stress is closer to the stress state of the membrane surface in the actual structure. In Section 7, additional types of membrane materials could be introduced for the statistical analysis to provide more reliable and in-depth conclusions, suggestions, and guidance for the reasonable consideration of tearing damage in coated fabric weaving and membrane structure design.
Footnotes
Acknowledgements
The authors thank Zhejiang Huifeng New Materials Corp., Ltd, for providing the membrane materials.
Declaration of conflicting interests
The author(s) declare no potential conflicts of interest with respect to the research, authorship, and/or publication of this article.
Funding
The authors wish to disclose receipt of the following financial support for the research, authorship, and/or publication of this article. This work was funded by the National Science Foundation of China through research project No. 51778458.