
Abstract
2.5D structures have received attention because of their excellent interlaminar mechanical properties. However, there is a lack of research on impact progressive damage, damage mechanisms and internal damage morphology. This paper investigated the low-velocity impact behavior and damage mechanisms of 2.5D woven carbon/epoxy composites through a couple of numerical-experimental approach. Two different impact energy levels, 15 J/mm and 20 J/mm, were designed for all the samples using drop weight impact equipment. Then Micro-CT was employed to identify the impact damage volumes and damage distribution of 2.5D woven composites. A novel whole-local finite element model was proposed based on the tests results and Micro-CT images. The experimental results indicated that the impact energy has a significant effect on the damage modes of 2.5D woven composite. Moreover, the numerically predicted mechanical curves and damage modes exhibit good consistency with the experimental results. Importantly, the numerical simulation results showed that the damage mode of 2.5D woven composites under impact energies of 15 J/mm was mainly controlled by yarn-matrix debonding. With the increase of impact energy per unit thickness, the dominated failure mode of 2.5D woven carbon/epoxy composites changes from yarn-matrix debonding to delamination and eventually to yarn breakage.
Highlight
1. The main damage mode of the 2.5D woven carbon/epoxy composites changes from yarn-matrix debonding to yarn fracture as the impact energy increases (from 15 J/mm to 20 J/mm). 2. The macro-macro hybrid finite element model effectively ensures the accuracy of the simulation results for the low-velocity impact response of 2.5D carbon/epoxy woven composites and improves the efficiency of the simulation. 3. Micro-CT can be used to obtain damage patterns within the 2.5D woven carbon/epoxy composites and to isolate damage areas.
Introduction
2.5D woven composites, as a special type of three-dimensional woven structure, have been increasingly incorporated into the aerospace industry 1 and the automotive industry owing to their excellent interlayer properties, high specific strength, and good impact damage tolerance. In those service conditions, the low-velocity impact is the common form of loading, which can cause complex internal damage. Also, 2.5D woven composites are highly anisotropic. As a result, it is difficult to evaluate the progressive damage process 2 of 2.5D woven composites subjected to impact loadings by macroscopic experimental and homogeneous numerical simulating approach. 3 Hence, a reliable finite element method (FEM) linking the detailed experiment will be of great value for a better design.
A number of experimental studies have been conducted to understand the low-velocity mechanical behaviors and damage mechanisms of 2.5D woven composites. The previous studies indicated that the low-velocity impact properties of 2.5D woven composites are sensitive the component materials, structural parameters, and impact energy or impact velocity.4–6 These investigations mainly have focused on the relationship between fabric architectures and macro-scale mechanical properties. However, the internal damages are usually difficult to identify, extract and quantify. Recently, X-ray computed tomography (Micro-CT) has started to be employed to investigate the internal damage morphology and damage mechanisms of composite material.7–16 Unlike SEM and FE-SEM,17,18 micro-CT can be used for the scanning of internal structures and damage. For example, Zhang et al.7,8 identified the damage volume and damage distributions of 3D woven composites on-axis and off-axis samples subjected to the low-velocity impact and shear progressive damage by using micro-CT technology. They concluded from micro-CT images that the off-axis samples showed larger damage volume and out-of-plane deformation compared to on-axis samples. The ultimate strength of the on-axis samples was affected by fiber tensile damage and delamination, and the ultimate strength of the off-axis samples was affected by debonding and fiber pullout. Gerlach et al. 9 investigated the failure and damage modes at deformation response of 3D woven carbon fiber composites with different binder yarns volume by optical 3D microscopy, ultrasound, and low-resolution micro-CT, they concluded that the binder yarns volume at 3% and 6% have less influence of in-plane stiffness and have a greater influence of delamination resistance. Li et al. 10 analyzed the impact shear damage morphology of 3D woven composites by micro-CT and FEM. It revealed that the failure mode of the material changes from multiple failure modes to single failure modes with the change of external loading conditions and structural parameters. Specifically, as the strain rate increases from 1500 s-1 to 2000 s-1, the damage mode of 3D woven composites changes from yarn fracture, interfacial cracking, yarn-matrix debonding and delamination to fiber breakage and inter-yarn delamination. Liu et al.11,12 used micro-CT to visualize and quantify the fatigue failure mechanisms in the three-dimensional five-directional braided carbon/epoxy composites with yarn-reduction by two-step and three-step segmentation approach. The results showed that the quantitative data of defined crack extension agree with the quantitative data of 3D visual cracks and indicate that the initial damage are found at the edges of the yarn reduction and specimens with wedge-shaped damage near the yarn reduction point. Similar fatigue failure behavior was also observed by CT for both specimens, with debonding and coupling of multiple failure modes being the main causes of specimen stiffness and strength loss, respectively.
With the rapid development of CAE software, advanced numerical techniques are employed to evaluate the impact properties and progressive damage mechanisms of 2.5D woven composites.19–22 Typically, scholars have developed multiscale homogeneity,23–26 full-meso-scale,6,26–28 and macro-meso hybrid29–33 finite element models to analyze the impact properties of the composite materials. Yuyuan et al. 24 investigated the impact damage of 3D cellular woven composite at different impact velocities by experiment and macro model FEM. The result showed that the impact response curves of FEM and experiment have a great correlation. In the work of Wu et al. 6 a full-scale meso model was proposed to study the impact damage behavior of hybrid 3D carbon/glass woven orthogonal composite, it presented the effect of hybrid fabric structure and progressive damage process at impact damage. The result showed that the Z-yarns have effect of impact resistance different damage models for impacts performed on different impact sides. In detail, the Z-yarns reduces the degree of delamination by holding the layers together in the thickness direction and improves the energy absorption capacity of the substrate by inducing the Z-yarns to debonding from the matrix at the surface. Wan et al. 31 investigated the compression progressive damage of 3D orthogonal woven composites based on the finite element macro model, observed a good agreement between experimental results and numerical predictions. The result showed that the initial damage was at the transmission surface at one end of the composite under the through-thickness direction compressive. Wang et al. 32 used a full-size meso-scale model to simulate the model-I impact damage performance of a 3D angle interlock woven composites, they found that the crack was begin in resin and transfer along the crimped path of yarns. Clearly, the traditional multi-scale homogeneous model cannot accurately reflect the local meso-scale yarn/matrix damage characteristics, whereas the full-size meso-scale models increase greatly the computational time cost and reduce the computational efficiency. R. Koloor 33 developed single and multilayer macroscopic models of UD composites, and meshed the models with different densities according to the damage regions. The experimental results show that the accuracy of the results of the single-layer finite element model is higher than that of the multi-layer model in the three-point bending finite element simulation. Recently, some scholars have developed Macro-meso hybrid model based on the Micro-CT. Waas et al. 34 analyzed the damage of highly anisotropic laminate composites under impact loading by a combination of FEM and micro-CT, FEM and micro-CT predicted the damage and revealed the damage mechanism, respectively. Unfortunately, the high-fidelity assessment of the impact mechanical properties of 2.5D woven composites based on the analysis of experimental and simulation results is still inadequate and needs further investigation.
The purpose of this paper is to reveal the impact mechanical behavior and progressive damage mechanism of 2.5D woven carbon/epoxy composites by the combination of experiment and numerical simulation. Two different impact energy levels, 15 J/mm and 20 J/mm, were designed for all the specimens using drop weight impact equipment. Then Micro-CT was employed to identify the impact damage volumes and damage distribution of 2.5D woven composites. Importantly, a novel whole-local finite element model was proposed based on the tests results and Micro-CT images. Furthermore, the predicted results were shown and compared with those of the experiment. Finally, the progressive damage process and failure mechanisms were analyzed.
Experiment
Specimen preparation
In this paper, the fibers and resin in 2.5D woven composite were Toray T700-12K carbon fiber and E−51 epoxy resin, respectively. As shown in Figure 1 and 2.5D woven fabric structure consisted of warp, weft, and interlock yarns. The weft (weft yarns) densities and warp (warp yarns and interlock yarns) were 2 tows/cm and 5 tows/cm, respectively. These yarns were arranged along the X-direction and Y-direction, respectively. Moreover, the interlocking yarns are interwoven with the weft yarns by moving up and down along the thickness (Z-direction). The 2.5D composites and structure: (a) the 2.5D composites; (b) the 2.5D fabric structure.
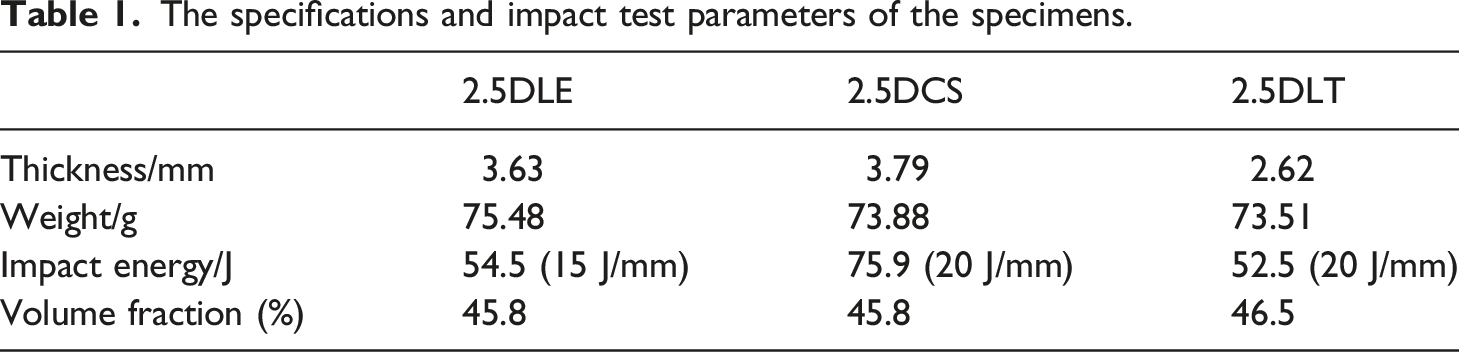
The specifications and impact test parameters of the specimens.
Impact test
Figure 2 shows the drop weight tester (INSTRON DYNATUP 9350HV) used for the impact test. The fixtures fixed the specimen on four corners to make the impactor can drop on the center of the specimen. A hemispherical impactor with a diameter of 16 mm and a mass of 5.449 kg was used. As mentioned in Table 1, two kinds of energies, 15 J/mm and 20 J/mm, were set. Three types of specimens were set up in the impact test according to the thickness and the impact energy, high-thickness low-energy specimens (3.63 mm, 15 J/mm), high-thickness high-energy comparison specimens (3.79 mm, 20 J/mm), and low-thickness high energy specimens (2.62 mm, 20 J/mm), named 2.5DLE, 2.5DCS and 2.5DLT respectively. In detail, the impact energies for 2.5DLE, 2.5DCS, and 2.5DLT were 54.5, 75.9, and 52.5 J, respectively. The transient impact responses of the specimen including the curves of force-time, force-displacement, absorbed energy-time, and displacement-time were recorded. Drop weight testing machine.
Micro-CT measures
Micro-CT was used to scan the morphologies of specimens after the impact test was completed. The scanning was performed on a Diondo-d2 (Diondo GmbH, Germany), with an accelerating voltage of 90 kV and a current of 120 μA. The specimen was rotated over 360°in equal increments and the projection was obtained at pixels flat panel detector. The image acquisition time per specimen was 1.5 h. In each scan, the scanning area was determined by the impact damage area, thus in-plain (X–Y) was chosen to be 30*30 mm, and the length of the out-plain (Z direction) scan was the thickness of the specimen. Afterward, the obtained 3D virtual images were processed in the VG Studio software, and the damage distribution inside the material was obtained by adjusting the virtual body grayscale values, performing surface determination to distinguish the damaged area, extracting the region of interest (ROI), and observing the damage type through the internal damage image of the material. Finally, the yarn, matrix and damaged area were extracted and separated according to the above method, and the volume of the damaged area was counted.
Numerical model
Finite element modeling
In general, the low-velocity impact of the 2.5D woven composite was localized damage.5,28 In the subsequent tests and Micro-CT images, the damaged area was found to be approximately 40 mm and 25 mm along with the length and width directions, respectively. Hence, in this paper, a novel macro-meso hybrid finite element model was developed as shown in Figures 3(a) and (b). In this model, the meso-parts exhibit detailed structure features, including warp, weft, interlock yarns, and matrix. Also, these parts were located at the central region with lengths of 48 mm and width of 32 mm along with the warp and weft directions, respectively. Whereas, considering that almost no damage occurs in the surrounding region, therefore, the parts that surrounded the damage region were a macroscopic homogeneous model. The finite element model of 2.5D composites: (a) the impacted area of 2.5D composites; (b) the whole model; (c) and (d) the macro and meso part; (e) the matrix and yarn in meso part.
The impactor and the support base used the C3D8R element, and were set as rigid bodies with the number of elements was 928 and 380, respectively. In addition, the cross-sections of the weft and warp yarns in the meso part were set as hexagonal and square, considering the extrusion morphology of the yarns, as shown in Figure 3(e). Due to the complex geometry of the material model, both the yarn and resin matrix in the material model were used C3D4 element, of which the macro part has 218,443 elements and the meso part has 810,270 elements. The three types of impregnated yarns were considered to be transversely isotropic materials and their orientations were depicted in Figure 3(e). The model simplifies the macroscopic part by considering the damage region and reduces the mesh density of the macroscopic part. In theory, this model can reduce the computational time without reducing the computational accuracy and obtaining the progressive damage under the fine view structure of the material.
Matrix and yarn properties


Mechanical properties parameters of the epoxy resin, carbon fiber, impregnated warp and interlock yarn, impregnated weft yarn.

Damage initiation and evolution law
In this section, the progressive damage behavior of the material system is described. In the meso-scale parts, 3D Hashin criterion 36 and the Von-Mises criterion were used as the initial damage criterion for the yarn and the matrix, respectively. In the macro homogeneous part, the maximum stress criterion was used as the initial damage criterion.
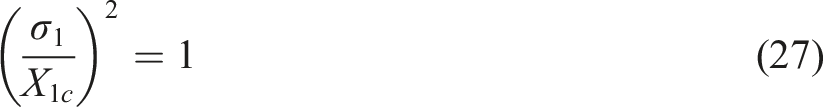
The detailed 3D Hashin criterion, including the tensile and compressive of yarn and matrix were listed in formula (8)–(11). In detail, tensile and compressive failure of yarn, tensile and compressive failure of matrix that in yarn was formula (8)–(11), respectively.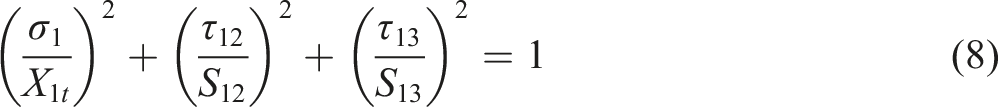


In the above equation,
When a yarn reached damaged threshold, its stiffness decreases compared to the undamaged state, and the decrease in stiffness is reflected by the degradation factor 


The Von-Mises criterion was used to evaluate the progressive damage of matrix, as shown in the following equation
The damage variate of matrix is stored at SDV7, when the damage of the matrix meets the von-mises criterion, the stiffness reduction of the matrix meets the following equation


In formula (22)–(25),
The initiation damage of homogeneity area was judged by the maximum stress criterion, as shown in formula (26)–(29). In detail, formula (26)–(29) was initiation criteria of the failure along the X axis and Y axis, respectively. The degraded criterion was adopted equation (7)–(17).


Results and discussion
Experimental result
Figure 4 presents the tested force-time, force-displacement, absorbed energy-time and displacement-time curves of 2.5D woven composites with different impact energy or thickness. The curve of impact response of 2.5DLE, 2.5DCS, 2.5DLT: (a) the force-time curve;(b) the force-displacement curve; (c) the absorbed energy-time curve; (d) the displacement-time curve.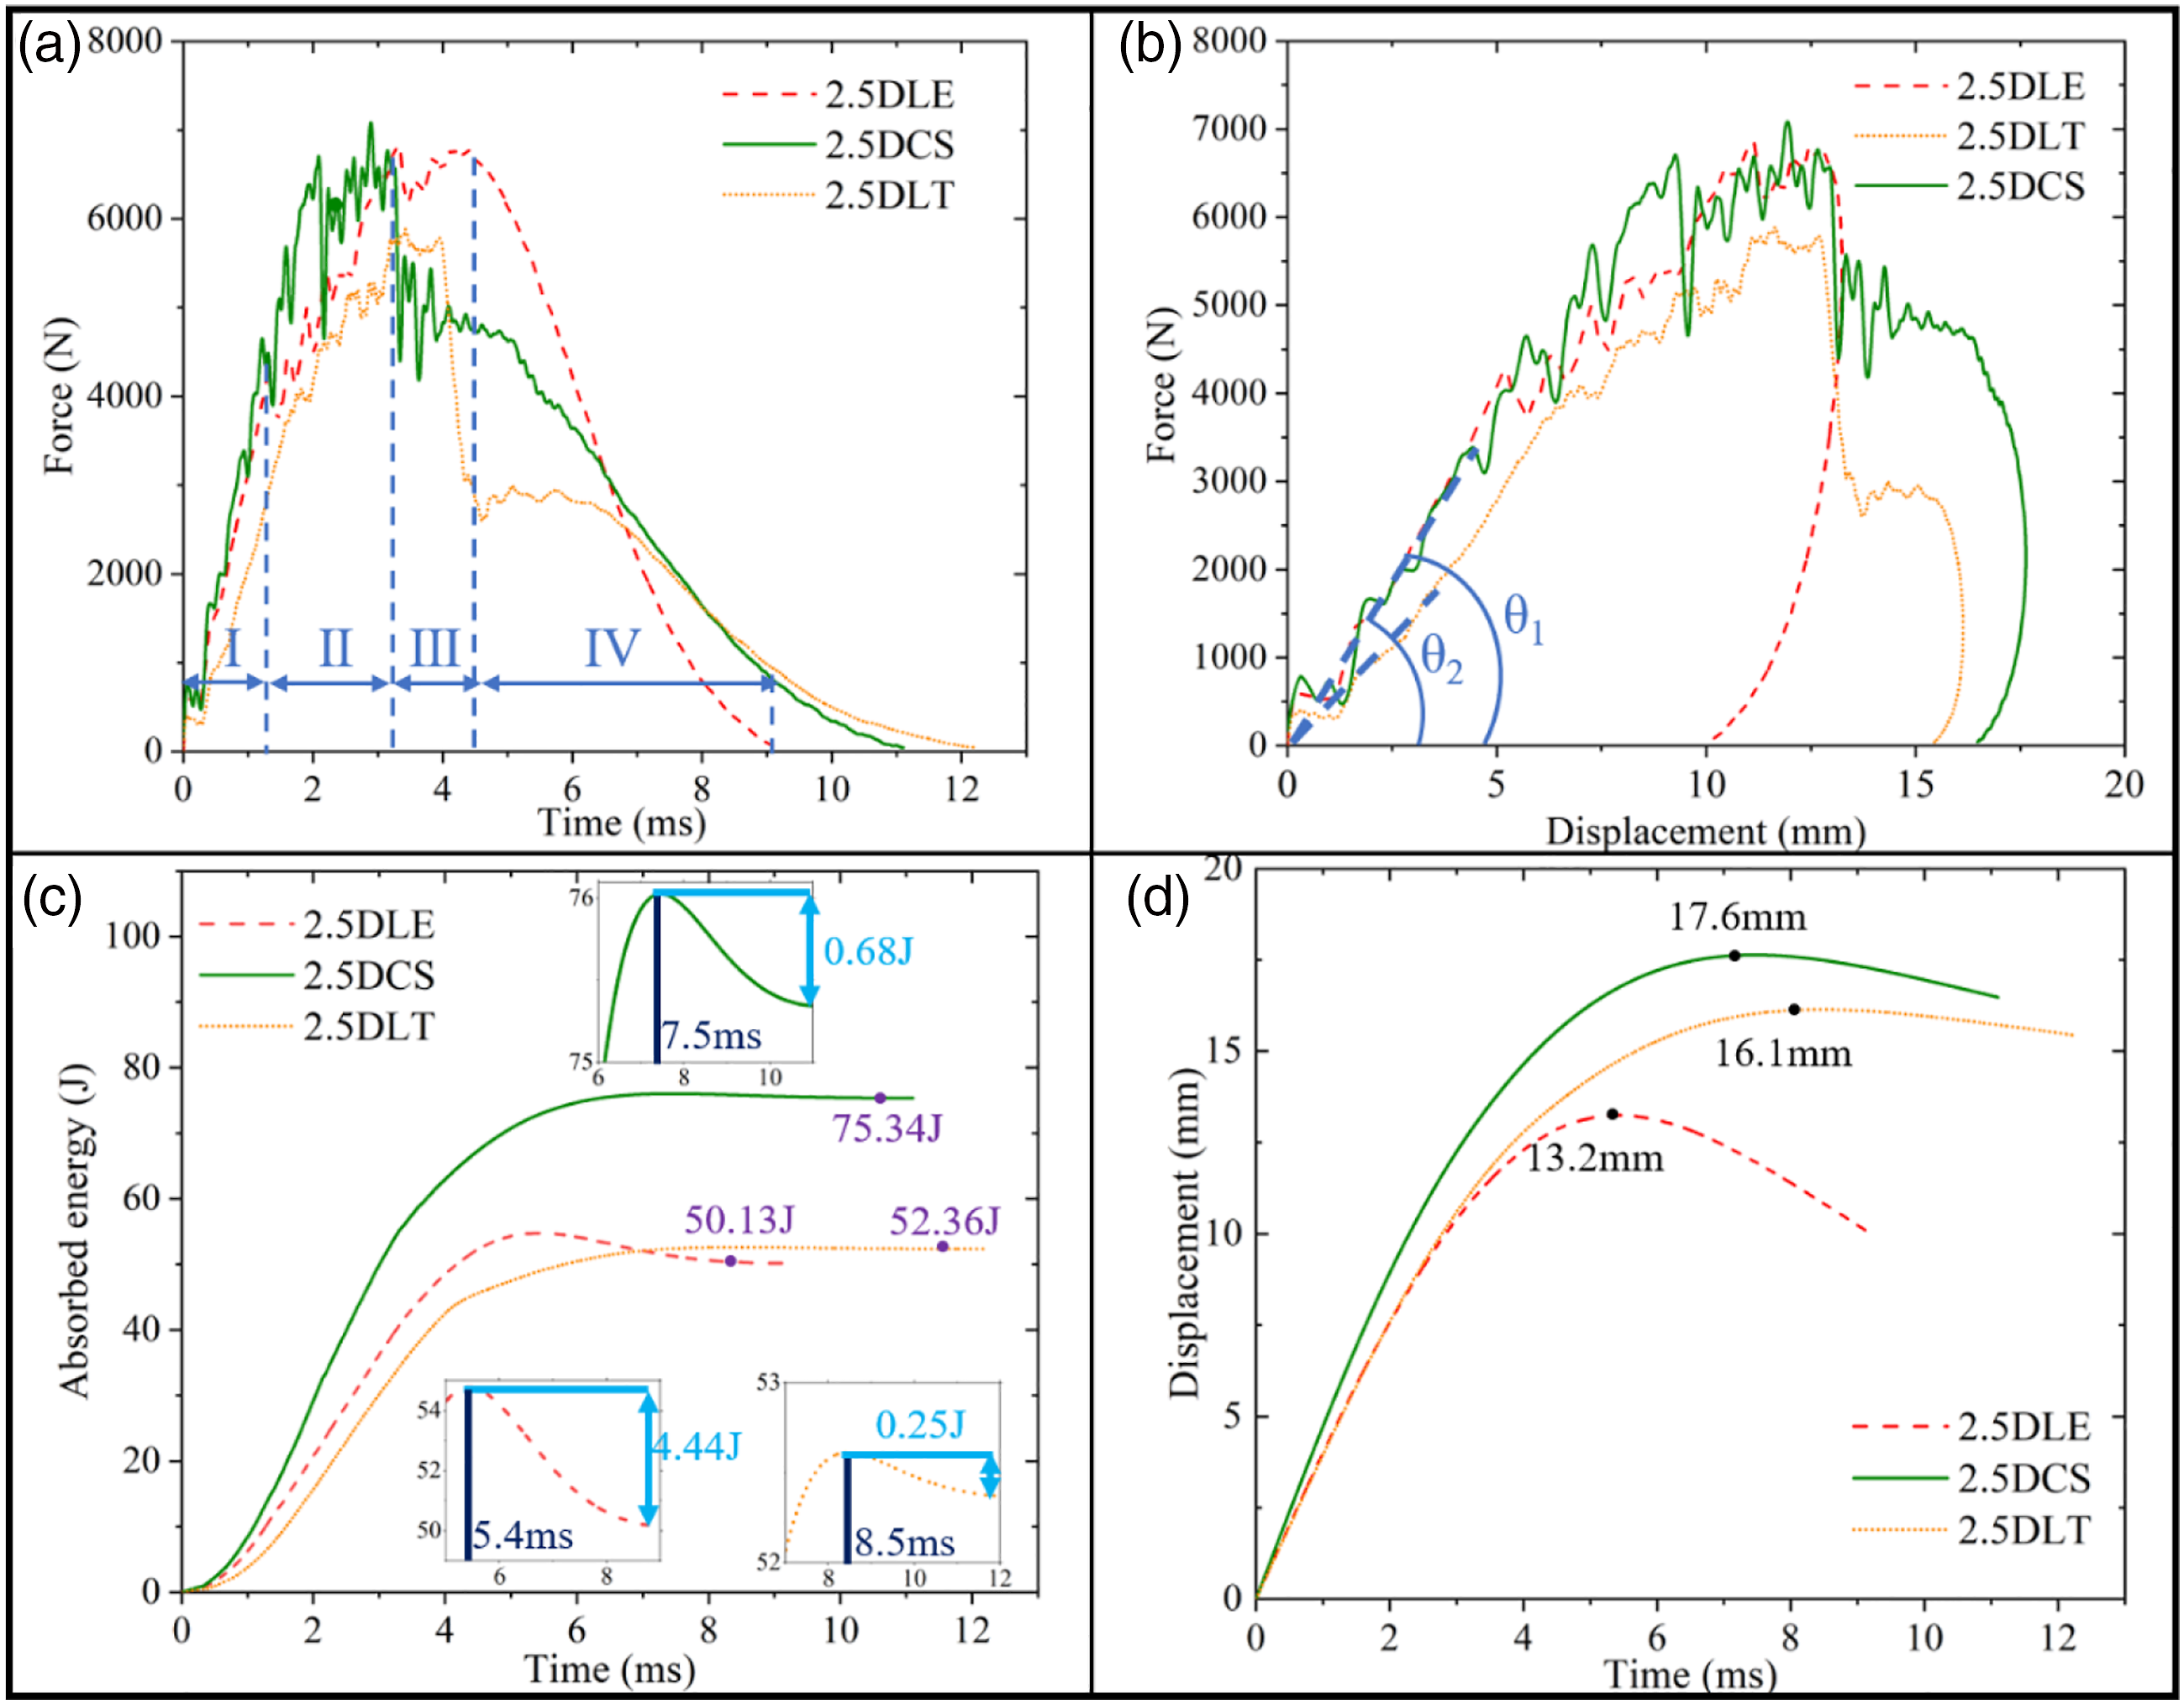
Figure 4(a) presents the force-time curve of specimens. All the curves exhibited a similar tendency and can be divided into four stages. Take 2.5DLE as an example, the curve of force-time included elastic stage (Stage i), initial damage stage (Stage ii), damage expansion stage (Stage iii), and rebound stage (Stage iV). At Stage i, the slope of the curve was essentially constant. With the load increasing, a slight oscillation occurred, indicating that the specimen had no serious damage. In Stage ii, the load violently oscillated and the slope significantly decreased. This phenomenon suggest that the specimen may appeared the fatal damage. 38 In Stage iii, the loads firstly reached the maximum value. Subsequently, the loads presented an oscillating platform stage and then dropped sharply. This can be attributed that the expansion of the damage. In Stage iV, the curve dropped rapidly, indicating that the samples occur the larger deformation and final failure.
Moreover, for the specimens with the same thickness (2.5DLE and 2.5DCS), when the impact energies change, the trend of force-time curves mainly differed in the damage extension stage. Detailedly, after reaching the peak force, the curves of 2.5DLE (impact energy of 15 J/mm) showed a little drop and slowly decreased, whereas that of 2.5DCS (impact energy of 20 J/mm) exhibited a plunge, then increased nearly the maximum value, finally decreased to 0. This can be explained by the energies effect. For the specimens with different thicknesses (2.5DCS and 2.5DLT), the curves showed similar trend at different stages. These suggested that at the same unit impact energy, the thickness of specimens has less effect.
Figure 4(b) is the curves of force-displacement. The ratio of force to deflection displacement is termed as bending stiffness. For the specimens with different thicknesses, the initial slope of 2.5DLE and 2.5DCS (θ1) was similar, but the initial slope of 2.5DLT (θ2) was significantly lower. For the specimens with different unit thickness impact energies, the displacement of the specimens (2.5DLE and 2.5DCS) at maximum load was similar. This indicated that the initial bending stiffness belongs to the property of the material, and the change of unit thickness impact energy has almost no effect on the initial bending stiffness of the specimens.
Figure 4(c) and (d) presents the curve of absorbed energy-time and displacement-time. The absorbed energy can be divided into elastic potential energy and dissipated energy that was stored by elastic deformation of materials and consumed by plastic deformation, respectively. The ratio of dissipated energy to maximum energy is regarded as the energy absorption ratio. In this, elastic potential energy was stored in the specimen, which was then transmitted to the impactor and caused the impactor to rebound. For the specimens with different thicknesses (2.5DCS, and 2.5DLT), the kinetic energy of the impactor was completely absorbed at 7.5 and 8.5 ms. The maximum displacement of 2.5DCS and 2.5DLT was 17.6 mm, 16.1 mm. The energy absorption ratio of 2.5DCS and 2.5DLT was 99.078%, 99.562%, respectively. And for the specimen with lower impact energy(2.5DLE), the time of kinetic energy was absorbed totally, the maximum displacement, and the energy absorption ratio was at 5.4 ms, 13.2 mm, and 92.338%. This indicated that the 2.5DCS and 2.5DLT suffer more severe damage.
Morphology of the damaged specimen
Figure 5 depicts the surface damage morphologies of the specimens. For the specimens, a clear oval damaged region consisted of matrix crack, yarn-matrix debonding and yarn breakage was formed both on the impacted side and non-impacted side. Moreover, the damage degree in the in-plane direction (XY direction) of 2.5DLE was more than 2.5DCS and 2.5DLT. Detailedly, at different thicknesses, the damage length along the warp direction on the non-impact side of 2.5DLE, 2.5DCS, and 2.5DLT were 6.3, 4.6, and 3.5 cm, respectively. In contrast, 2.5DLE had the smallest deformation in the thickness direction (Z direction) compared to 2.5DCS and 2.5DLT. Specifically, the deformation of 2.5DLE, 2.5DCS and 2.5DLT along the thickness direction at the impact center (Z direction) is 1.32, 5.32, 7.25 mm, respectively. At different impact energies, the 2.5DLE had a large matrix crack, while the 2.5DCS and 2.5DLT had larger yarn breakage. The damage degree and main failure mode were found to change with the difference in impact energy and thickness according to the damage morphologies of both the impacted side and non-impacted side. The damage of impacted side, non-impacted side and thickness side of 2.5DLE, 2.5DCS, 2.5DLT.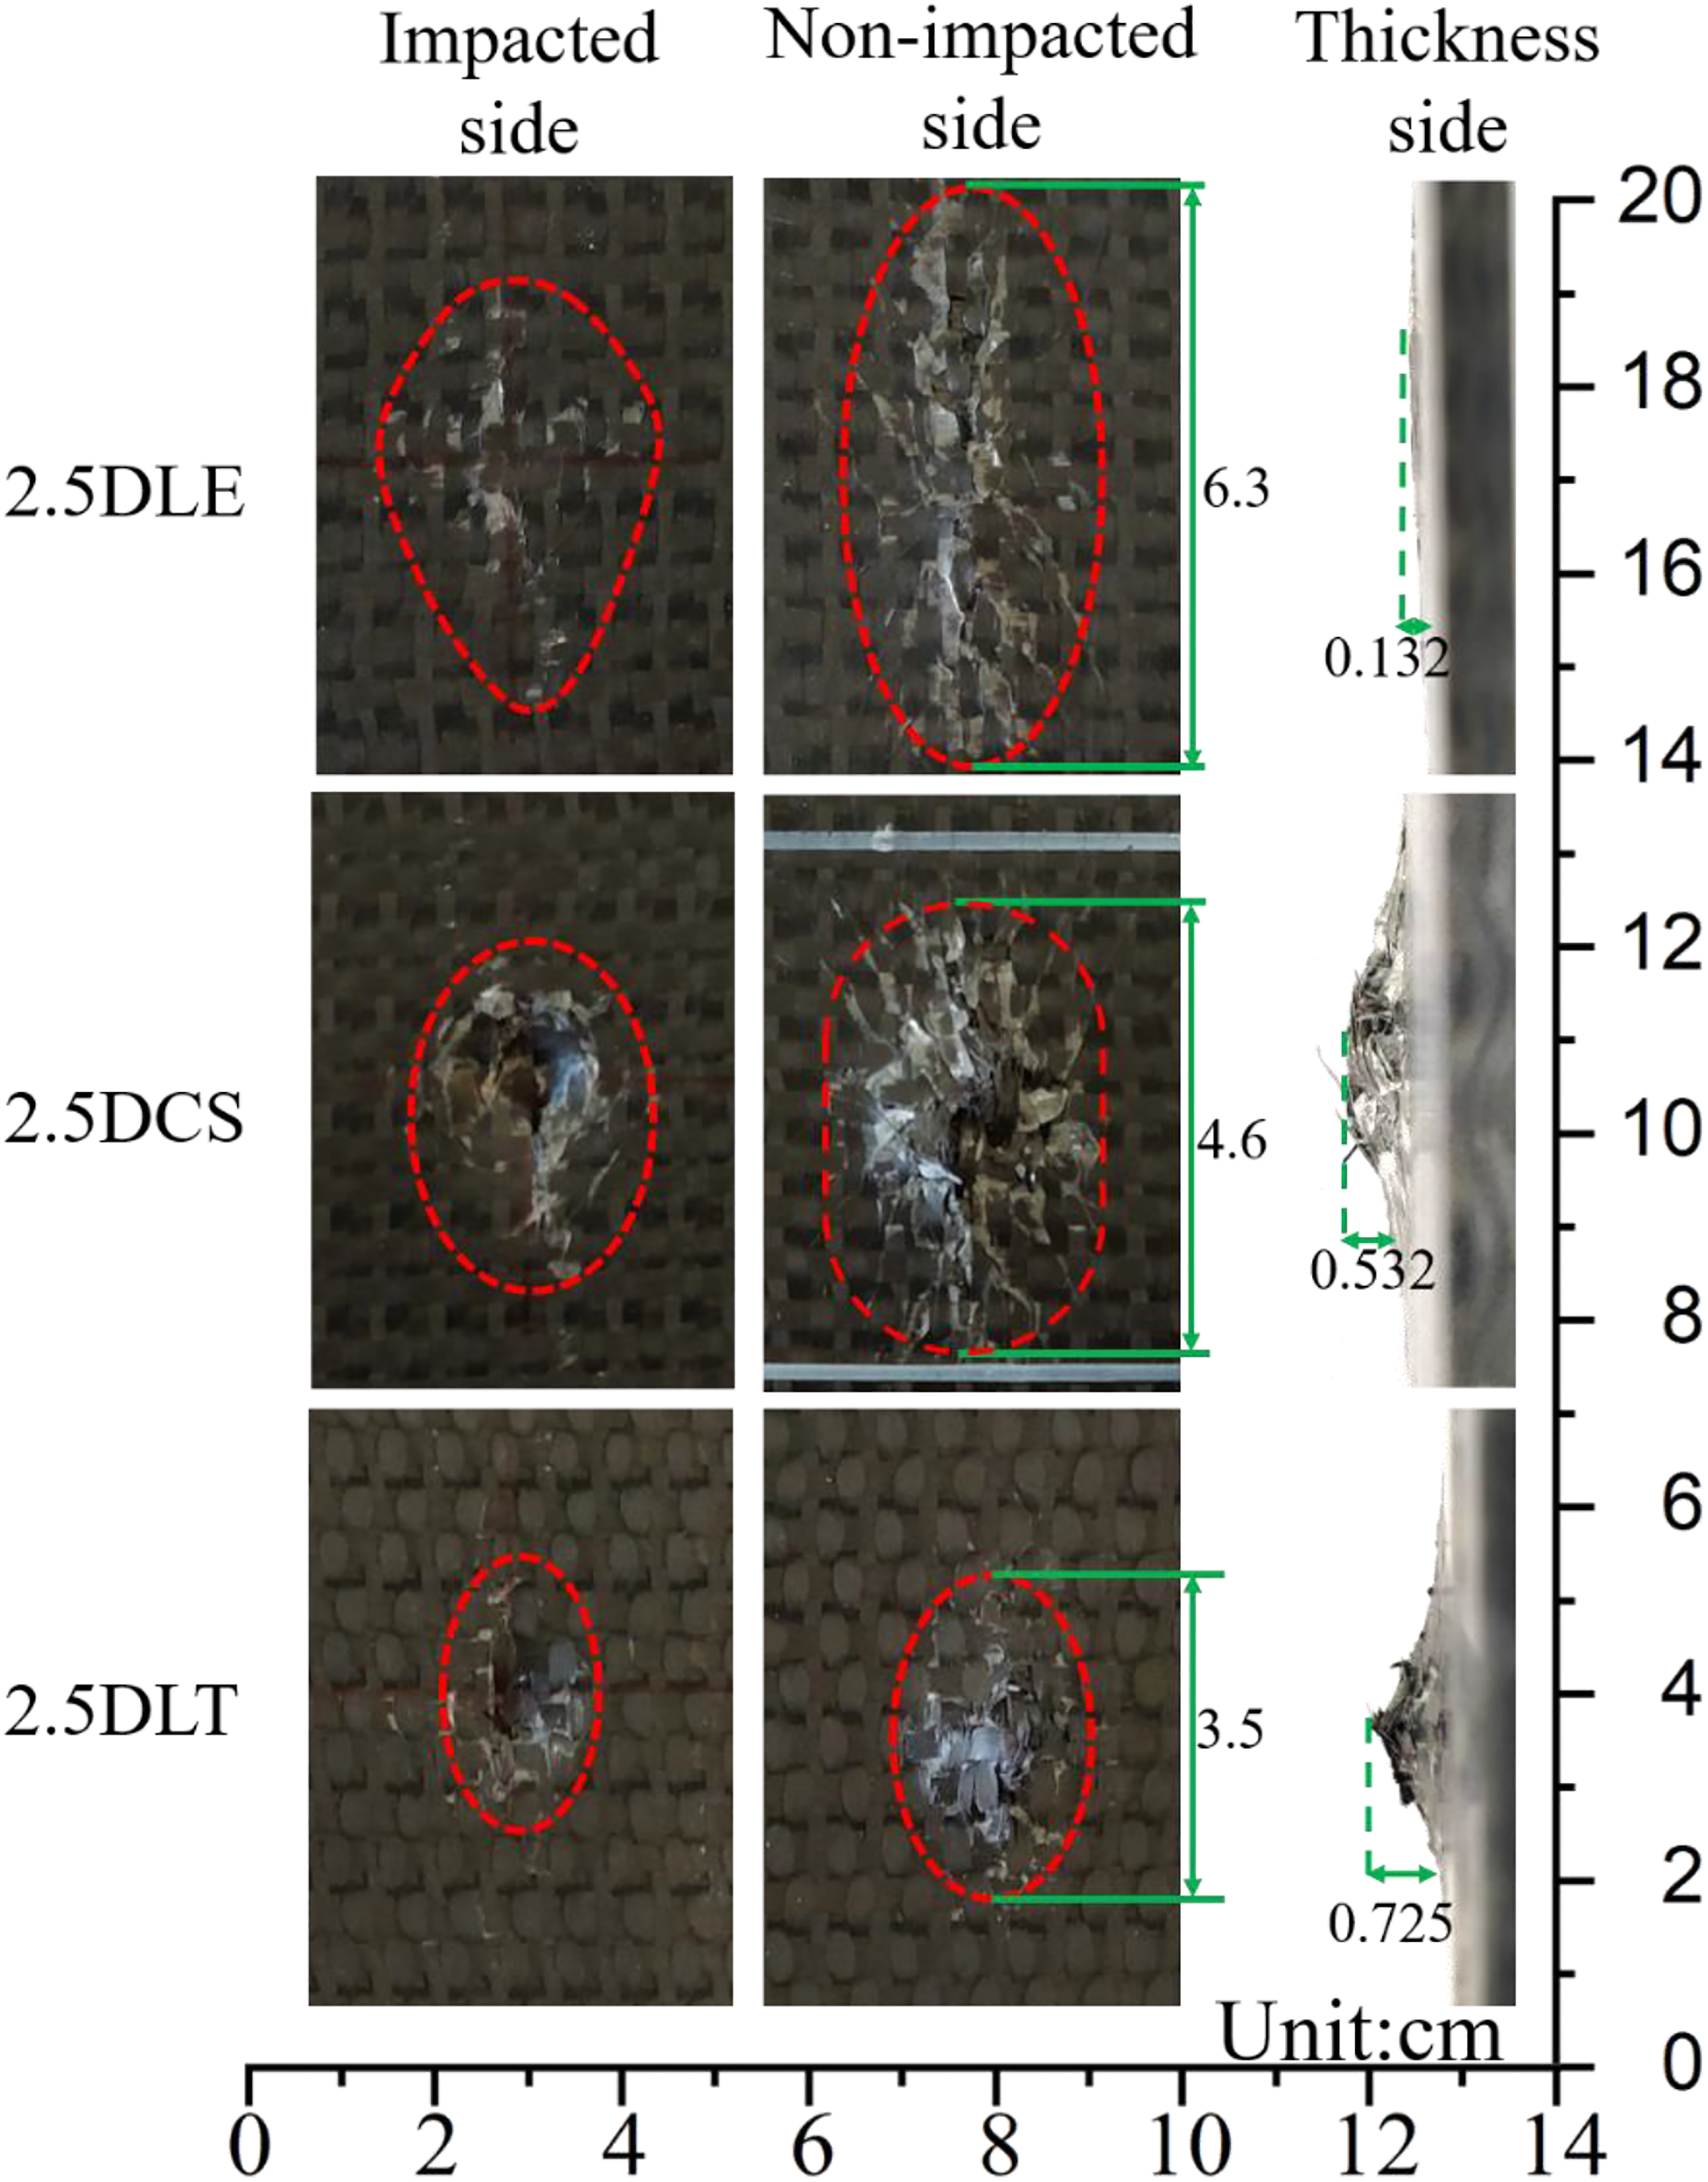
Figure 6 shows the internal damage along the warp and weft direction of 2.5DLE and 2.5DCS. The damage modes contain yarn-matrix debonding, yarn breakage, and matrix crack. Figure 6(a) and (c) and Figure 6(b) and (d) is the damage image of 2.5DLE and 2.5DCS, respectively. As shown in Figure 6(a), in the warp direction, 2.5DLE had a small amount of yarn-matrix debonding along with the interlock yarns and matrix crack. In Figure 6(b), 2.5DCS showed warp yarn breakage at non-impact side with a large amount of yarn-matrix debonding and matrix crack. In the middle region, delamination along the warp yarn direction (Y-direction) is observed. In Figure 6(c) and (d), in the weft direction, 2.5DLE had yarn-matrix debonding along the warp yarn boundary, some weft yarns breakage in the interior. In Figure 6(d), 2.5DCS had a lot of matrix crack, yarn breakage and yarn-matrix debonding. It suggested that the main damage mode of 2.5DLE and 2.5DCS was yarn-matrix debonding and yarn breakage, respectively. In terms of internal damage, both 2.5DLE and 2.5DCS has more serious damage along the warp direction than the weft direction. Combining Figure 6(a) and (c), it is found that yarn-matrix debonding occurs within the 2.5DLE under impact loading, while less damage occurs along the weft direction (X-direction) under the interlock of the interlock yarns,
39
reducing and delaying the appearance of delamination. Delamination due to yarn-substrate debonding induction further led to tensile fracture of the yarns in the specimen.
6
The damage of 2.5DCS is more severe than that of 2.5DLE. The main failure mechanisms at different impact energy also are different. This indicated that the impact energy has a greater influence on the failure mechanism of the specimens under impact loading. Damage modes of 2.5LE and 2.5DCS: (a) and (b) the internal damage modes along the warp direction; (c) and (d) the internal damage modes along the weft direction.
Figure 7 shows the internal damage distribution in the warp (Y) and weft (X) direction, and the damage volume of 2.5DLE (a and c) and 2.5DCS (b and d) extracted using VG Studio software. To clearly see the internal damage, the matrix was hidden, and the yarn was cut along the X and Y directions, respectively. To facilitate the observation of the damage on the non-impacted side, the non-impacted side of the specimen was placed on the upper layer. The damage volume for 2.5DLE and 2.5DCS was 26.99 mm3 and 183.22 mm3 respectively. And noted that as the damage extended outward, most of the damage extended along the yarn, forming yarn-matrix debonding, and a few parts of the damage appeared on the matrix, forming matrix crack. The damage along the yarn can be clearly observed in Figure 7(c) and (d). The internal damage distribution of 2.5LE and 2.5DCS: (a) and (c) the internal damage distribution of 2.5DLE; (b) and (d) the internal damage distribution of 2.5DCS.
Damage development and failure mechanisms
In order to reveal the damage development and failure mechanisms of 2.5D woven composites, the mentioned macro-meso hybrid finite element model was used to simulate the impact response of 2.5DLE specimen. Figure 8 and Figure 9 compared the force-time curves, the surface damage of the 2.5DLE specimen and the surface strain of the simulation results, respectively, which presents good correlation. This indicated that the established numerical model can effectively predict the impact damage behavior of 2.5D woven composites. Specifically, the damage area in Figure 9(a) were similar to that in Figure 9(b) in that both are larger along the warp direction (Y direction) and have deformation damage near the impact center that is larger than the impact center. The numerical results at key points were extracted from the finite element model to further investigate the damage behavior and failure mechanism at the force-time curve. The simulation results obtained by macro-meso hybrid finite element further reveal the progressive damage behavior and failure mechanism of 2.5D woven composites helpfully, which are explained below. Comparison of the experimental and numerical force–time curve for 2.5D woven composites under 15 J/mm impact energy. The damage morphology of experiment and numerical: (a) the damage morphology of 2.5DLE; (b) the strain distribution of simulation.
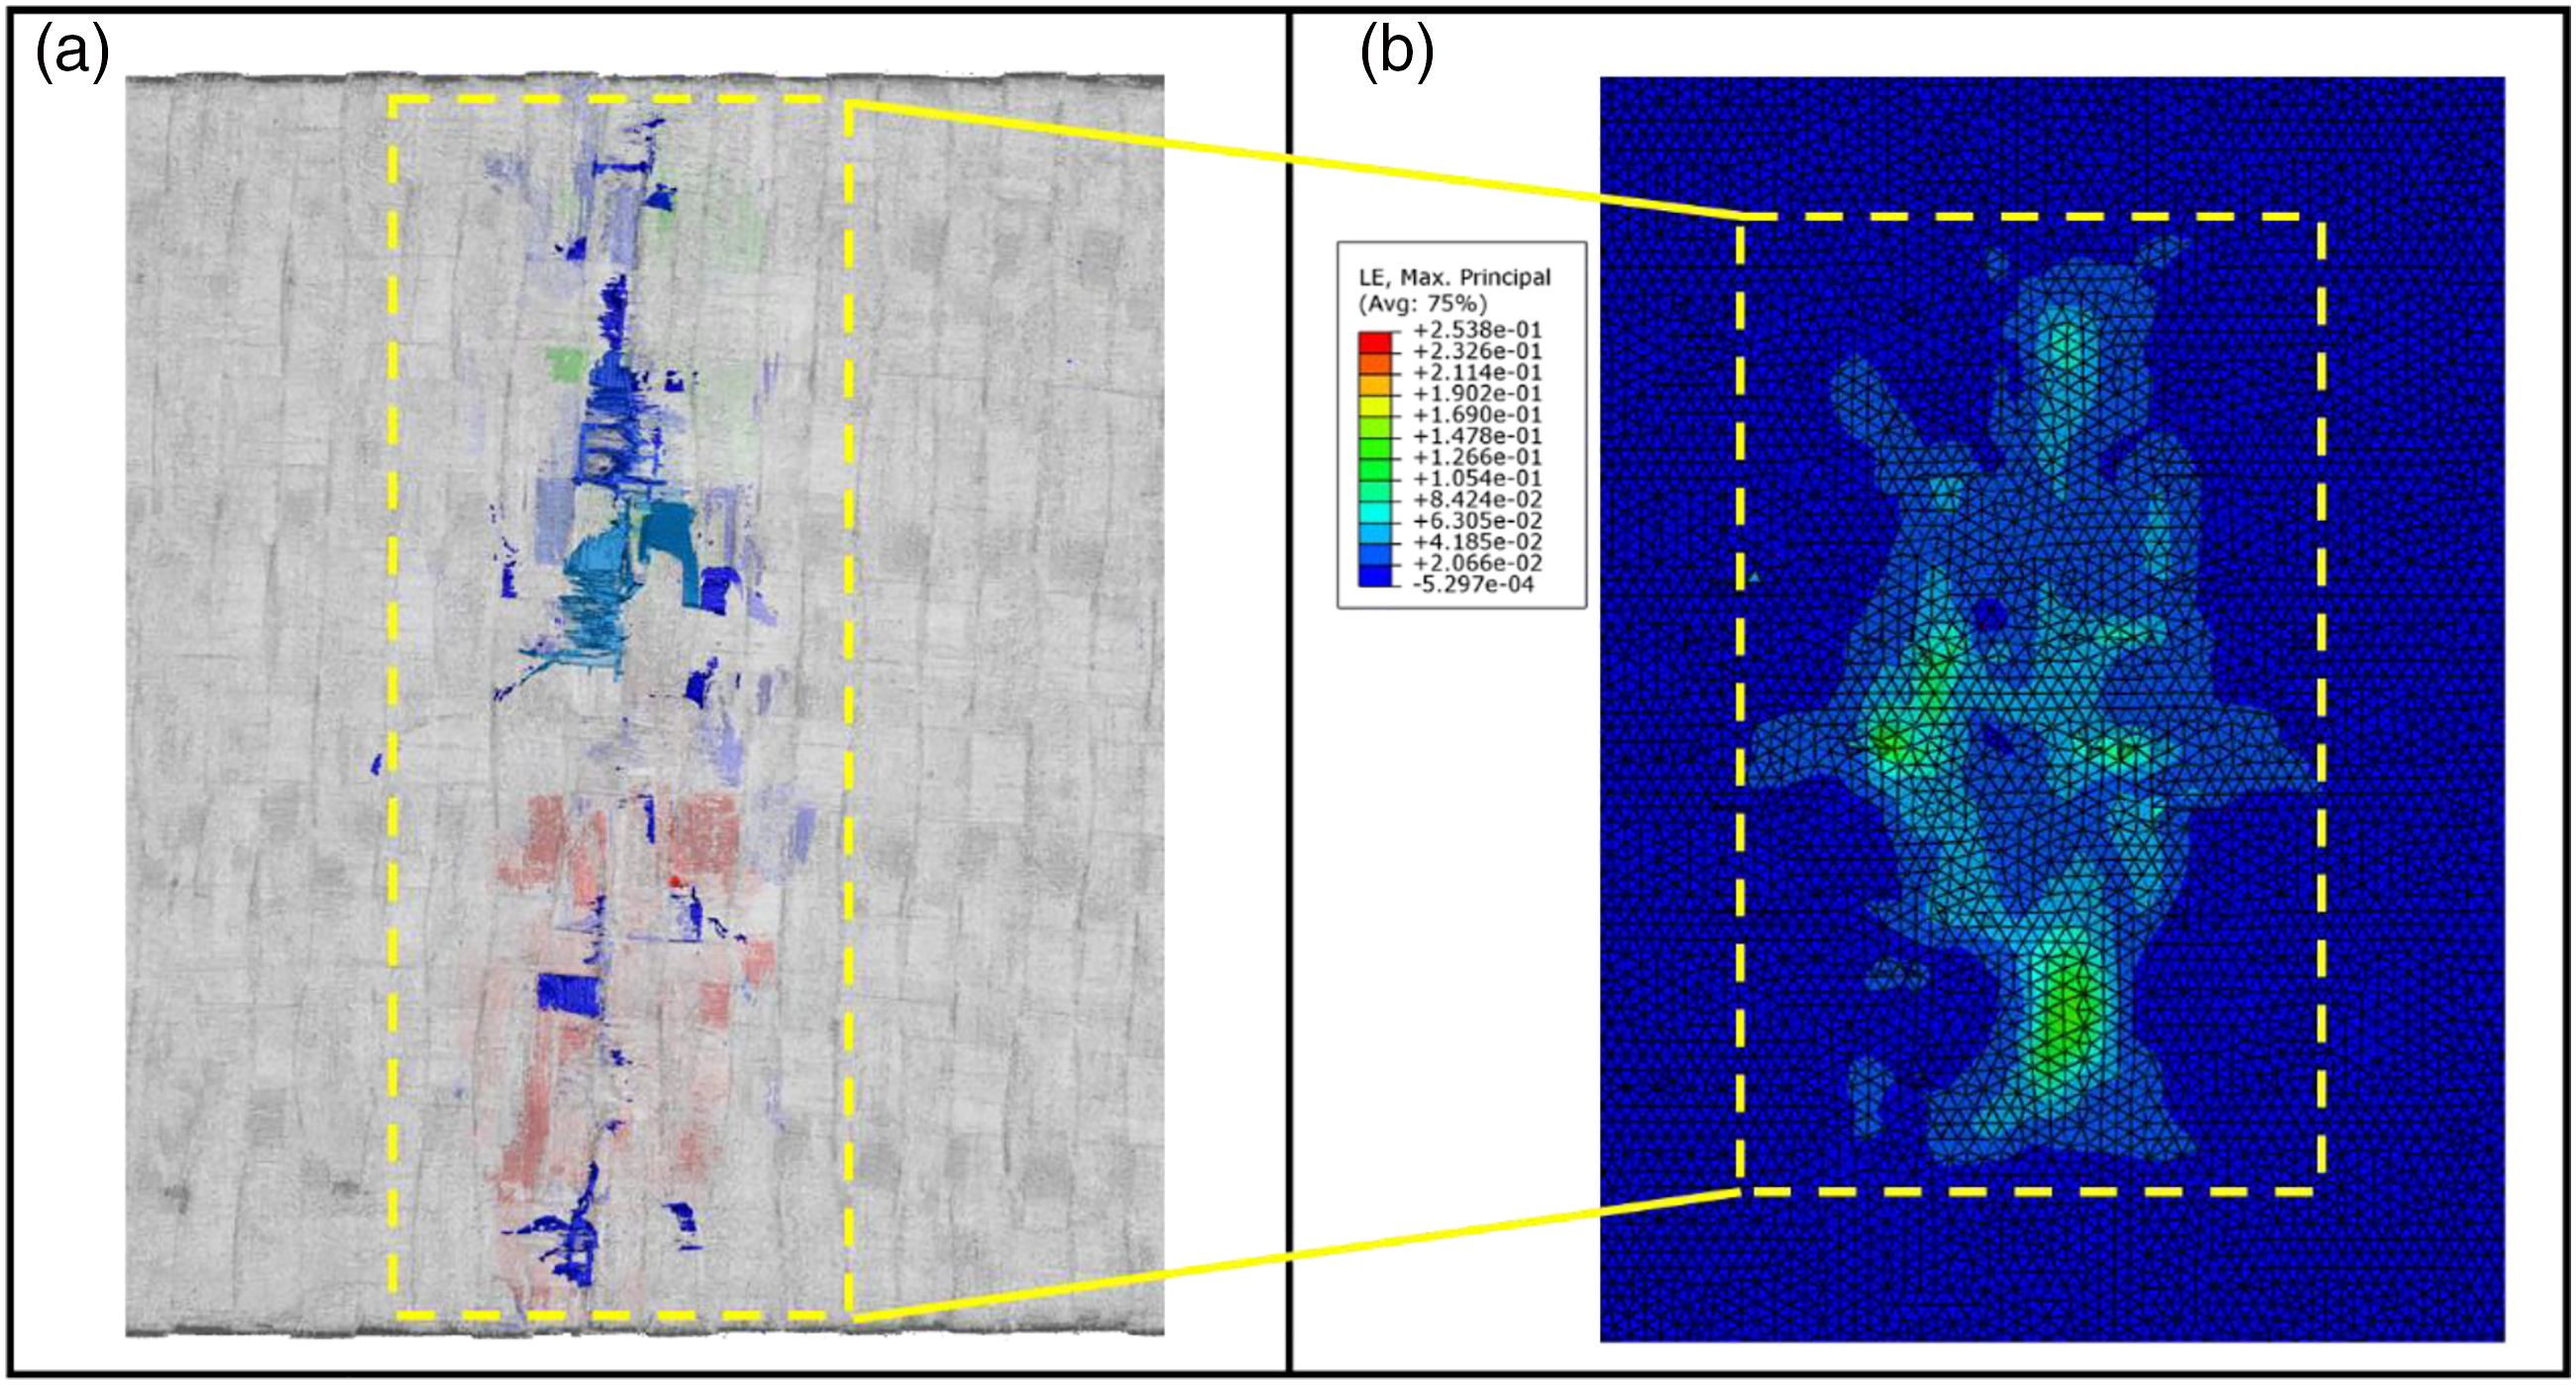
Figure 10 shows the strain distribution at critical times and micro-CT image of 2.5DLE. Combined with Figure 10(a) and (b), at T1, the 2.5D woven composites came into contact with the impactor and slightly deformed, which the compressive strain on the impacted side and tensile strain on the non-impacted side to resist the impact load. At T2, the maximum strain of the 2.5D woven composites appeared on the non-impacted side which mainly transmitted along the yarn. And the matrix around the yarn had a smaller strain. The strain coupling caused by the high strain of yarn and the low strain of matrix led to yarn-matrix debonding and resulted in a decrease of force at T2 in Figure 8. The 2.5D woven composites continued to loaded after the force was redistributed due to the yarn-matrix debonding not absorbed the impact energy totally. The interweaving points of the yarns led to a partial load transfer from the weft yarn to the warp yarn and vice versa.
6
The warp yarn density was greater than the weft yarn density, and this made cracks more likely to extend further along the warp yarn direction. This may cause by the structural effect of fabric and the different mechanical properties of carbon fiber and resin. The above results were consistent with the results of yarn breakage on the non-impact side, yarn-matrix debonding and matrix cracking in the middle region in Figure 10(c). The strain distribution of 2.5D woven composites under 15/mm impact energy: (a) the strain of 2.5D fabric; (b) the strain of matrix; (c) the internal damage of 2.5DLE.
The tensile damage variable (SDV7) of the yarns and the compressive damage variable (SDV10) of the resin within the yarns are illustrated in Figure 11(a) and (b) Combined with Figure 11(a) and (b), it can be seen that the damage of the yarn was mainly tensile damage. The yarn on non-impacted side had greater tensile stress that compare with the yarn on impacted side. With the deformation increasing, yarn breakage appeared at non-impacted side due to the tensile stress.
19
On the impacted side, the compression-induced decrease in yarn stiffness was occurred. But the impacted side had not enough deformation to reach the threshold of compressive breakage, thus the yarn not appear compression breakage. It suggested that the yarn damage under impact loading is dominate by tensile stress. The yarn breakage on the non-impact side in Figure 11(d) is consistent with the results of yarn damage due to tensile stress on the non-impact side in Figure 11(a) and (b) above. The damage of 2.5D composites under 15 J/mm impact energy at T2 and T4: (a) the tensile damage of 2.5D fabric; (b) the compressive damage of 2.5D fabric; (c) the tensile damage of matrix; (d–e) the internal damage of 2.5DLE.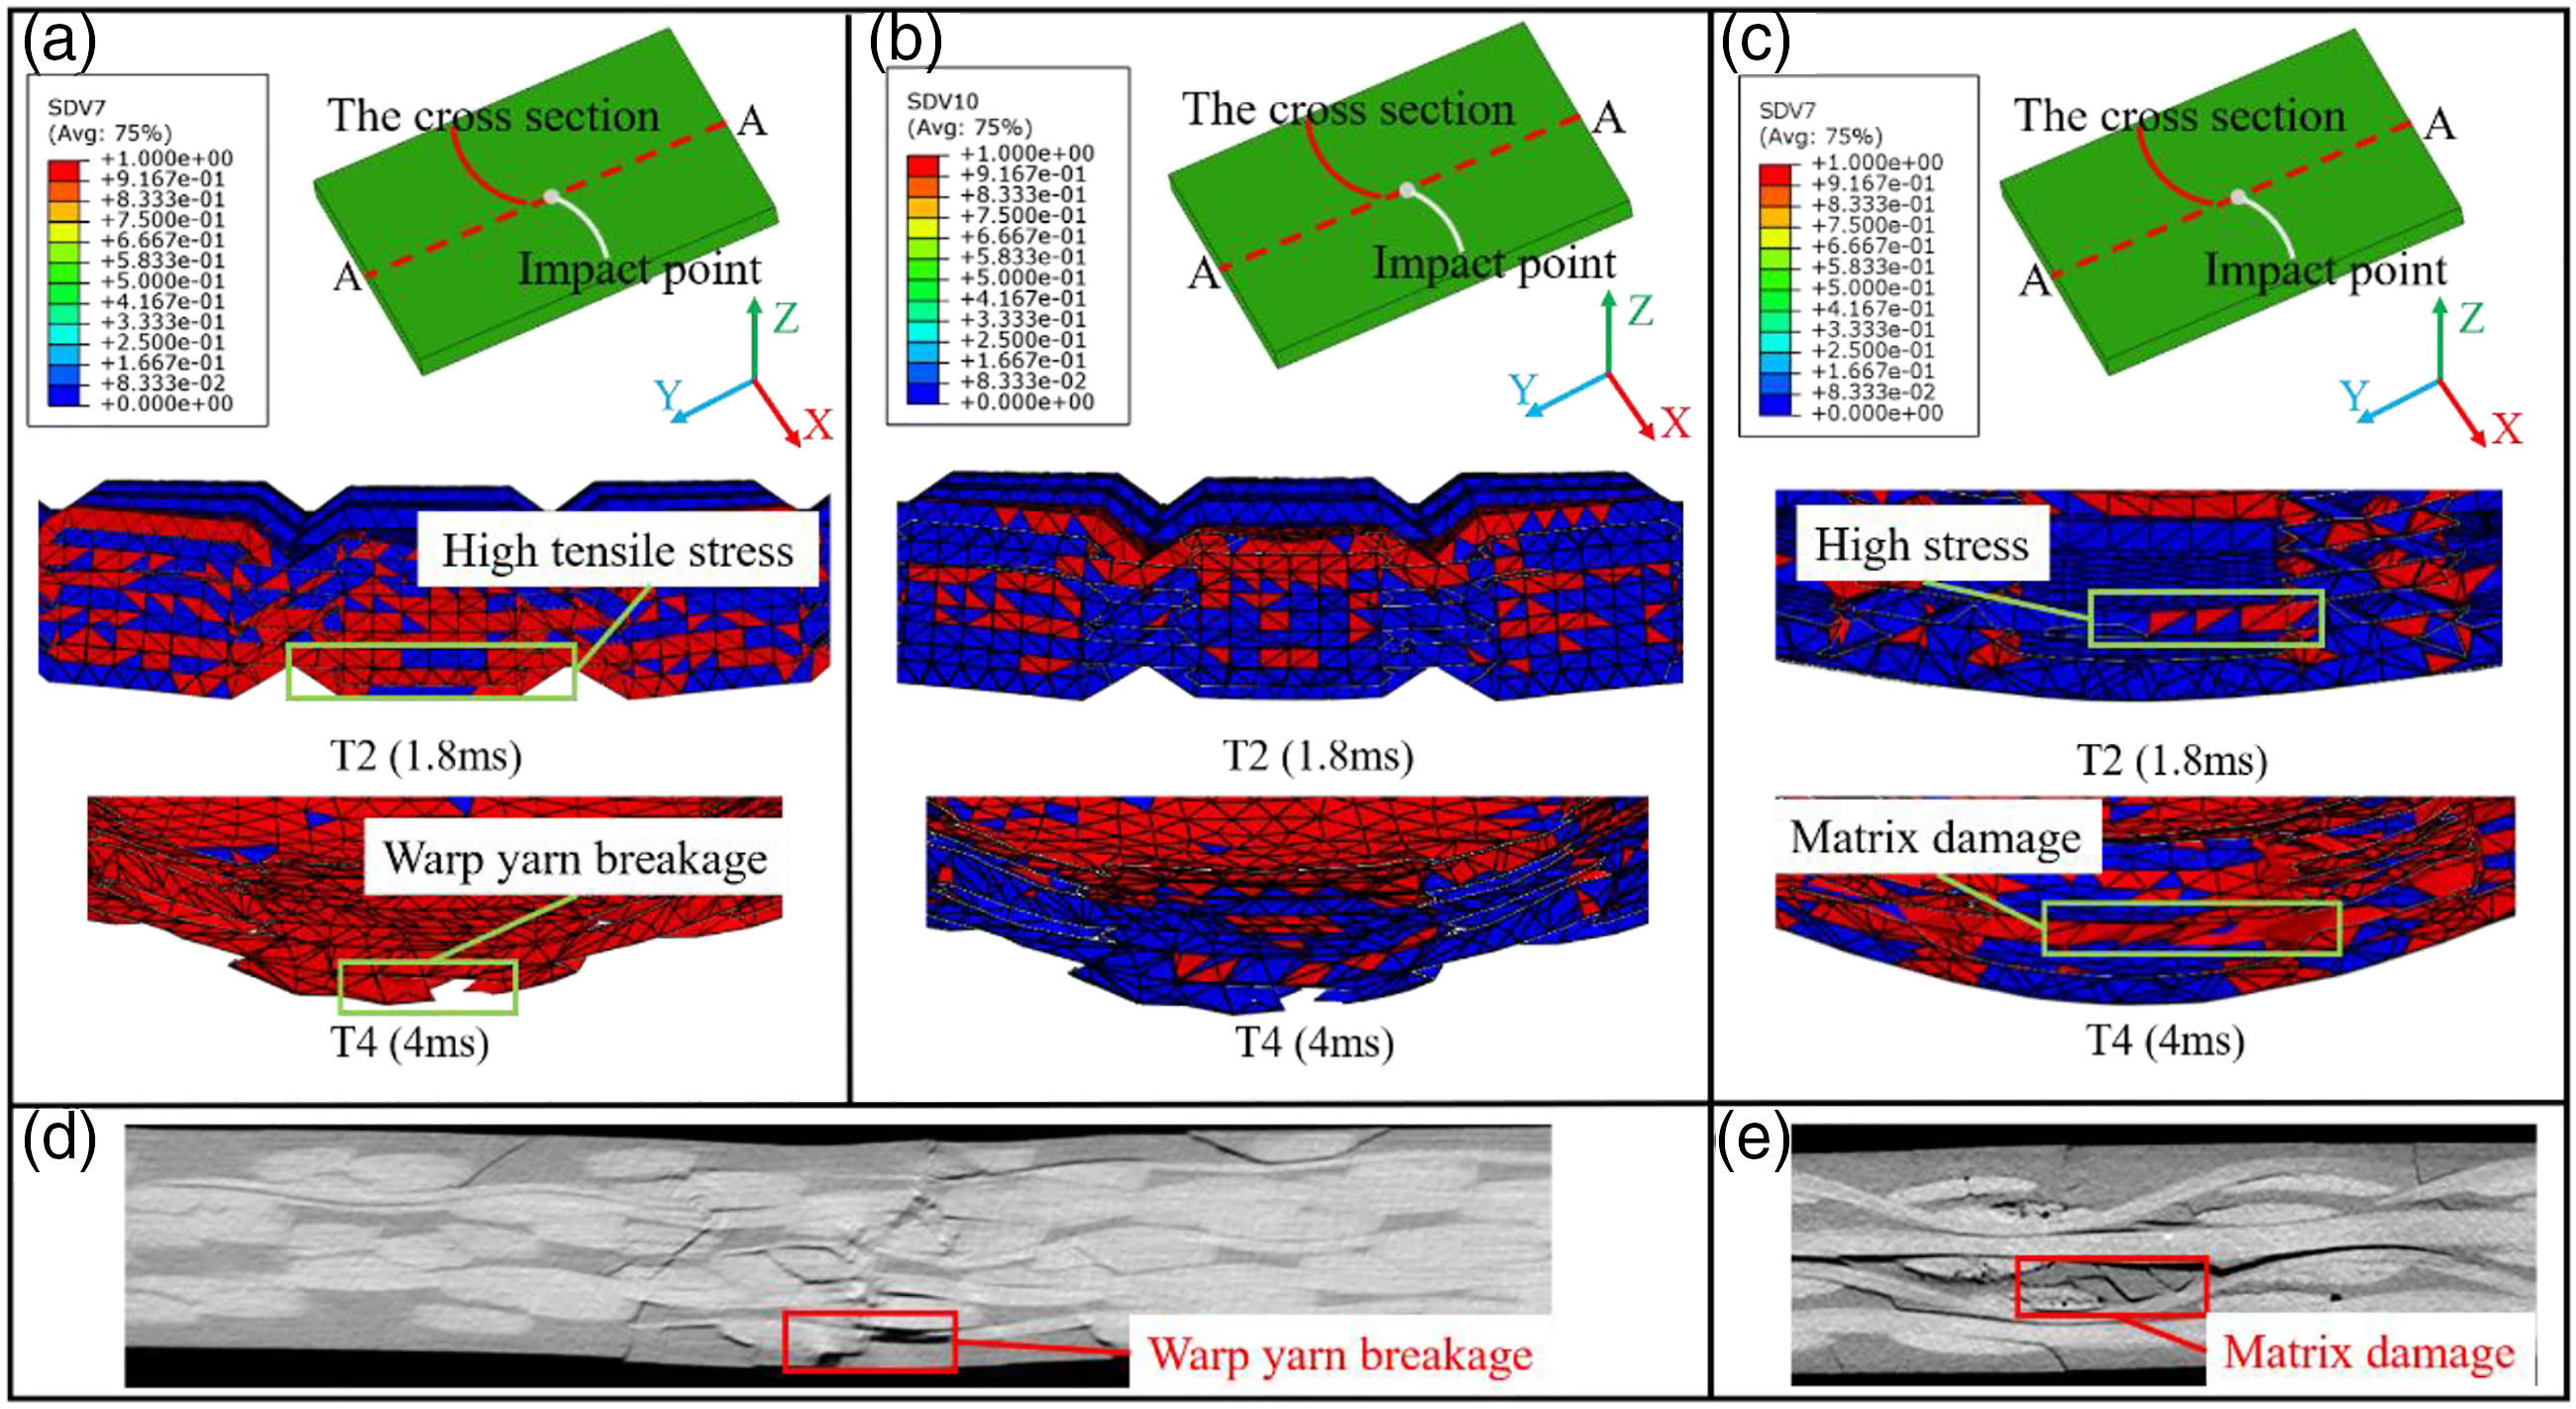
Figure 11(c) illustrates the damage variables of the matrix (SDV7). With the falling of the impactor, at T2, the matrix inside the specimen experienced a stress concentration under the strain of the yarn and matrix. With the deformation increasing, the damage threshold of the matrix was reached under the coupling of the above-mentioned force, which led the discount of the matrix strength. At T3, matrix damage was observed inside the specimen, which consistent with the internal damage obtained by CT. These indicated that the strain coupling of yarn and matrix leads to matrix damage inside the 2.5D woven composites and strength decrease. As shown in Figure 11(e), the matrix cracks in the middle region are consistent with the simulation results in Figure 11(c).
In addition, the damage propagation within the 2.5D woven composites mainly along with the interface between the yarn and the matrix, which dissipated the impact energy by form yarn-matrix debonding.10,40 Figure 12 shows the stress distribution of yarn and matrix at critical time points along the A-A cross-section. At T1, the interlock yarns inside the specimen had greater stress under the impact loading. The stress was mainly propagated along the yarn in the warp direction, while had less stress along the weft yarn and the surrounding matrix. With the deformation increasing, at T3, the mainly stress propagation direction was still in the warp direction. Compared to weft yarn and warp yarn, interlock yarn was subject to greater deformation under impact loading due to the connecting action in the Z-direction. Therefore, stress concentrations are more likely to occur in the bending position of the interlock yarn,6, 41 which are identical to the results in Figure 12(c). In summary, interlocking yarn makes it easier for to reduce delamination and improve the impact resistance of the 2.5D woven composites by the damage propagate along with them. The stress distribution of 2.5D composites under 15 J/mm impact energy at T1 and T3: (a) the stress distribution of 2.5D fabric; (b) the stress of distribution of matrix; (c) the internal damage of 2.5DLE.
Conclusions
The Low-velocity impact behavior and damage mechanisms of 2.5D woven carbon/epoxy composites are investigated though a couple numerical-experimental approach. The detailed conclusions are as follows:
The damage along the warp direction in the specimen is more serious, and the internal mainly damage is from yarn-matrix debonding to delamination and eventually yarn breakage with the increase of impact energy per unit thickness. With the same impact energy per unit thickness, the damage mechanism and impact response curves of specimens with different thicknesses showed similar trends.
For 2.5DLE, progressive crushing damage was initiated in the yarns located on the non-impact side due to high tensile stress. Interlocking yarns reduce the appearance of delamination by fixing adjacent layers and allowing damage to propagate along with the interface between it and the matrix, improving the impact energy absorption capacity of the material.
The simulation results of the developed macro-meso hybrid finite element model have good reliability and can be used as a prediction method for damage as well as failure mechanisms of 2.5D woven composites.
The above results have important implications for the design and simulation of 2.5D woven composites under impact loading. Importantly, this paper presents a macro-meso hybrid finite element model to simulate the impact progressive damage of 2.5D woven composites, which establishes a smaller number of meshes and can improve the computational efficiency with little reduction in computational accuracy. It can be used to analyze and design to improve the impact resistance of 2.5D woven composites. In addition, the computational accuracy of the developed macro-meso hybrid model at different impact energies still needs further investigation.
Footnotes
Declaration of conflicting interests
The author(s) declared no potential conflicts of interest with respect to the research, authorship, and/or publication of this article.
Funding
The author(s) disclosed receipt of the following financial support for the research, authorship, and/or publication of this article: This study is supported by the National Science and Technology Major Project (2017-VI-0007-0076), National Natural Science Foundation of China (11702115, 12072131), Natural Science Foundation of Jiangsu Province (P.R.China) (BK20211583).