
Abstract
As a new type of textile composites with broad application prospects, it is essential to study the prediction method of the mechanical properties of 2.5 D woven composites (2.5DWC). Currently, the most popular prediction method is to use a representative volume cell (RVC) for numerical simulation, so the reasonableness of RVC determines the prediction accuracy. However, many practical factors are ignored in the traditional periodic unit-cell model (UCM), such as the weft-layer-number (WLN), resulting in low prediction accuracy; while the full-cell model (FCM) in which the surface extrusion effect (SEE) and WLN are considered has the problems of complex modeling and high computational cost. To solve these problems, a triple-cell model (TCM) system is proposed, which includes four RVCs that are applicable to different WLNs, each of which is composed of different sub-cells (surface-cell, transition-cell, and inner-cell) which are categorized according to the characteristics of the actual weft yarn cross-section. Based on the progressive damage method, the stiffness, strength, and damage behavior of 2.5DWC with different WLNs are predicted, and the TCM prediction results are compared with the results of the experiment, the UCM, and the FCM. Compared with the experimental results, the prediction accuracy of the TCM is more than 8% higher than that of the UCM, and the difference between the prediction results of the TCM and FCM is less than 5%. Therefore, the proposed TCM system has the characteristics of high prediction accuracy, relatively simple modeling, and the applicability of any WLN.
Keywords
Introduction
With the continuous development of advanced manufacturing fields, including aerospace, automotive, wind energy, marine engineering, etc., the role of composites in equipment manufacturing becomes increasingly important [1]. As a material with better anti-delamination performance, superior integrity, and stronger designability than the laminated composites, 3 D textile composites have attracted widespread attention from engineering designers [2–4]. As special 3 D textile composites, 2.5DWC has the most representative and research value [5–7], whose yarns are arranged at a certain angle to the thickness direction to form a layered angle interlocking weave structure. Thus compared with other 3 D textile composites, 2.5DWC has higher resistance to delamination [8,9]. Besides, the blade-casing structure of the latest generation GE9X engine is designed with 2.5DWC [10], indicating the development advantage and application value of 2.5DWC. Therefore, the research on the mechanical properties prediction method of 2.5DWC has grown up to be a hot topic in the field of composite mechanics and advanced manufacturing.
In the early development of 2.5DWC, scholars have to propose many theoretical models to predict the mechanical properties of 2.5DWC due to the insufficient computer level, such as select average model [11–13], slice model [14,15], orientation average model [16,17], and equivalent response comparison technology [18,19]. These models adopt the iso-stress and iso-strain assumptions, which have been successful within a certain accuracy range. However, the development of these models has been limited due to the excessive assumptions introduced and the immature consideration of the curved segment of the warp yarn. Therefore, with the advance of computer technology, numerical simulation methods have been promoted gradually.
In this method, the most important step is to determine a reasonable RVC, and different scholars established different RVCs. Dong [20], Wang [21], Lu [22], Qiu [23], and Lu et al. [24] established the traditional UCM to predict mechanical properties of 2.5DWC, and performed corresponding experiments. The results show that there is a satisfactory agreement between the experimental and predicted values. Since then, considering the difficulty of generating high-quality grids for the UCM, Zhang et al. [25–28] established the UCM by voxel-mesh method, which improved the prediction accuracy to a certain extent. In fact, it is difficult to improve the prediction accuracy of the RVC significantly without reckoning the actual factors, such as the SEE. Accordingly, Song et al. [29–36] proposed a full-cell model (FCM) considering the SEE, and accurately predicted the stiffness, strength and fatigue life of 2.5DWC. Compared with the UCM, the prediction accuracy of the FCM improves by about 8% on average. Subsequently, Li et al. [37] established the FCM through the voxel-mesh method, which improved the prediction accuracy again. By comparing the characteristics of the various models mentioned above, it can be found that: (1) UCM is not suitable for 2.5DWC with a small thickness because the thinner material shows serious SEE; (2) FCM is not suitable for thicker materials due to the problem of complex modeling and high calculation cost. Therefore, considering such contradictions, it is necessary to develop a RVC model of 2.5DWC that can overcome the above two problems.
Learning from the idea of establishing the three-cell of braided structural composites proposed by Wu [38], the weft cross-section of the actual 2.5DWC is characterized. The characterization results show that the material can be divided into three parts from the thickness direction, namely the surface part, sub-surface part, and internal part. Afterwards, according to these three parts, the corresponding surface-cell, transition-cell and inner-cell can be established, respectively. Thus, these three sub-cells can be brought together to obtain different RVCs of 2.5DWC with different WLNs. Although the combination is arbitrary, there are only four meaningful combinations, in other words, the proposed TCM system contains only four RVC models, which are suitable for different WLNs. It is worth noting that (1) the proposed TCM is the FCM when WLN ≤ 6, and (2) only one inner-cell is used to replace all inner-cells when WLN > 6. Therefore, the modeling of the TCM is relatively simple compared with the FCM, and the prediction accuracy of the TCM will be greatly improved due to the consideration of SEE compared to the UCM.
Our main purpose of this paper is to explore the laws of the mechanical properties of 2.5DWC with different WLNs through the TCM system, and provide mechanical design suggestions for 2.5DWC structural components. The novelty of this paper mainly includes three aspects: (1) the construction idea and strategy of the TCM system for 2.5DWC; (2) the regularity of stiffness and strength of 2.5DWC with different WLNs, and the experimental verification of model rationality; (3) similarities and differences analysis of damage propagation mechanism of 2.5DWC with different WLNs. We expect that the proposed TCM system can be extended to the RVC modeling of other 3 D textile composites, and the findings can provide guidance for the design of 2.5DWC-based components. More importantly, the proposed TCM system unifies most of the existing RVC models of 2.5DWC and provides a basis for RVC modeling of 2.5DWC with different thicknesses, which is convenient for engineering calculation and analysis, so that engineers no longer worry about what RVC model to adopt when analyzing the mechanical properties of 2.5DWC.
The remainder of this paper can be summarized as follows. In the next section, the processing flow of 2.5DWC, cross-sectional characterization and experimental setup are described. Then, modeling ideas and micro geometric relationships of TCM are described, which is followed by a progressive damage model for predicting mechanical properties of 2.5DWC. In ‘Periodic boundary conditions for the TCM’ section, the periodic boundary conditions of the traditional UCM are modified to those of the TCM. In ‘Finite element models and simulation settings’ section, finite element models of the TCM, UCM, and FCM are displayed, and the simulation process is described. In the penultimate section, the mechanical properties and damage behaviors of 2.5DWC with different WLNs are analyzed. In the final section, some key conclusions are outlined.
Material and experiment
Material processing
In this paper, the carbon fiber used in the fabric of 2.5DWC is T300-3K, produced by Toray Corporation of Japan, which is commonly used in aerospace and automation. QY8911-IV bismaleimide thermoplastic resin is used as the matrix, which is manufactured by the Aerospace Research Institute of Material & Processing Technology of China. The resin has excellent molding performance and can meet the RTM molding process of complex components. See Table 1 for the mechanical properties of these two materials.
Parameters of different component materials [39].

Figure 1(a) displays the curing process of 2.5DWC using the VARTM technology. First, 2.5DWC fabric, woven by the Institute of Composite Materials of TianGong University, is laid into a forming mold, and the mold is assembled and sealed. Second, the mold is preheated and evacuated. Third, liquefied resin is injected into the mold, the injection pressure is 0.5 MPa, the temperature is about 90°C, and the time is about 0.5 h (see Figure 1(b)). Finally, the materials in the mold are insulated, cured, and demolded.

T300/QY89II-IV 2.5DWC curing process: (a) material curing process in VARTM equipment, (b) temperature control during the curing process, (c) DMA curve of QY8911-IV resin matrix, (d) principle of SEE.
In the whole process, it is necessary to keep the mold in 210°C for ten hours to ensure that the resin can fully penetrate the fabric, thus reducing the porosity. It should be explained that from Figure 1(c), the glass transition temperature of the QY8911-IV resin is about 256°C, but a significant change, including the modulus and loss tangent, occurs when the temperature exceeds 200°C. Therefore, it is reasonable to keep the molding process at 210°C for 10 hours. However, as showed in Figure 1(d), due to long-term exposure to high temperature environment, the preform inside the mold will have an overall thermal expansion, which will cause the mutual extrusion between the preform and the mold cover, thus leading to the SEE of the formed material.
Material characterization
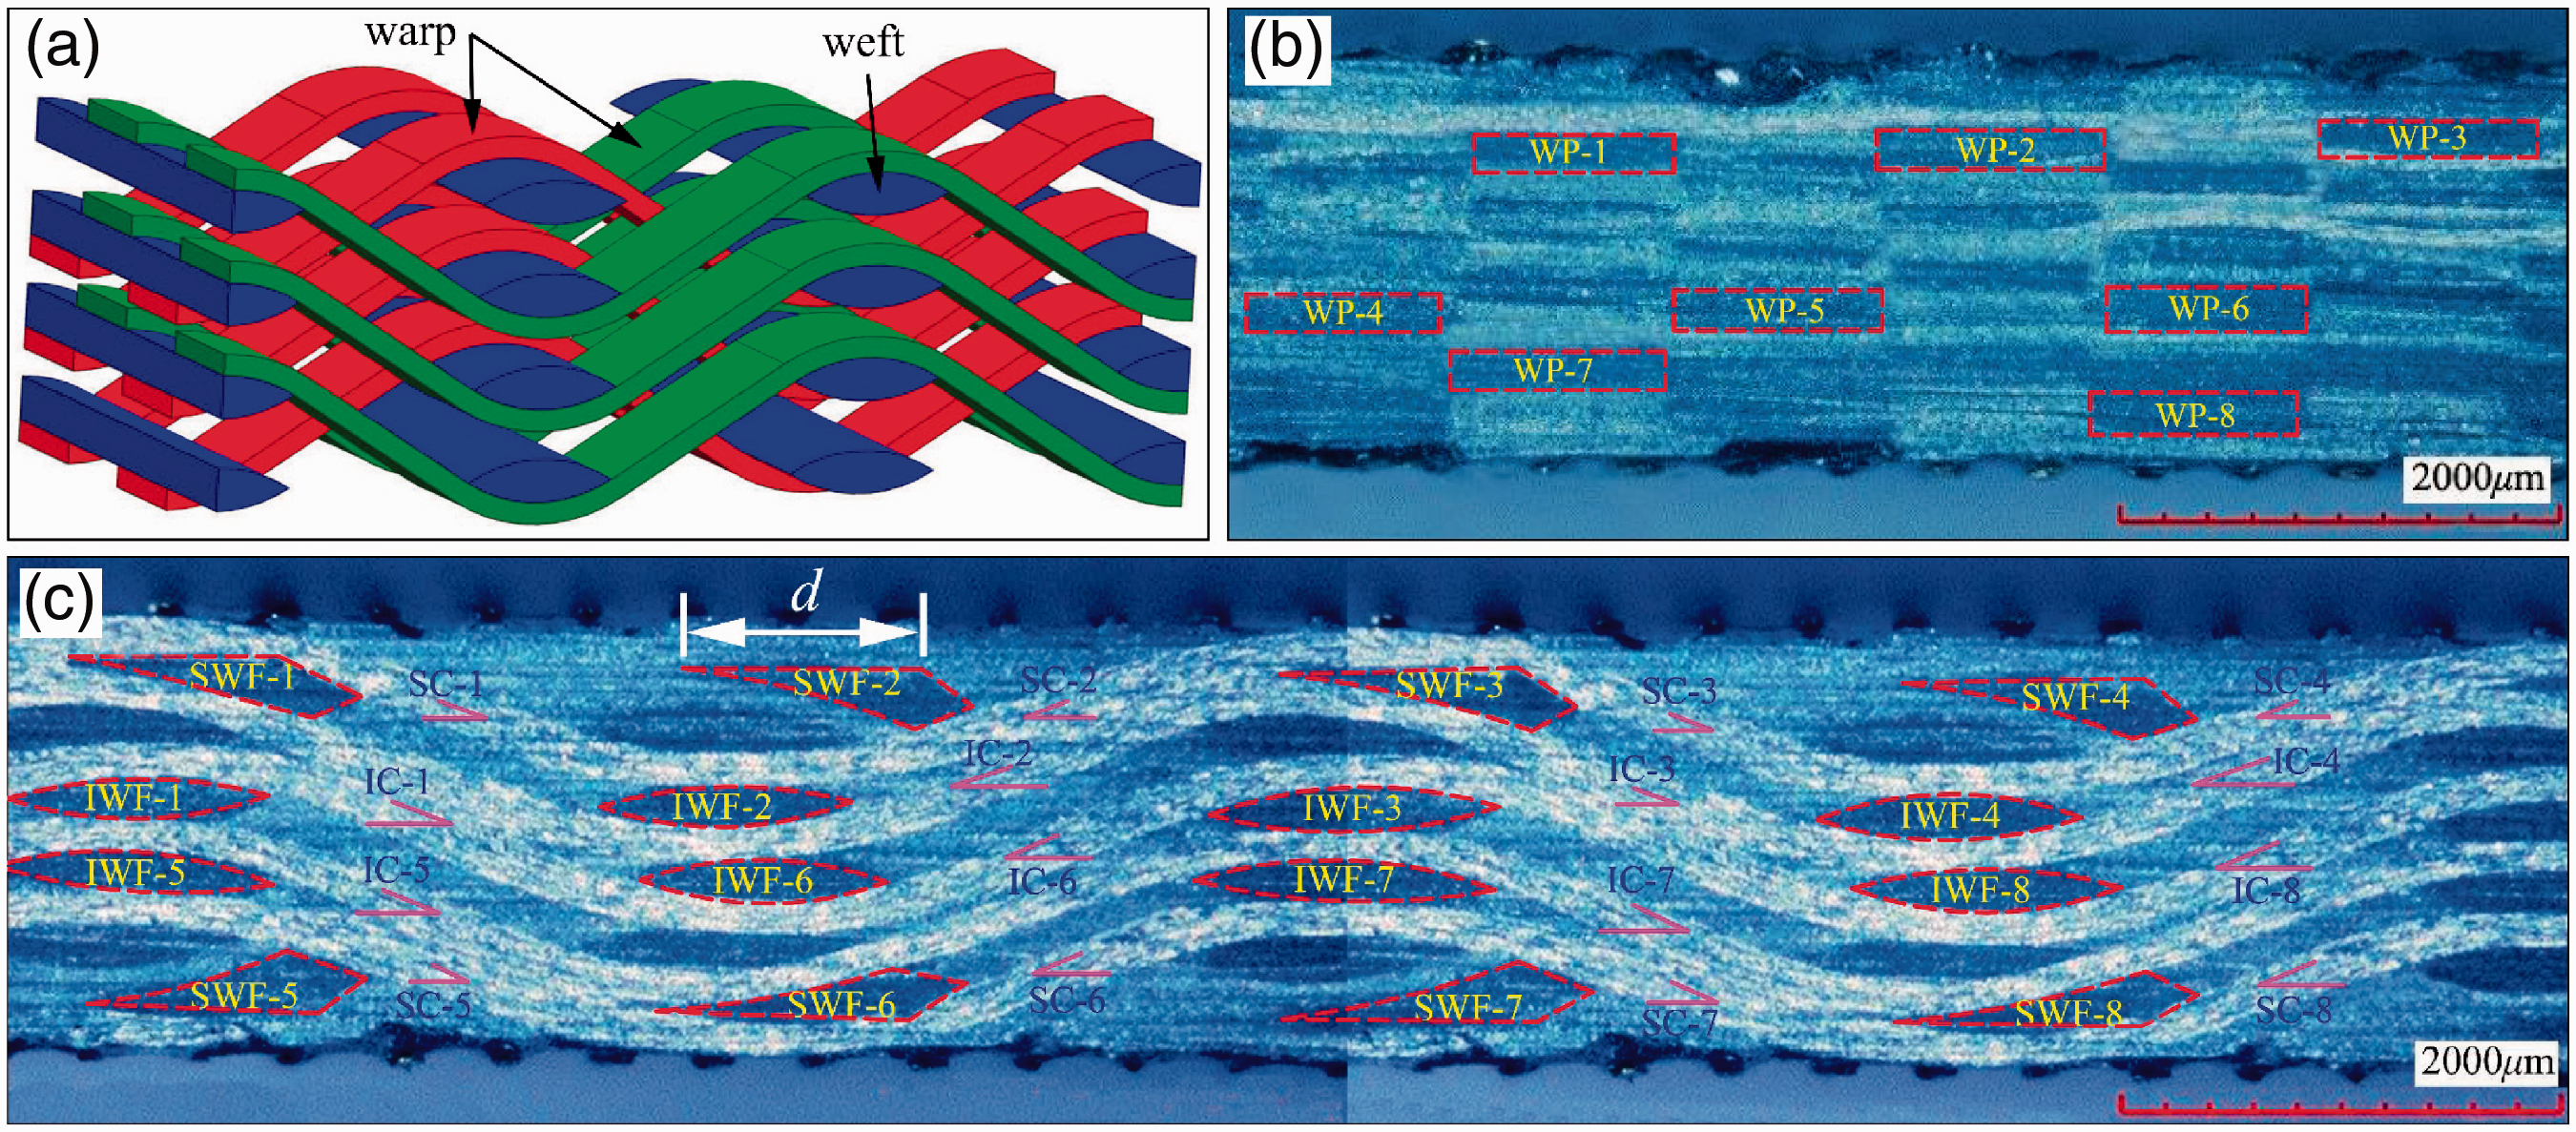
2.5DWC is a material in which warp and weft yarns are woven together by an angle-interlocking way showed in Figure 2(a), and then the resin matrix is injected into the prefabricated fabric through VARTM to be molded. Due to the SEE in the forming process, the microstructure of the surface yarn will be deformed, especially the cross-section of the weft yarn (see Figure 2(c)). Actually, such phenomenon will result in changes in the mechanical property and damage behavior of 2.5DWC, and to predict them more accurately, its microstructure is characterized firstly here.
In this work, it is assumed that the cross-sectional shapes of the warp yarn and internal weft yarn are rectangular and lenticular, respectively. Based on these assumptions, the warp yarn cross-section showed in Figure 2(b) and the weft yarn cross-section showed in Figure 2(c) are characterized. As showed in Figure 2(b), by observing the upper and lower surfaces of the material, it is not found that the cross-sectional shape of the surface warp yarn is significantly different from the internal warp yarn. Therefore, modeling of warp yarn cross-section later in this paper will not distinguish between surface and interior. However, by analyzing the weft yarn cross-section showed in Figure 2(c), it is found that the cross-section is greatly affected by the SEE.
Specifically, it contains the following three points. (1) The surface weft yarn is not the same thing as the internal weft yarn that can be characterized by a lenticular shape, but is extruded into a wedge-like shape. (2) In addition to the shape change of the surface weft yarn, their positions are also squeezed beside the original position. (3) These two changes in the surface weft yarn result in the change of orientation of the surface warp yarn, especially the change of their inclination angles.
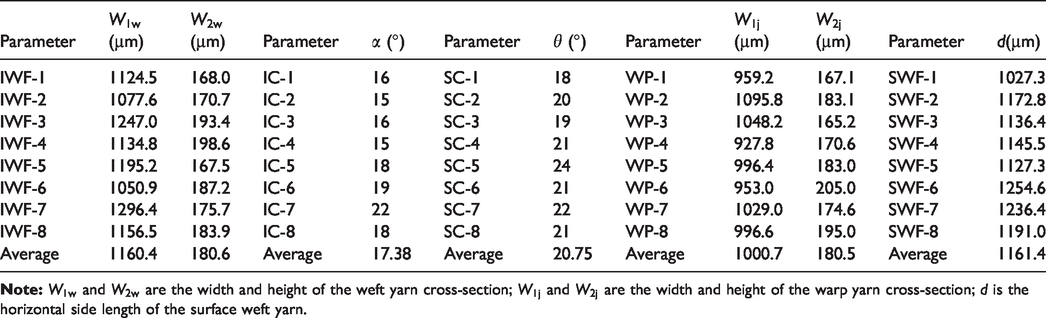
Due to these changes, the geometric parameters of the surface and internal weft yarn are calculated separately. All characterization results are presented in Table 2. In addition, the warp arranged density and weft arranged density are 10 tow/cm and 3.5 tow/cm, respectively, and the total fiber volume fraction is about 45%.
Statistical results of mesoscopic geometric parameters of 2.5DWC.
Experimental settings
Figure 3 shows the experimental tensile setup of the 2.5WC specimen. As showed in Figure 3(a), the specimen is clamped in the MTS809 electro-hydraulic servo-testing machine, and the change of strain is monitored by the MTS-634-25 extensometer. Moreover, the experiment is carried out at a loading rate of 1 mm/min with reference to the ASTM D3039 standard. For more details of the experiment, please see our previous work [31,32].
As showed in Figure 3(b), the geometric size of the specimen is 300 mm × 25mm × 2mm, and the 50 mm × 25mm × 2.5 mm aluminum alloy strengthening plate is pasted at both ends thereof. Moreover, by comparing Figure 3(c) and (d), it is found that the geometric dimensions of the warp-loading and weft-loading specimens are the same, and only the yarn directions are perpendicular to each other.
Implementation process of the TCM system
Model division strategy
Figure 4 illustrates the mechanism of the surface extrusion phenomenon of 2.5DWC and the reason for dividing it from the thickness direction. As showed in Figure 4(a) to (b), the surface weft yarn is not deformed before molding, but it is deformed and moved to the right side after molding, and the surface warp yarn is also flattened, which is consistent with the microscopic observation in Figure 2(c). For the reason of the SEE, in addition to the thermal expansion effect described in Figure 1(c), there is also the pressure effect in the mold. Namely, all the surface weft yarns are offset to the right side uniformly, and there is no random distribution, which is because the pressure at both ends of the VARTM device will drive the surface weft yarn to deviate in one direction (see Figure 4(a)).
Material composition and characterization: (a) 3 D yarn system; (b) characterization of the warp yarn cross-section; (c) characterization of the weft yarn cross-section.

Experimental settings: (a) experimental photograph, (b) the specific geometric dimensions of the specimen, the surface of the (c) warp-loading and (d) weft-loading specimens.

Weft yarn cross-section of 2.5DWC (a) before and (b) after molding; (c) division strategy of the sub-cells.
In order to more accurately simulate the mechanical property and damage behavior of 2.5DWC without loss of generality, the formed material is divided from the thickness direction in this paper. As showed in Figure 4(c), 2.5DWC with WLN = 6 can be divided into three types of sub-cells in thickness direction, namely two symmetrical surface-cells, two symmetrical transition-cells, and an inner-cell. Note that the meaning of WLN (weft-layer-number) should be emphasized here again, that is, the number of weft yarns arranged in the thickness direction, which includes the surface weft yarns, although they are squeezed and deviated from their original position.
Here, there are two things worth noting. (1) The transition-cell can be regarded as the connecting carrier between the inner-cell and surface-cell, and the difference between the transition-cell and inner-cell is only the difference in the inclination angle of the warp yarn (see Figure 4(c)). (2) The inner-cell is the traditional UCM actually, which is used to simulate the mechanical property of 2.5DWC in Refs. [20–22,24].
Micro geometric relationships
Overall geometry of the TCM
For 2.5DWC with different material forming processes and woven parameters, the establishment of an accurate and reasonable micro geometric relationship is the key step to predict the mechanical property. For the proposed TCM system, its whole size depends on the warp arranged density, weft arranged density, and the WLN. According to the coordinate system showed in Figure 5, the overall geometric dimensions of the TCM can be expressed as:
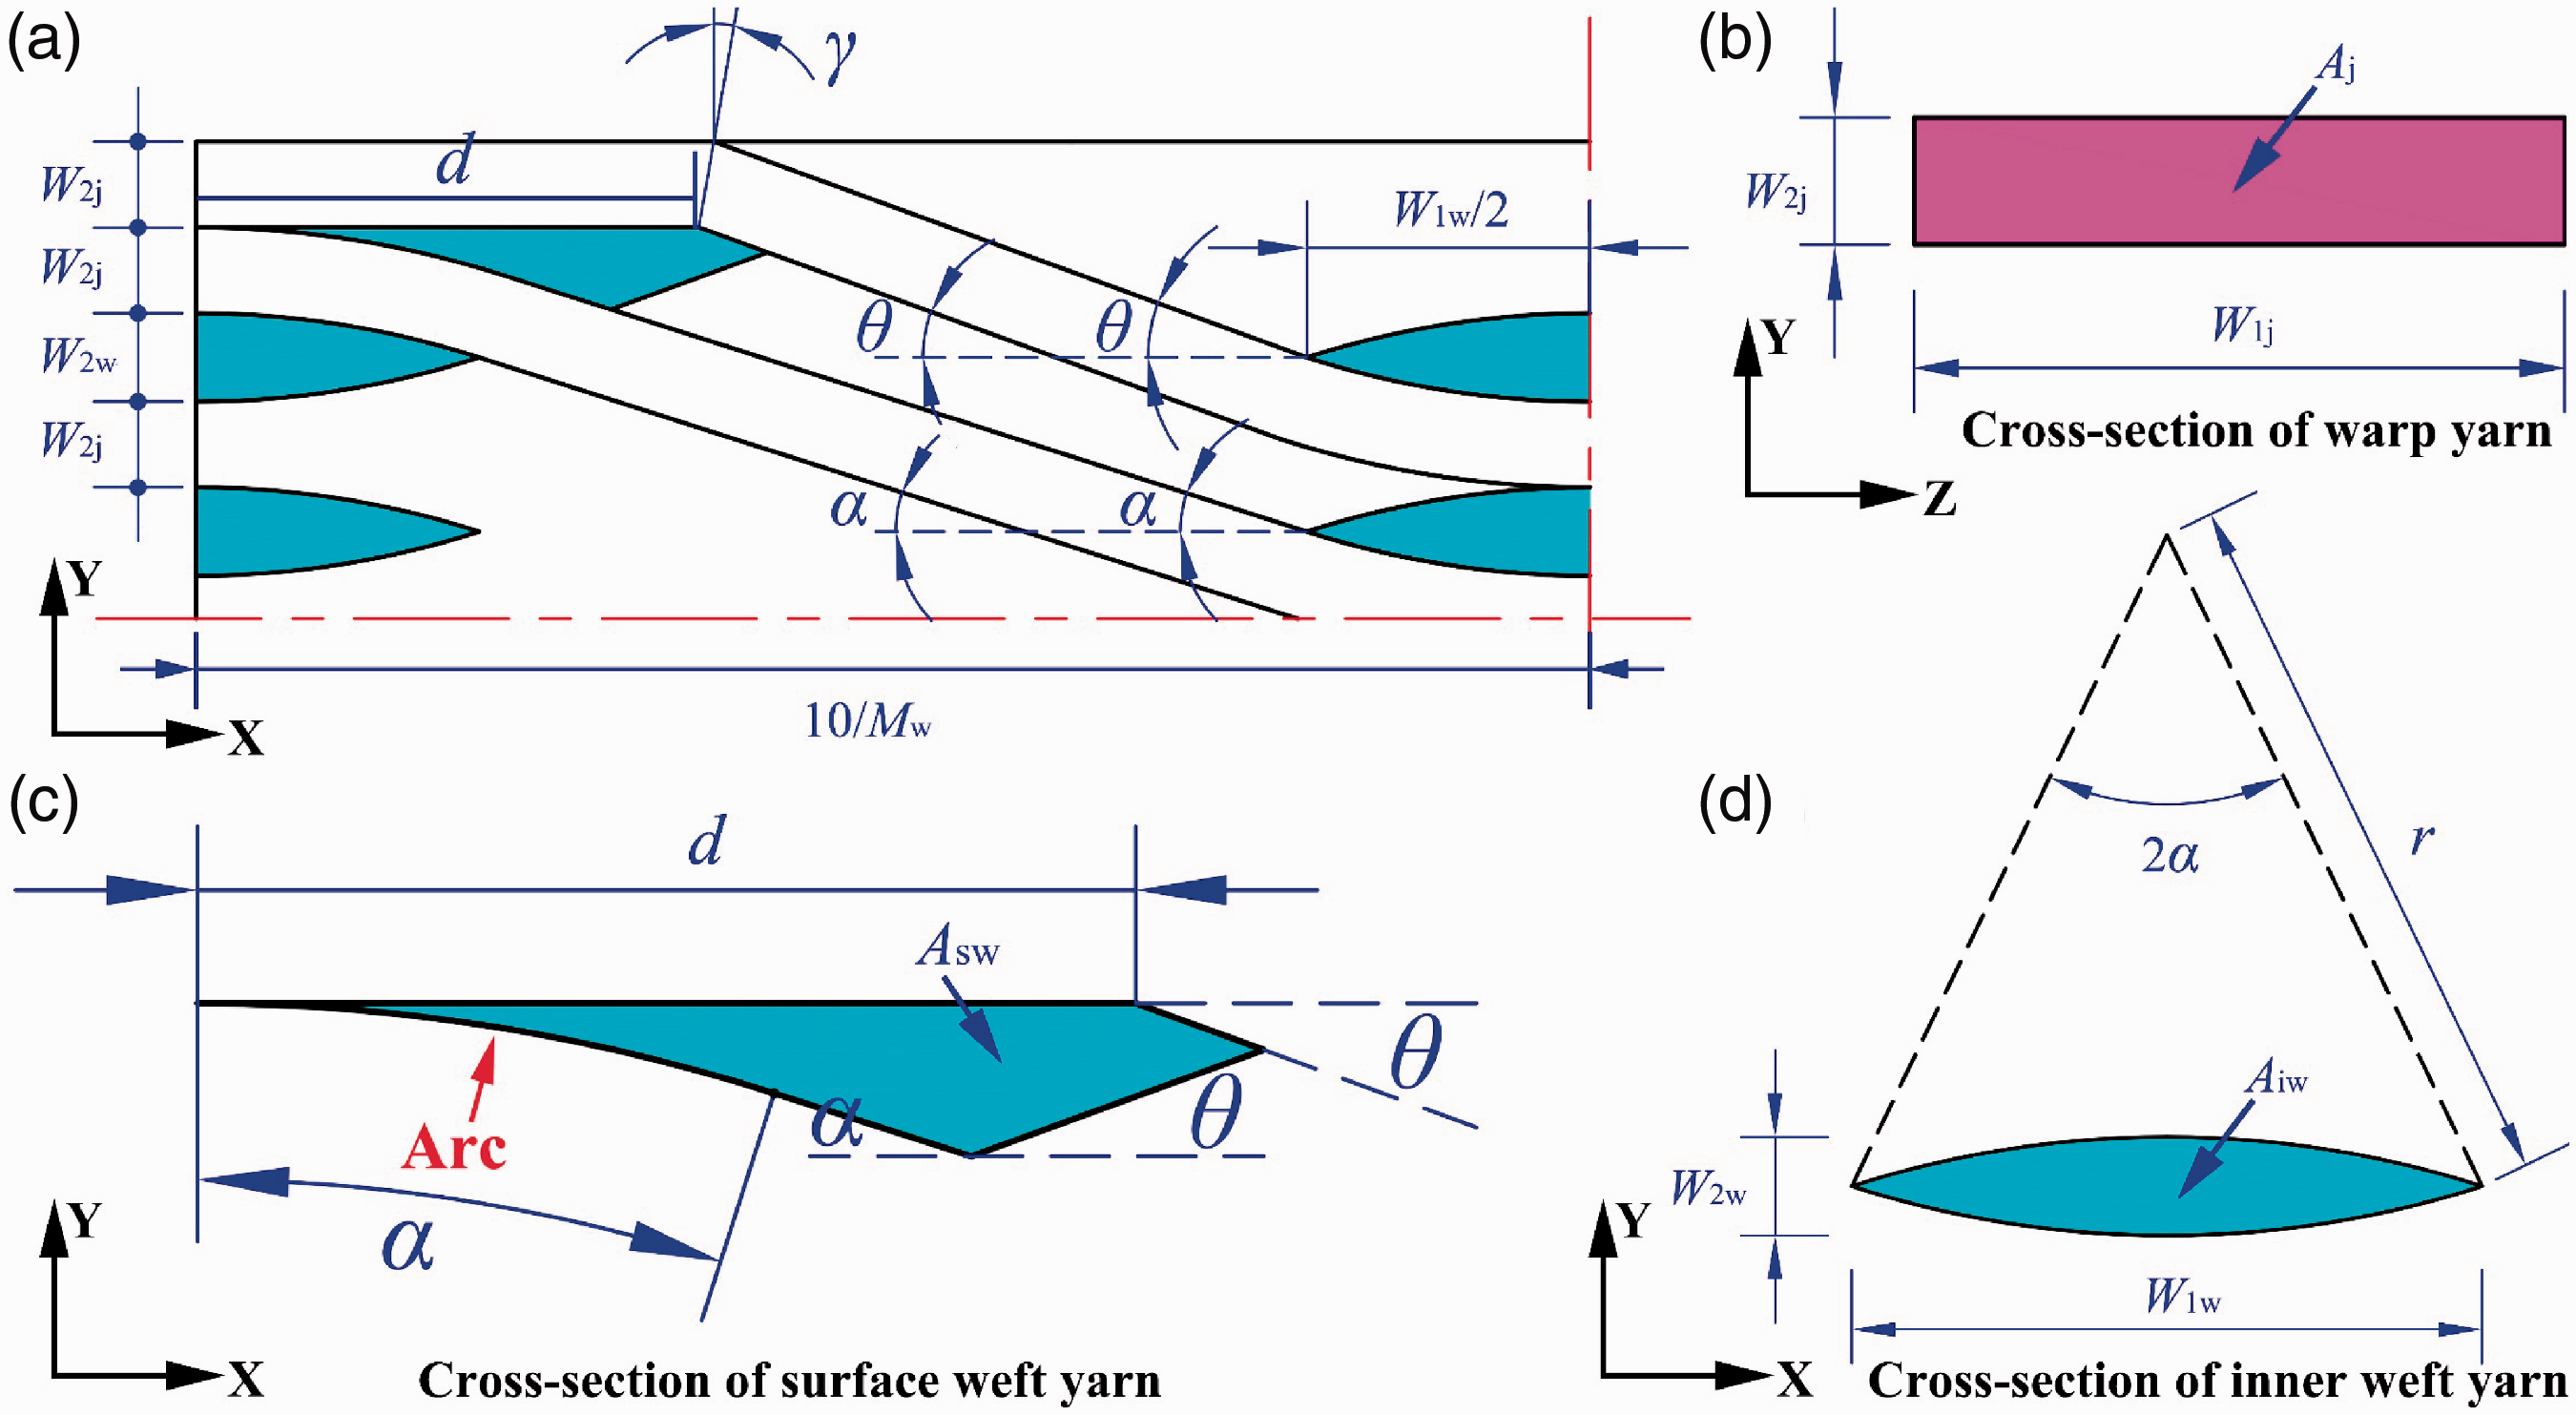
Micro geometric relationships of 2.5DWC: (a) overall constraint relationship between parameters; parameters of (b) warp yarn cross-section, (c) surface weft yarn cross-section and (d) internal weft yarn cross-section.
Shape parameters of different yarn cross-sections
As showed in Figure 5(d), the lenticular-shaped cross-section of the internal weft yarn can be regarded as a combination of two symmetrical circular arcs. Of these two arcs, there is a constraint relationship between the radius, 
Furthermore, to calculate the fiber volume fraction of each part of the yarn, the cross-sectional area of each part of the yarn needs to be calculated [40]. Combining equation (2), one obtains:
The surface weft yarn is squeezed to the right side and surrounded by two warp yarns showed in Figure 5(a). Therefore, as showed in Figure 5(c), the cross-sectional profile of the surface weft yarn can be regarded as a wedge-like shape which is surrounded by three straight lines and an arc. In addition, as long as the horizontal side length, 

Through the above geometric relationship description, the 3 D geometric model of each sub-cell can be built up, and mechanical property of 2.5DWC can be further predicted by the finite element method.
Assembly of the TCM system
Based on the idea of dividing sub-cells and micro geometric constraint relationships established above, the TCM system can be built up showed in Figure 6. There are four RVC models in this system with different WLNs, and each model is composed of one or more of the above three sub-cells. Specifically, when WLN = 3, TCM consists of two surface-cells; when WLN = 4, TCM consists of two surface-cells and one transition-cell; when WLN = 5, TCM consists of two surface-cells and two transition-cells; when WLN ≥ 6, TCM consists of two surface-cells, two transition-cells, and one inner-cell.
There are two things worth mentioning here. First when WLN = 4 and 5, both the TCMs are composed of surface-cell and transition-cell, and they differ by only one transition-cell, which seems to be possible to discuss the TCM (WLN = 4) and TCM (WLN = 5) together. However, due to the asymmetry of the transition-cell in the thickness direction (see Figure 4(c)), we have to distinguish the TCMs with WLN = 4 and 5. Second, when WLN > 6, there is actually multiple inner-cells in the middle of the material (see Figure 6 (d2)). However, we only use a symmetrical inner-cell to replace it, which avoids the disadvantage of modeling in the full thickness direction in the FCM [29,30]. Such simplification may result in less accurate predictions than the FCM, but it greatly reduces the costs of modeling and calculation, especially for the material with high WLN. Reviewing the TCM with different WLNs, it can be found that when the WLN ≤ 6, the TCM is the FCM, and the inner-cell is actually the UCM. As for the dimensions of the other two directions (X and Y) of the TCM, only the minimum repetitive geometric dimensions are selected periodically (see Figure 6(e)).

TCM system with WLN are (a) 3, (b) 4, (c) 5 and (d) ≥6; (e) top view of the TCM.
It must be mentioned here that different braiding and forming processes may lead to differences in the surface microstructure of 2.5DWC. And even in the same process, the surface microstructure of the material with different WLNs may be also slightly different. For example, the surface weft yarn is simply flattened without departing from its original position, or vice versa. Therefore, for 2.5DWC with different processes, different surface-cell and transition-cell should be established, that is, specific analysis of specific problems.
The following is a preliminary comparative analysis of the advantages and disadvantages of several existing RVC models. (i) As showed in Table 3, when the material is very thin, owing to its serious SEE, it is very inappropriate to use the traditional UCM, so the TCM or FCM should be adopted. Note that the described SEE only refers to the change in the micro geometric relationship of the surface area of 2.5DWC, and does not involve the impact of other defects such as porosity. Generally, thin material has fewer defects, but the microscopic geometry of the surface will still change due to the inevitable impact of thermal expansion and pressure difference during the molding process, that is, the traditional UCM is still not suitable for this case. (ii) When the material has medium thickness, such as WLN = 7∼15, the influence of SEE is still relatively obvious, it is still not appropriate to use the UCM, and there are relatively complex modeling problems with the FCM, so it is very appropriate to use the TCM. (iii) When the material is very thick, it will be very complicated to use the FCM to model, and the surface effect can be almost ignored, so it is appropriate to use the UCM or TCM. Therefore, it can be stated that the proposed TCM system has the applicability of arbitrary WLN.
Comparison of applicability of several models with different WLNs.

Progressive damage method for the TCM, UCM, and FCM
Progressive damage technology is currently the mainstream method for strength prediction of composites, especially for the textile composites [41–47]. The progressive damage technique is composed of three parts, namely the stress analysis, element failure analysis and material property degradation. The following are described separately.
Failure criteria
There are many damage modes in the loading process of 2.5DWC, such as the matrix cracking, longitudinal breaking or buckling of the fiber bundle, transversal cracking of the fiber bundle and so on. Among the many failure criteria, the 3 D Hashin's failure criterion [48] is the most widely used one for the fiber bundle. Therefore, this criterion is designed to determine the damage of the fiber bundle in this work. Moreover, for the damage of isotropic resin-rich matrix, it is not necessary to distinguish the damage mode, so the classical von Mises criterion is adopted. The expression of failure criteria is showed in Table 4.
Failure criteria for different elements.

Note:
Moreover, the mechanical property of the fiber bundle can be calculated using the formula in Table 5 based on the material properties of the fibers and pure matrix (see Table 1).
Mechanical property of fiber bundles [33].

Damage evolution equation
When the stress-strain state of the material meets the corresponding failure criteria, the stiffness of the component material will be reduced due to the damage, which is characterized by the element stiffness softening in the finite element model. With the continuous loading, the stiffness of the damaged element will continue to decrease due to the deepening of the damage degree. Therefore, it is extremely important to adopt a reasonable damage evolution equation. In this paper, the damage evolution equation in Ref. [47] is employed to define the damage degree of each element changing with the loading process. As follows.
First of all, an equivalent displacement, 
Then the damage evolution equation can be defined as:
Damage constitutive relationship
After the stress-strain state of the element satisfies the corresponding failure criteria, the initial undamaged stiffness matrix is transformed into a damaged stiffness matrix due to the softening effect. The constitutive relationships of the fiber bundle and the pure resin matrix are described as follows.
Fiber bundle
The damaged constitutive relationship of the fiber bundle can be written as:


Resin-rich matrix
The damaged constitutive relationship of the resin-rich matrix can be described as:

Periodic boundary conditions for the TCM
When analyzing the RVC model of periodic composites, the periodic boundary condition is required. For the periodic boundary conditions of the traditional UCM of 2.5DWC, we can refer to Refs. [50–52]. However, the TCM cannot be imposed according to the periodic boundary conditions of the traditional UCM, because its upper and lower surfaces have been considered. As showed in Figure 7, the modified periodic boundary conditions used in FEM-software are described from the opposite surfaces, edges, and vertices.
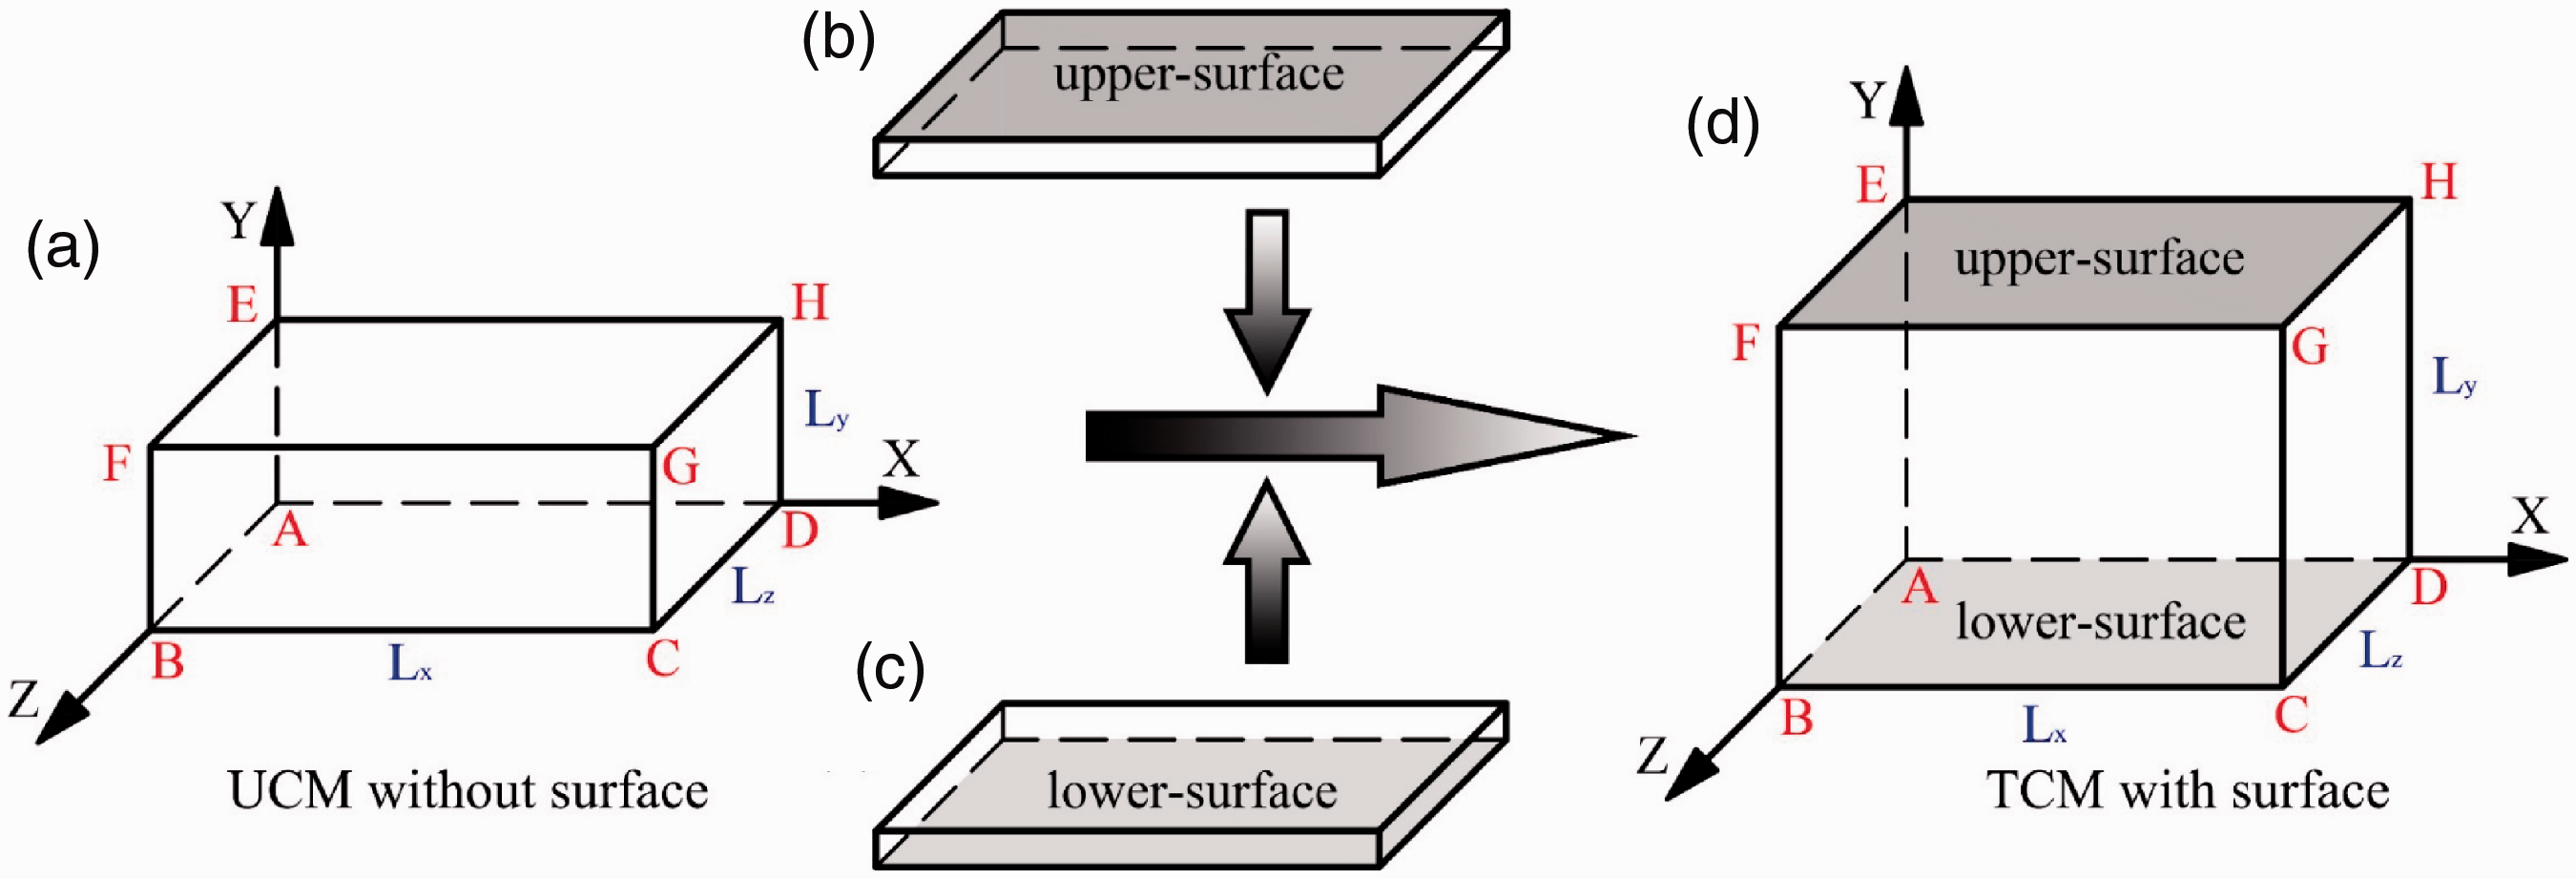
Schematic of the UCM and TCM: (a) UCM without surface; (b) upper-surface; (c) lower-surface; (d) TCM with surface.
Surfaces
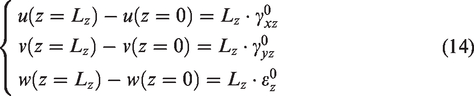
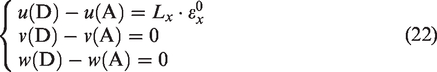
Different from the periodic boundary conditions of the UCM (see Figure 7(a)), there are only two pairs of periodic opposite surfaces (ABFE-DCGH and ADHE-BCGF) in the TCM (see Figure 7(d)), i.e.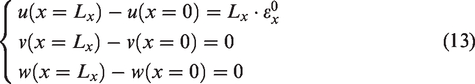
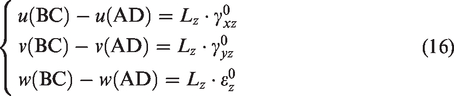
Edges
Due to the SEE of the TCM, the periodicity between the upper and lower surfaces need not to be considered. Therefore, the periodicity of the edge needs to constrain the upper and lower surfaces separately. Here the four edges (AB-DC and AD-BC in Figure 7(d)) of the lower surface are taken as an example, and the similar equations of the edges of upper surface (EF-HG and EH-FG in Figure 7(d)) can be applied.
It is worth noting that the four edges (AE-BF-CG-DH in Figure 7(d)) in the Y-direction have the same periodicity as the UCM, i.e.

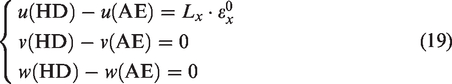
Vertices
For the periodic boundary conditions of vertices in the TCM, similar to edges, it is necessary to distinguish between the upper and lower surfaces. Here the four vertices (A, B, C, and D in Figure 7(d)) of the lower surface are taken as an example, and the similar equations of the vertices of upper surface (E, F, G, and H in Figure 7(d)) can be applied.

Finite element models and simulation settings
Finite element models of the TCM, UCM, and FCM
Figure 8 shows the finite element models of the TCM, UCM, and FCM, and the element type of SOLID185 in ANSYS software is employed in these models. As showed in Figure 8(a) to (d), there are four models in the TCM system, namely the FCM (WLN = 3), FCM (WLN = 4), FCM (WLN = 5), and FCM (WLN = 6). In addition, it is worth noting that the core idea of this work is to use the FCM (WLN = 6) as the RVC to predict the mechanical property of 2.5DWC when WLN ≥ 6. In order to show the rationality of this idea, FCM (WLN = 8) showed in Figure 8(e) is established for comparative analysis. Figure 8(f) shows the finite element model of the traditional UCM, which can also be called inner-cell in this paper. The size effect and SEE are not considered in this model, causing the low calculation accuracy, but its computational cost is relatively low, and it lays an important foundation for the later development of the RVC of 2.5DWC.
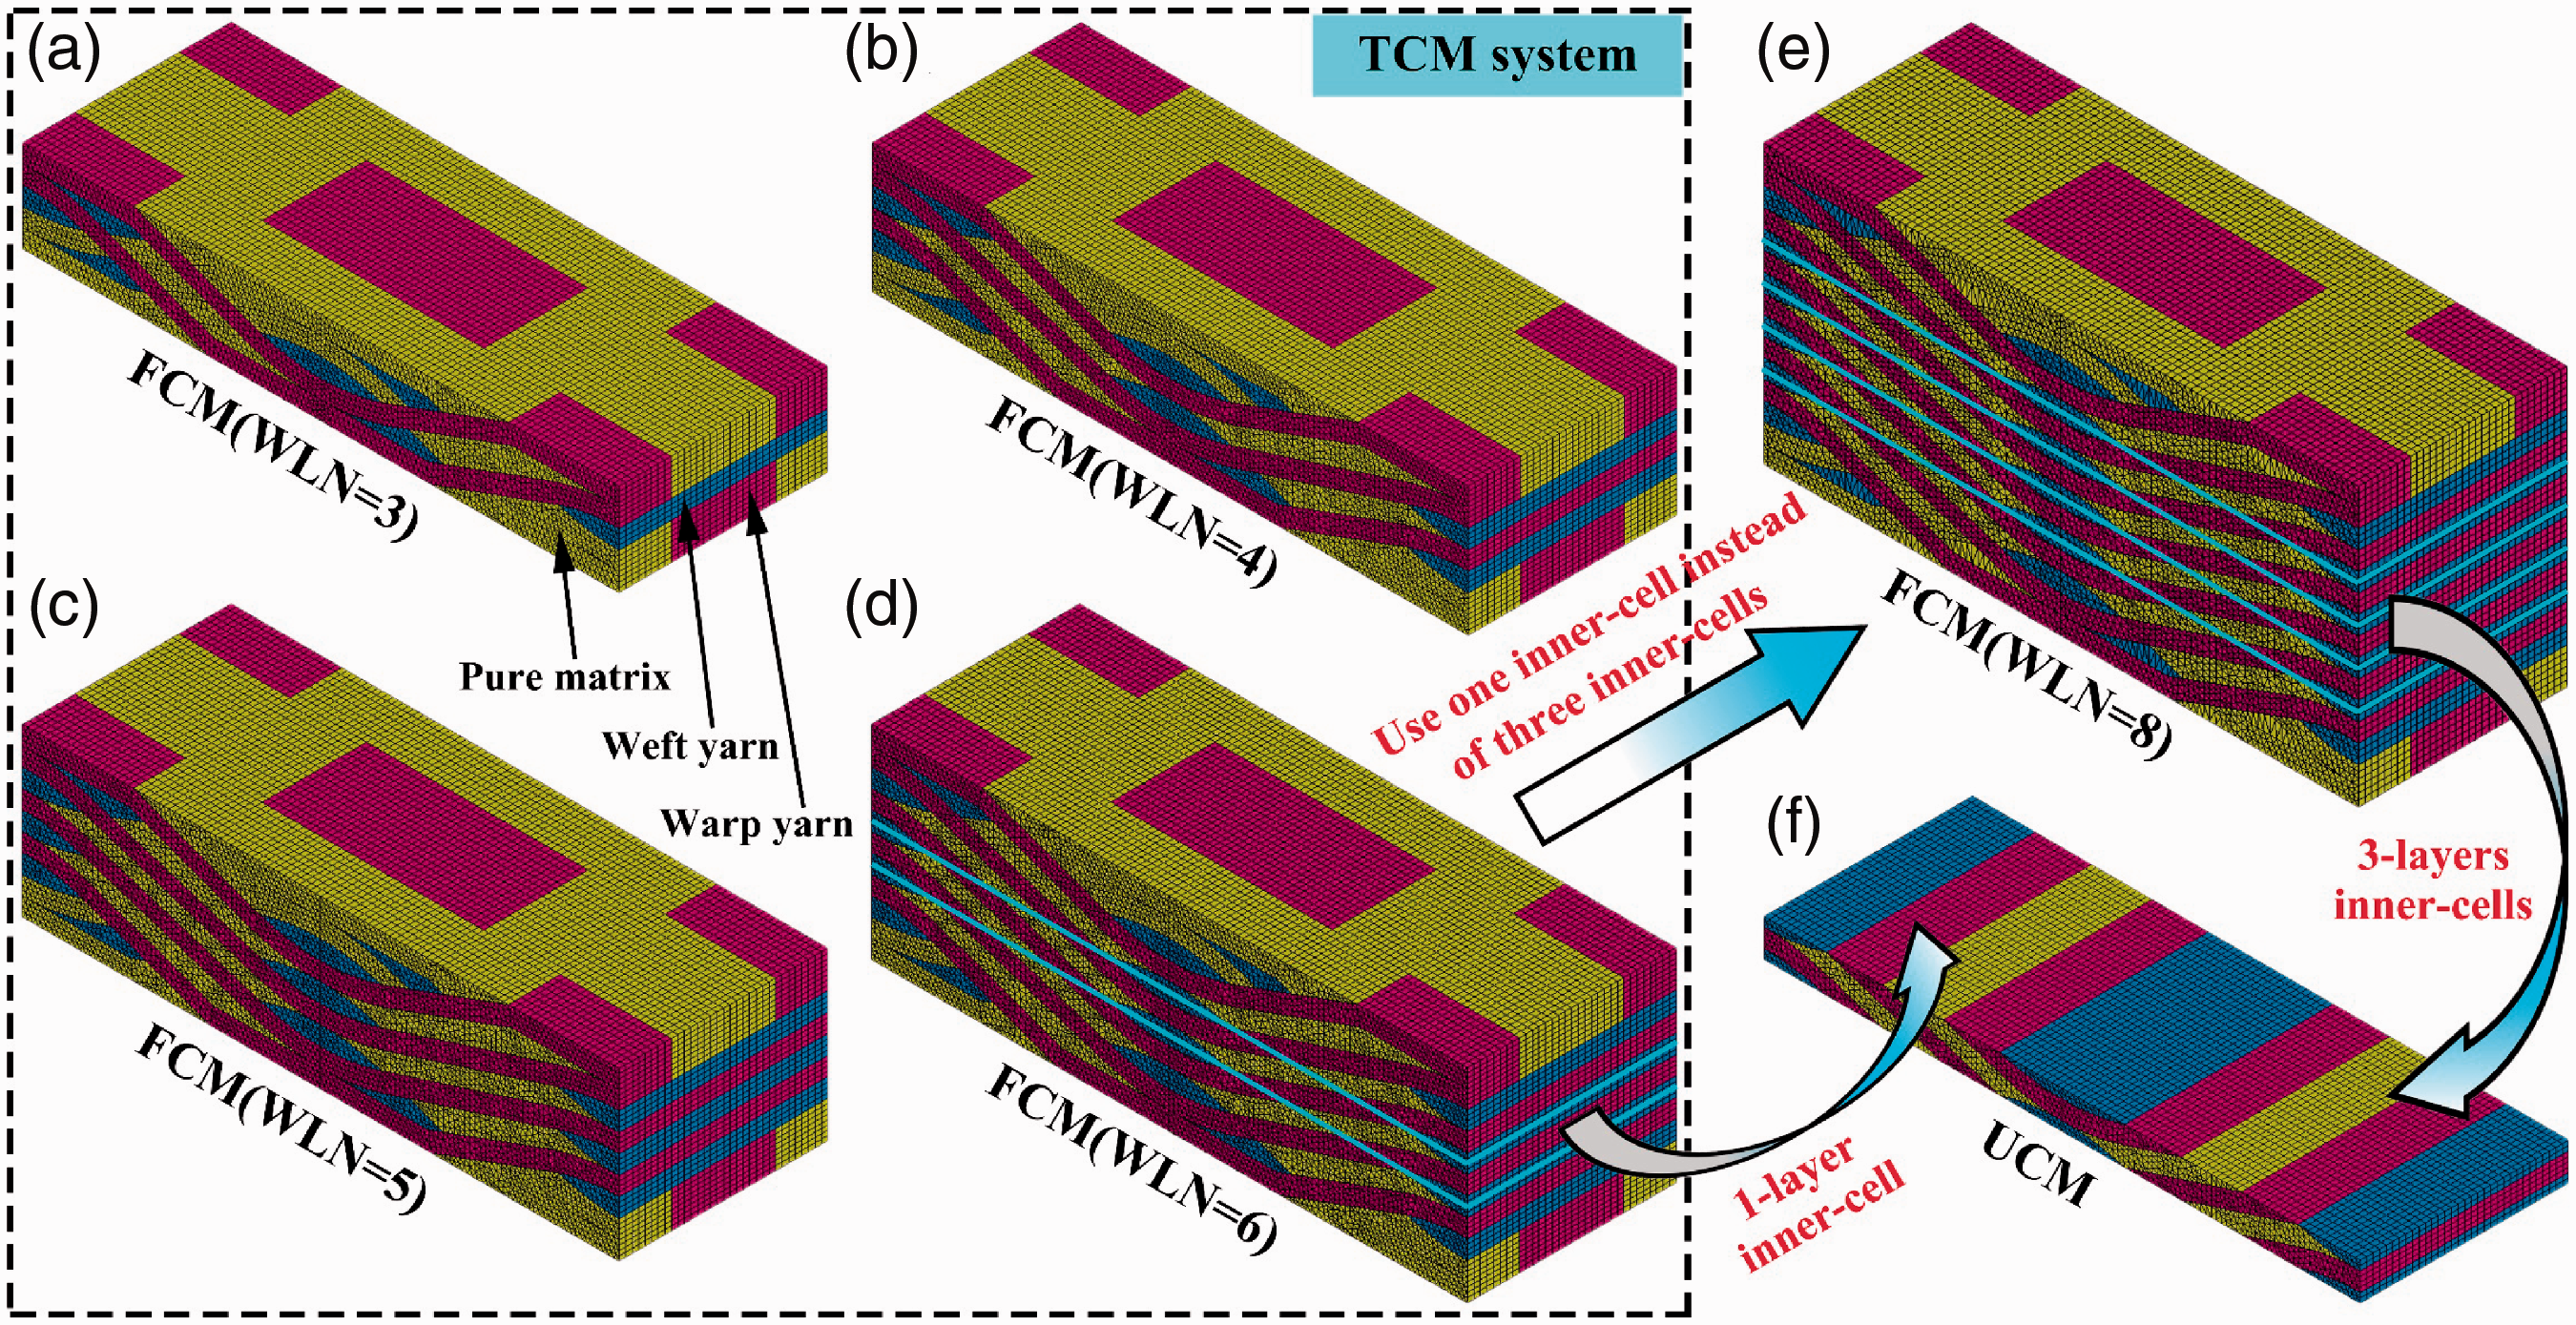
Finite element model of the TCM, including the (a) FCM (WLN = 3), (b) FCM (WLN = 4), (c) FCM (WLN = 5), and (d) FCM (WLN = 6), (e) the FCM (WLN = 8), and (f) the UCM.
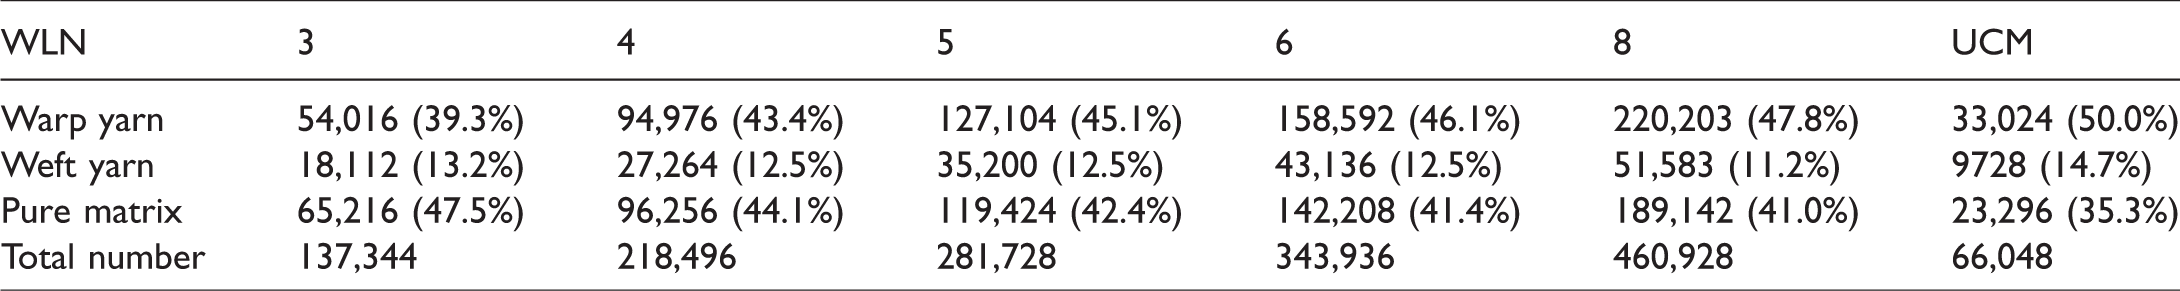
Table 6 displays the information statistics of each finite element model in Figure 8. In general, the proportion of the number of the mesh of all components remains stable within a range. But after careful analysis, it can be found that with the increase of WLN, the proportions of warp mesh and matrix mesh slightly increase and decrease, respectively. This is due to the highest proportion of warp mesh (50.0%) and the lowest proportion of matrix mesh (35.3%) in the inner-cell. In addition, the larger is the WLN, the greater is the mesh number in the model. For example, when WLN = 8, the mesh number in the model is close to 500,000. In other words, when the WLN reaches a certain level, the mesh number will be very large, thus leading to the huge calculation cost, which is not desirable in engineering analysis. Therefore, the necessity of the TCM system is proved from this perspective.
Statistics of meshes of different models.
Simulation settings and process
In the simulation of these models, property parameters of the resin matrix and the fiber monofilament are showed in Table 1, and the mechanical property of the fiber bundle can be calculated by substituting these parameters into the formula in Table 5. In addition, geometric parameters in the TCM system can be obtained by referring to the average values in Table 2, and other geometric parameters can be calculated according to the geometric relationship in ‘Micro geometric relationships’ section. Finally, the simulation analysis is carried out according to the progressive damage method in ‘Progressive damage method for the TCM, UCM, and FCM’ section and the periodic boundary conditions in ‘Periodic boundary conditions for the TCM’ section. The APDL language and USERMAT in ANSYS software are employed to write the simulation process and the damaged material model, respectively.
As showed in Figure 9, the specific simulation process can be described as follows: 2.5DWC is micro-characterized to make reasonable assumptions about the yarn cross-section, and the geometric relationship in this material is established based on the cross-sectional assumption and the characterization results. The geometric models of three sub-cells, namely the surface-cell, the transition-cell, and the inner-cell, are established, respectively, and the corresponding RVC of 2.5DWC is formed by combining them according to the values of WLN. The formed RVC of 2.5DWC is meshed, periodic boundary conditions are applied to the RVC, material models are assigned to the components, and iterative calculations are performed finally. The macroscopic mechanical property of 2.5DWC are calculated according to the average stress/strain formula.

The simulation process of the TCM to obtain the macroscopic mechanical property of 2.5DWC.
Results and discussions
Stress distribution and stiffness analysis
Stress distribution of different models
Figures 10 and 11 shows the von Mises stress cloud diagrams of different models under the warp-loading and weft-loading when the total strain is 0.1%, respectively. Obviously, regardless of the warp-loading or weft-loading, there is no significant difference in the stress distribution of the TCM (or the FCM) with different WLNs, including the FCM (WLN = 8). For example, even with different WLNs, the stress concentration positions appear at the turning point of the surface warp yarn and the sharp corner position of the surface weft yarn under the warp-loading and weft-loading, respectively. However, the stress distribution of the TCM (or the FCM) is significantly different from those of the traditional UCM, which is due to the mechanical property of the surface-cell and transition-cell is different from those of the inner-cell.

von Mises stress cloud diagrams of different models under the warp-loading: (a) WLN = 3, (b) WLN = 4, (c) WLN = 5, (d) WLN = 6, (e) WLN = 8, and (f) UCM.

von Mises stress cloud diagrams of different models under the weft-loading: (a) WLN = 3, (b) WLN = 4, (c) WLN = 5, (d) WLN = 6, (e) WLN = 8, and (f) UCM. Note that the resin-rich matrix area is removed in this figure.
In fact, the traditional UCM is the inner-cell of the TCM, so the UCM can reflect the stress distribution inside the material when WLN ≥ 6. However, when the damage occurs, the UCM cannot truthfully reflect the internal damage of the material, the specific reasons will be analyzed later.
In addition, by comparing the difference between these two directions, it is found that the stress of the warp yarn is significantly greater than that of the weft yarn under the warp-loading, but it is the opposite under the weft-loading, which is consistent with the analysis in many literature [12,13,20,21,29,30,37]. The main reason for this phenomenon is that the warp yarn is the main carrier under the warp-loading, and similarly for the weft-loading.
There are two things need to be noted. First, under the warp-loading, the overall longitudinal direction of the warp yarn (although the warp yarn shows a wave shape) is consistent with the loading direction, so the warp yarn is the main carrier at this case. The same is true for the weft-loading. Second, the stress difference between these two kinds of yarn under the warp-loading is obviously not as large as that under the weft-loading, which is determined by the shape of the warp yarn and the loading conditions. That is, the wave shape of the warp yarn and the angle-interlocking structure cause the weft yarn to be extruded by the warp yarn under the warp-loading, while the straight structure of the weft yarn determines that it will not squeeze the warp yarn under the weft-loading.
Modulus verification and its variation law with different WLNs
Table 7 shows the comparison between the predicted modulus of different models and the experimental results. The results show that the error between experimental results and the predicted values of the TCM is obviously smaller than that of the UCM when WLN = 6, which proves the accuracy of the proposed TCM system. Moreover, by comparing the difference in predicted modulus of the FCM (WLN = 8), the TCM (WLN = 6), and the UCM, it is found that the difference between the FCM (WLN = 8) and TCM (WLN = 6) does not exceed 2%, which is much smaller than that between the FCM (WLN = 8) and UCM. Therefore, it is feasible to use TCM (WLN = 6) to predict the modulus when WLN ≥ 6.
Comparison between the predicted modulus of different models and the experimental results [30].

Figure 12 shows the variation trend of warp-modulus and weft-modulus with different WLNs. Obviously, with the increase of WLN, both the moduli predicted by the TCM (or the FCM) increase, but the slope of the curve decreases, namely the modulus show a certain tendency. This is because the proportion of inner-cell increases with the improvement of WLN, and the mechanical property of inner-cell is the strongest. Moreover, it is worth noting that the modulus predicted by the TCM will not tend to that predicted by the UCM with the increase of WLN, but should be some value less than the predicted value of the UCM. This is because the SEE not only weakens the mechanical property of the material, but also affects the stress distribution inside the material.

Relationships between the equivalent moduli predicted by different models and WLN: (a) warp-modulus and (b) weft-modulus.
It should be mentioned that the SEE considered in the TCM is the characterization results of 2.5DWC with WLN = 6. However, as we all know, the smaller is the WLN (or thickness), the fewer are defects, causing the actual modulus with low WLN to be larger than the predicted value of the TCM.
Strength analysis and stress-strain response
Strength verification and its variation law with different WLNs
Table 8 shows the comparison between the predicted strength of different models and the experimental results. By comparing the experimental results and the predicted strengths of the TCM (WLN = 6) and UCM, it is obvious that the prediction accuracy of the TCM is significantly higher than that of the UCM, which proves the effectiveness of using TCM to predict the strength of 2.5DWC. However, by comparing the predicted weft-strength with warp-strength, it is found that the prediction accuracy of weft-strength is higher than that of warp-strength. This is because the damage mode of the warp-loading is more complex than those of the weft-loading, leading to the prediction accuracy in warp direction is far lower than that in weft direction. Moreover, by comparing the difference in predicted strength of the FCM(WLN = 8), the TCM (WLN = 6), and the UCM, it is found that the biggest error between the FCM (WLN = 8) and TCM (WLN = 6) is only 3.66%, which is smaller than that between the FCM (WLN = 8) and UCM. Therefore, it is feasible to use TCM (WLN = 6) to predict the strength when WLN ≥ 6.
Comparison of predicted strengths by different models with experimental results [31].

Figure 13 shows the variation trends of warp-strength and weft-strength with different WLNs. It is found that both the warp-strength and weft-strength have the similar growth trend with their corresponding modulus with the increase of WLN. The reason is similar to that of modulus, which will not be repeated here. However, by comparing the increase amplitude of these two predicted strengths, it can be seen that the amplitude of warp-strength is much greater than that of weft-strength. The reason for this difference is the complexity and diversity of the damage propagation in warp direction. In addition, the gap between the predicted strength of the FCM (WLN = 8) and TCM (WLN = 6) is much smaller than that of the FCM (WLN = 8) and UCM, which corresponds to the analysis in Table 8.

Relationships between the strengths predicted by different models and WLN: (a) warp-strength and (b) weft-strength.
Verification of stress-strain response and its variation law with different WLNs
Figure 14(a) and (b) show the stress-strain curves obtained by the UCM, TCM (WLN = 6), and experiments. Generally speaking, regardless of the warp-loading or weft-loading, the curve of the TCM (WLN = 6) is closer to the experimental curve than that of the UCM. Moreover, by comparing different loading phases of the TCM (WLN = 6), it is found that the linear phase is very close to the experimental curve, while the nonlinear phase, especially in its later period, is not very consistent. There are two reasons for this phenomenon. First, various types of damage will occur in the nonlinear phase, especially the fatal damage that can weaken the bearing capacity, such as the longitudinal fracture of the main load-bearing fiber bundle. Of course, there are matrix damage and fiber bundle transversal damage in the nonlinear phase, but these two damages are not the main reason for the discreteness in this phase. Second, in the model established in this paper, the influence of defects other than the SEE, such as porosity, are not considered, and this influence will have a coupling effect with the damage propagation, which makes the experimental curve more nonlinear.

(a) and (b) are the comparisons between the stress-strain curves predicted by various models and the experimental loading curves [29]. (c) and (d) are the stress-strain curves with different WLNs predicted by TCM. Among them, (a) and (c) are obtained by loading in the warp direction; (b) and (d) are obtained by loading in the weft direction.
Figure 14(c) shows the warp-loading stress-strain curves obtained by the TCM system with different WLNs. Note that the nonlinear phase can also be divided into a weak nonlinear phase and a strong nonlinear phase, and the classification standard is whether the damage is fatal (weakening the bearing capacity). When the curve passes the linear phase and enters the weak nonlinear phase, some non-fatal damage occurs in the material, which is mainly dominated by the micro cracks in the resin-rich region. In fact, only the curve with WLN = 3 shows obvious weak nonlinearity in this phase, and the other curves almost grow linearly.
When the curve reaches the strong nonlinear phase showed in Figure 14(c), fatal damage starts to occur in the material, which is mainly caused by the breakage of the main load-bearing fiber bundle. In this phase, each curve reaches the highest point, which is the strength value of 2.5DWC with different WLNs. It is worth noting that the strain at which the material with WLN = 3 begins to fail is 1.1%, while the others are 1.2%. This is because the volume proportion of the surface part is relatively large when the material is thin (low WLN), which leads to the material failure early because there are not enough intact fibers to carry on the load in the subsequent stage. Therefore, it can be deduced that in the actual test, the initial failure strain of the material increases with the improvement of WLN. However, with the increase of WLN, the proportion of the surface part becomes smaller, so that the initial failure strain tends to a stable value.
Figure 14(d) shows the weft-loading stress-strain curves obtained by the TCM system with different WLNs. The weft-loading process is different from the warp-loading process that needs to be divided into three phases, because the straight shape of the weft yarn determines that the weft-loading process is not as complex as the warp-loading process. In the linear phase, there is almost no damage in the material, and all curves almost grow linearly. Subsequently, the fatal damage almost directly occurs in the material, which makes the curve enter a short nonlinear phase. This phenomenon is similar to the instantaneous break of unidirectional composites under longitudinal loading. It is worth noting that the initial failure strain of weft-loading is not the same as that of warp-loading, which does not change with different WLNs and is constant at 0.75%. This phenomenon indicates that the surface factor has little effect on the initial failure strain of weft-loading, because the number of fibers in the surface wedge-like weft yarn does not change, but only the fiber volume fraction increases slightly.
Progressive damage process with different WLNs
The modulus, strength, and stress-strain curve of 2.5DWC have been preliminarily analyzed. To further explore the failure behavior of 2.5DWC with different WLNs, the damage process is simulated in this section.
Loading in warp direction
Figures 15 and 16 show the damage propagation of 2.5DWC with different WLNs under the warp-loading. The initial damage in Figures 15(1) and 16(1) starts from the strong nonlinear phase showed in Figure 14(c); the damage propagation in in Figures 15(2) and 16(2) corresponds to the highest point of each curve in Figure 14(c); the final damage in Figures 15(3) and 16(3) corresponds to the final failure point of each curve in Figure 14 (c). Figures 15 and 16 are analyzed in detail below.

Damage propagation of yarns during warp loading predicted by different models: (a) WLN = 3; (b) WLN = 4; (c) WLN = 5; (d) WLN = 6; (e) UCM. Moreover, WPLD and WPTD represent warp longitudinal damage and warp transverse damage, respectively. WFLD and WFTD represent weft longitudinal damage and weft transverse damage, respectively. MD represents pure matrix damage.

Damage propagation of pure matrix during the warp-loading process predicted by different models: (a) WLN = 3; (b) WLN = 4; (c) WLN = 5; (d) WLN = 6; (e) UCM.
Initial damage of yarn
As showed in Figure 15(1), the initial damage location and mode with different WLNs are similar, which are all transversal cracks at the turning points of the surface warp yarn and at the obtuse corner position of the surface weft yarn, caused by the squeeze between the warp and weft yarns. But by analyzing the damage degree with different WLNs, it is found that the damage degree with WLN = 3 is more serious than others. This is because the proportion of surface-cell is larger with the low WLN, which makes the bearing capacity of the material is poor and causes the release of external work requires more elemental damage.
In addition, by analyzing the initial damage of the UCM, it is obvious that the initial damage of the UCM is more serious than that of the TCM, and the damage is located at the edge of the curved segment of the internal warp yarn. In other words, the simulation results of the UCM show that the initial damage of 2.5DWC is inside the material. Obviously, this is not consistent with the experimental reality, proving the importance of considering the surface factors when establishing the RVC model and the rationality of the proposed TCM system.
Damage propagation of yarn
As showed in Figure 15(2), the damage location and mode of the TCM with different WLNs are still similar. Among them, the damage, including the longitudinal and transversal damage, of the surface warp yarn is mainly concentrated at their turning point, and a small amount of longitudinal damage is located at the curved-straight junctions of the internal warp yarn. However, the damage mode of weft yarn is mainly the transversal damage, which is mainly concentrated on the surface part. It is worth noting that there is a small amount of longitudinal damage occurs in the middle of the weft yarn, which is caused by the shearing stress between the warp and weft yarns.
Then, by comparing the damage degree of each TCM with different WLNs, it is observed that the damage degree of the surface yarn is more serious with the decrease of WLN. This is because as the WLN increases, the proportion of surface-cell with weak bearing capacity decreases and the release of strain energy extends to the interior of the material, resulting in damage to the internal yarn. For example, when WLN = 3, there is only two surface-cells in the model, causing the release of energy cannot be extended to the inside, and only the surface yarn can be continuously damaged to be released.
Moreover, by analyzing the damage status of the UCM, it is found that the damage of the warp yarn is mainly concentrated on its curved-straight junction. This is because there is no surface-cell in the UCM, and energy can only be released through the relatively weak points in the warp yarn. Moreover, the weft transversal damage in the UCM is similar to that in the TCM, but its weft longitudinal damage is more serious than that in TCM, which is also caused by the absence of surface-cell in the UCM. Therefore, this defect of the UCM illustrates the importance of considering the surface extrusion effort in the RVC modeling again and the effectiveness of the proposed TCM system.
Ultimate damage of yarn
As showed in Figure 15(3), there is no new damage mode appears at this stage, but the degree of each damage is more serious. A typical sign of final failure of 2.5DWC under the warp-loading is that longitudinal damage penetrates each warp yarn, causing the material to lose its bearing capacity. When WLN = 3, the damage cannot penetrate into the interior and can only accumulate on the surface yarn due to the absence of internal yarn. Obviously, the damage at the turning point of the surface warp yarn in the TCM (WLN = 3) is more serious than the other three TCMs at the final failure stage, which also causes this model fails prematurely.
Then, by comparing the surface yarn damage of three TCMs (WLN > 3), it is found that they are similar. However, by comparing their damage degree of internal yarn, it is found that the damage degree of internal yarn is more serious with the decrease of WLN. From the perspective of energy conservation, this is because the energy can be more evenly and gently distributed to each yarn as the number of internal yarn increases.
Furthermore, by analyzing the final failure of the UCM, it is found that the fatal failure is due to the longitudinal damage spreads the whole curved-straight junctions of the internal warp yarn, which is similar to the TCM. However, comparing with the TCM, the weft longitudinal damage in the UCM is more serious, and the specific manifestation is that the weft yarn is almost cut off, which is inconsistent with the test fracture which will be analyzed in detail below.
Damage of resin-rich matrix
Figure 16 shows the damage propagation process of the resin-rich matrix of different models under the warp-loading. Overall, regardless of the TCM (WLN > 3) or UCM, the matrix damage process is similar, that is, the UCM can also faithfully reflect the damage behavior of the resin-rich matrix under the warp-loading when WLN > 3. Specifically, the initial damage occurs at its weakest point, namely the intermediate position of the curved-segment of the warp yarn. Subsequently, the damage extends along the weft direction to the edge of the model, and then extends along the warp direction until the material fails. However, when WLN = 3, the damage extends directly along the warp direction owing to the lack of inner-cell or transitional-cell.
The above analysis shows that the SEE almost have no impact on the matrix damage under the warp-loading. This is because the matrix damage starts from the inside of the material, and it is not much related to the surface part. Therefore, compared with the TCM, when WLN > 3, the UCM can more clearly reflect the matrix damage behavior under the warp-loading. Actually, 2.5DWC with WLN = 3 is rarely used in engineering, so this is without prejudice to the application range of the UCM in matrix damage behavior under the warp-loading.
Loading in weft direction
Figures 17 and 18 shows the damage propagation of 2.5DWC with different WLNs under the weft-loading. The initial damage in Figures 17(1) and 18(1) starts from the nonlinear phase showed in Figure 14(d); the damage propagation in Figures 17(2) and 18(2) corresponds to the highest point of each curve in Figure 14(d); the final damage in Figures 17(3) and 18(3) corresponds to the final failure point of each curve in Figure 14(d).

Damage propagation of yarns during weft loading predicted by different models: (a) WLN = 3; (b) WLN = 4; (c) WLN = 5; (d) WLN = 6; (e) UCM.

Damage propagation of pure matrix during the weft-loading process predicted by different models: (a) WLN = 3; (b) WLN = 4; (c) WLN = 5; (d) WLN = 6; (e) UCM.
Compared with the warp-loading process, the damage mode under the weft-loading are simpler. There are only two damage modes appear, that is, the weft longitudinal damage and warp transverse damage. A detailed analysis of Figures 17 and 18 is made below.
Initial damage of yarn
As showed in Figure 17(1), different from the warp-loading which only the transversal damage is initially generated, the weft-loading directly produces the longitudinal damage at the sharp corner of the surface weft yarn. This is because the position is the weakest and thereby pulled off longitudinally.
Then, by analyzing the damage degree with different WLNs, it is found that the damage degree is the lightest when WLN = 3, which is obviously different from the initial damage of the other three TCMs. With the increase of WLN, the damage degree also tends to become more serious. To explain this phenomenon, it should be noted that the stress in the inner-cell or transition-cell under the same weft-loading strain is greater than that in the surface-cell, which can be easily analyzed from the initial damage of the UCM. Based on this matter, the stress in the TCM (WLN = 3) is smaller than other three TCMs, resulting in less damage. Moreover, with the increase of WLN (WLN > 3), the proportion of inner-cell and transition-cell become larger, and the stress in these two sub-cells will be transferred to the surface-cell, resulting in more serious damage state to the surface-cell.
Furthermore, by analyzing the initial damage of the UCM, it is obvious that it cannot represent the true initial damage state of 2.5DWC, and the reason is similar to that under the warp-loading. However, we can determine the possible initial damage position of inner-cell in the TCM based on the initial damage of the UCM.
Damage propagation of yarn
As showed in Figure 17(2), the weft longitudinal damage in all TCMs has spread to the entire surface of the weft yarn at this stage, meaning that the material begins to fail. By comparing the damage conditions with different WLNs, it is still found that the damage is more serious with the increase of WLN, which is mainly reflected by the warp transversal damage. The reason is similar to the initial damage.
Then, by analyzing the damage condition of the UCM, it is found that the damage condition at this point is similar to that of the TCM. Compared with its initial damage, the weft longitudinal damage spreads more seriously, but the warp transversal damage hardly expands.
Ultimate damage of yarn
As showed in Figure 17(3), in general, the degree of damage with different WLNs still obeys the above rules. Compared with the previous stage, the weft longitudinal damage in each TCM has almost no propagation since all the weft yarns broke. However, the warp transverse damage shows a little expansion, because the external work at this stage can only be released by the transversely load-bearing of the warp yarn after all weft yarns broke.
In addition, analyzing the UCM at this stage, the damage status is still similar to that in the TCM. Therefore, considering the calculation cost and analysis accuracy, the UCM can be used to analyze the damage propagation of the yarn of 2.5DWC under the weft-loading without paying attention to the initial damage.
Damage of resin-rich matrix
Figure 18 shows the damage propagation process of the resin-rich matrix under the weft-loading. As showed in Figure 18 (1), unlike the matrix damage of the warp-loading, which has little correlation with the surface, the matrix damage of the weft-loading starts at both the surface and the internal weakest part. Subsequently, the matrix damage expands simultaneously along the warp and weft directions until all local matrix damages penetrate each other, as showed in Figure 18(2) and (3).
By analyzing the matrix damage behavior of the TCM and UCM, it is found that matrix damage will run through the position between two rows of warp yarn. In the TCM, however, the matrix of the material surface will also form an O-shaped damage area, which cannot be obtained by analyzing UCM. In addition, there is no other difference in the matrix damage of the TCM with different WLNs, which means that the matrix damage on the material surface does not affect its interior. Therefore, the UCM can be used for the TCM (WLN > 3) auxiliary analysis for the internal matrix damage of 2.5DWC under the weft-loading. Note that WLN > 3 is sufficient here, because the inner-cell and transition-cell are very similar in geometry (see Figure 4), which results in the matrix damage of these two sub-cells under the weft-loading is also very similar.
Experimental fracture and its comparison with simulation results
Mechanism of experimental fracture
Figure 19 shows the experimental macro and micro fractures in different loading directions. As predicted by the above simulation, the fracture under the warp-loading is more complicated than that under the weft-loading. In addition, the cracking of the resin-rich matrix region occurs outside the fracture surface in the warp-loading specimen, but not occurs in the weft-loading specimen. There are two reasons for this phenomenon. (1) It is caused by small defects in the warp-loading specimen. (2) The complexity in warp-loading process makes the damage propagation very sensitive to some small defects, especially the squeezing damage between different components.

Then, by comparing the macro fracture of these two loading directions, it is found that the weft-loading fracture is more flat than the warp-loading fracture, which is also a manifestation of the complexity in warp-loading process and the singleness in weft-loading process.
Comparison of experimental fracture and simulation morphology
Warp-loading
Generally speaking, these two kinds of model are both similar to the experimental fractures as a whole, but there are still three differences after careful analysis.
First, by analyzing the surface warp yarn in the experimental fracture, it is found that there are not only fractures but also a lot of transverse cracking at the turning point, which cannot be simulated by the UCM. However, by observing the final damage of the TCM (WLN = 6) in Figure 15(d3), it is obvious that the final damage state of the surface warp is in good agreement with the experimental fracture.
Second, the experimental fracture of the internal warp yarn shows that a large amount of longitudinal fracture and a little of transversal crack appears at the curved-straight junctions. As showed in Figure 15(e3), the final longitudinal damage of the UCM is also at the curved-straight junctions, but there are a lot of transversal damage around it, which is not consistent with the experimental result. However, by observing the final damage of internal warp yarn of the TCM (WLN = 6) in Figure 15(d3), it is found that there is almost no transversal damage around the longitudinal damage, which shows a good agreement with the experiment fracture.
Third, by analyzing the test fracture of the weft yarn, it is found that the edge of the weft yarn is cut off between the two rows of warp yarn in addition to the weft transversal cracking. Then, by analyzing the simulation results of the TCM and UCM, it is found that both models can well simulate the weft transversal damage, but the weft longitudinal damage simulated by different models is different. The weft longitudinal damage in the TCM existed only at the edge of the weft yarn, while that in the UCM almost penetrated the entire weft yarn. Obviously, simulation morphology of the TCM are more consistent with the experimental fracture than the UCM.
Therefore, combining the above three points, it can be determined that the proposed TCM is more accurate and effective than the UCM in the simulation of warp-loading damage behaviors.
Weft-loading
In general, the final damage mode of the TCM is very close to the experimental fracture whether it is surface or internal yarn. Therefore, the TCM can effectively simulate the weft-loading process. However, the above analysis shows that the simulation results of internal yarn in the UCM are very similar to that in the TCM (WLN > 3). In other words, in addition to the SEE, the final damage mode of the UCM can also effectively reflect the interior of the actual fracture.
Conclusions
In this paper, we analyze the microstructure of 2.5DWC carefully, and divided it into surface part, sub-surface part, and internal part based on its geometric characteristic. Then, according to these three parts, the corresponding sub-cells, i.e. the surface-cell, transitional-cell, and inner-cell, are established. By combining these sub-cells, TCMs with different WLNs can be achieved. Through the TCM system, the variation of mechanical property and damage behavior of 2.5DWC with different WLNs are analyzed comparatively. Some key conclusions are as following: From the perspective of prediction accuracy, the TCM is better than the UCM; while from the perspective of modeling complexity and calculation cost, the TCM is simpler than the FCM. Therefore, the proposed TCM system avoids the shortcomings of the two typical RVC models and is more suitable for the mechanical performance prediction and damage behavior characterization of 2.5DWC. In addition, the TCM system has the applicability with any WLN, especially for 2.5DWC with medium thickness where both the UCM and FCM are not applicable. With the increase of WLN, the modulus and strength of 2.5DWC in both the warp and weft directions show an increasing trend, and tend to the corresponding fixed values, which are lower than the predicted values of the UCM. However, the variation amplitude of the mechanical property in warp direction is larger than that in weft direction. Under the warp-loading, when the WLN is low, 2.5DWC exhibits the phenomenon of premature failure, and this phenomenon gradually disappears with the increase of WLN. However, there is no phenomenon of premature failure under the weft-loading. The damage mode under the warp-loading is more complicated than that under the weft-loading. However, with the increase of WLN, the damage degree under the warp-loading shows a decreasing tendency, while that under the weft-loading shows an increasing tendency. In view of the fact that the SEE has a great influence on the yarn damage behavior, the UCM is not applicable, and the TCM or FCM can only be used, especially under the warp-loading. However, the SEE is almost independent of the resin-rich matrix damage behavior, so when using the TCM or FCM to analyze the matrix damage behavior, the UCM can accurately characterize the internal matrix damage of these two models.
Footnotes
Declaration of conflicting interests
The author(s) declared no potential conflicts of interest with respect to the research, authorship, and/or publication of this article.
Funding
The author(s) disclosed receipt of the following financial support for the research, authorship, and/or publication of this article: This work has been supported by National Science and Technology Major Project (2017-IV-0007-0044).