
Abstract
The ability of biodegradable materials to be miniaturized and degrade at specific rates when subjected to certain bacterium types and/or a given range of temperatures has led to a newly emerging technology: organic transient bioelectronics. In this work, the electrical characteristics of new natural composite materials are presented. Four types of natural lignocellulosic fibers were used with polypropylene: black pepper, sumac, pomegranate, and lemon. The composites were prepared as flat smooth sheets with thicknesses ∼1 mm. The dielectric constant and the ac conductivity of the prepared samples were determined for the frequency range of 1 KHz to 4 MH. All measurements were performed at room temperature and humidity utilizing parallel plate capacitor technique associated with high precision Hioki IM3536 LCR meter. The frequency response of the composites under study shows similar behavior to that of the pure sample but with various percentage increments. The dielectric constant shows that the consistent dispersion was highly affected by filler content specially at the low frequency side of the spectrum. The maximum recorded increment was around 55% for 30wt.% sumac samples at 1 KHz. The effect of larger filler loading concentration on the incremental change of the ac conductivity was more obvious at higher frequencies.
Keywords
Introduction
As green technology and clean energy are becoming fundamental strategies in modern technology, many polymers and their biodegradable composites have been extensively considered and used in the fabrication and enhancing the properties of many electronic systems. The huge abundance of such polymers as well as the several merits they possess opened the door for researchers and manufacturers to exploit the possibilities of using them in new inventions and applications.1–4 One of the main attractive features of biodegradable composites is the possibility to alter their properties based upon on the filler reinforcement being used to fulfill certain design requirements.5–8 For example, adding conductive particles to the polymer will result in conductive composite that are widely used in developing wearable electronic devices that need to satisfy certain flexibility requirements. Such devices found many applications in the field of robotics, biomedical, and smart clothes.9–13
Biodegradable composite materials are aimed to be utilized in various industrial applications where mechanical, physical as well as electrical characteristics are vital in achieving sustainable and successful functional green products. Such integrated features of the materials are responsible for composite behavior regarding deformations, geometrical stability and electrical features for more reliable energy storage materials and they are very important to be investigated for the biodegradable materials before implemented in various products as they will determine the functional requirements for a certain application.14–20 Natural fibers possess in fact, great potential as reinforcement for different polymers to produce lignocellulosic-polymer composites with superior properties. The natural fibers, on the other hand, are mainly constituted of cellulose, hemicellulose, and lignin. Such constituents highly influence the fibers’ properties.21–24 Non-structural constituents are also existed such as pectin, wax, and inorganic salts. However, existing of wax and pectin inclusions together with the hydroxyl groups in the natural fibers would weaken their bonding and wetting with the polymer matrices, leading to reduce their compatibility and limiting their use for reinforcement purposes.21,25–30 Thus, several efforts have been focused on removing the wax and lignin from the fibers’ surfaces utilizing several chemical treatments to facilitate the bonding mission of the hydroxyl groups, or to introduce new coupling agents, and to stop the water absorption capability.
One of the very attractive features of biodegradable composite materials is their ability to degrade at specific controlled rates when subjected to appropriate conditions. This includes certain bacteria types, proper temperature degrees and suitable miniaturization. This feature leads to the newly emerging technology; organic transient bioelectronics.1,31 The term transient reflects the need of such electronic devices to be built out of specially engineered materials that are programmed to decay within precise period when put to function. Whereas the term bioelectronics refers to that unlike the traditional solid-state silicon-based electronics, the semiconducting materials used are fabricated out of organic materials of living origin. The main expected advantages of bioelectronics systems are to be nontoxic, biocompatible, and biodegradable.3,32,33 These added values make this new type of electronic systems found very important biomedical applications. Flexibility of the electronic devices in this case is of crucial importance to ensure matching with the structure of the subjected organ. Other fields of interest of transient electronics include, but not limited to, field effect transistors, bio-sensing and actuating, robotics, energy harvesting, and manufacturing of super capacitors.34,35
Electrical property behavior of selected natural fiber reinforced composites under fiber loading and frequency variations.

Therefore, for better predictions and improvements of the electrical behaviors and the characteristics of the biodegradable composites for reliable and sustainable applications, the polymer-filler synergy should properly be evaluated and examined.
Consequently, this work aims to fabricate new biodegradable materials, which have never been considered in the literature like sumac and black pepper/PP composites, in addition to others like lemon powder and pomegranate powder/PP composites that have never been considered regarding their electrical characteristics. In addition, the work examines various reinforcement conditions on the electrical characteristics of the composites to enhance developing better understanding of their interactions as well as determining the influential parameters on their final electrical behavior trends under various frequency ranges. The work also aims to examine and compare the dielectric constant and the conductivity properties of the bio-based materials with various natural fiber types and fiber loadings to demonstrate their potential for various electronic applications.
The following section, materials and methods, discusses the electric properties under consideration and the measurement technique being used. The physical properties and the manufacturing process of the proposed composites are also discussed in this section. The main results and discussion are presented in Results and Discussion. Conclusions presents the main findings and conclusions of the work.
Materials and Methods
Electric properties
Materials are described to be conductors, semiconductors, or insulators (dielectrics) depending on the concentration of free charge carriers within. Conductors are materials with very high concentrations of free charge carriers, whereas dielectrics are characterized by having relatively low concentration of free charge carriers dominated by bounded charges. When applying an electric field to a dielectric material, electric dipoles are formed because of orientational polarization. 50 This polarization process provides dielectrics with the ability to store energy. The most important parameters that are best describing how a dielectric material interacts with the applied electric field and thus characterizes its electric properties are; the dielectric constant (ε), also called permittivity, and the conductivity (σ) and its reciprocal resistivity (ρ).50,51 The relative dielectric constant (εr) describes the dielectric material ability to store energy. Dielectric materials with higher relative dielectric constant can store more energy. The conductivity, on the other hand, represents the ability of the material to permit charge carriers to move freely. Increased conductivity of dielectric materials results in higher power losses in the form of heating. As these parameters are highly affected by the frequency of the applied electric field, their values are best presented in graph forms as function of frequency.
Many possible techniques are used to measure the electric properties of dielectric materials. These techniques include using transmission lines, cavity resonators, coaxial cables, and parallel plate capacitors associated with the proper measuring devices.52,53 Choosing the best measuring technique depends on many factors including the nature of the samples under test and the way it is prepared, whether it is solid, liquid, or powder. Also, it depends on the homogeneity, the linearity, and the dispersive properties of the material. The frequency range within which the study is conducted is another very important factor in determining the suitable measuring technique.
In this research, the parallel-plate capacitor measuring method is used. This method is very useful for measuring the electrical properties for frequencies below 1 GHz range when the samples under test are prepared in the shape of flat sheets with thickness in the range of millimeters. This measuring technique depends on sinusoidal steady state analysis in which the dielectric material under test is surrounded by the parallel plate capacitor. The capacitor is subjected to sinusoidal electric potential with adjustable frequency, resulting in electric current flowing across it. The amplitude and phase of the electric current is then precisely measured. The equivalent admittance (Y) is calculated as the ratio of the measured current to the applied voltage. The admittance is a complex quantity with a real part representing the equivalent conductance (G) and imaginary part representing the equivalent susceptance (B)
The relative dielectric constant and the conductivity are related to the admittance of the dielectric material according to equations (2) and (3), respectively.

Figure 1 shows a simplified schematic of the experimental setup used in performing the dielectric measurements of the samples under test. This setup consists of a parallel silver-plate capacitor, a high precision LCR meter, and a personal computer. The LCR meter used in this setup is the Hioki IM 3536. The LCR meter is connected to the parallel plate capacitor via a special type four-terminal probe (L2000 four-terminal probe) with measurable range from DC to 8 MHz. The measurement results are stored in the form of excel files on a PC for further processing. Experimental setup, (a) Schematic diagram of the setup, (b) the devise and specimens.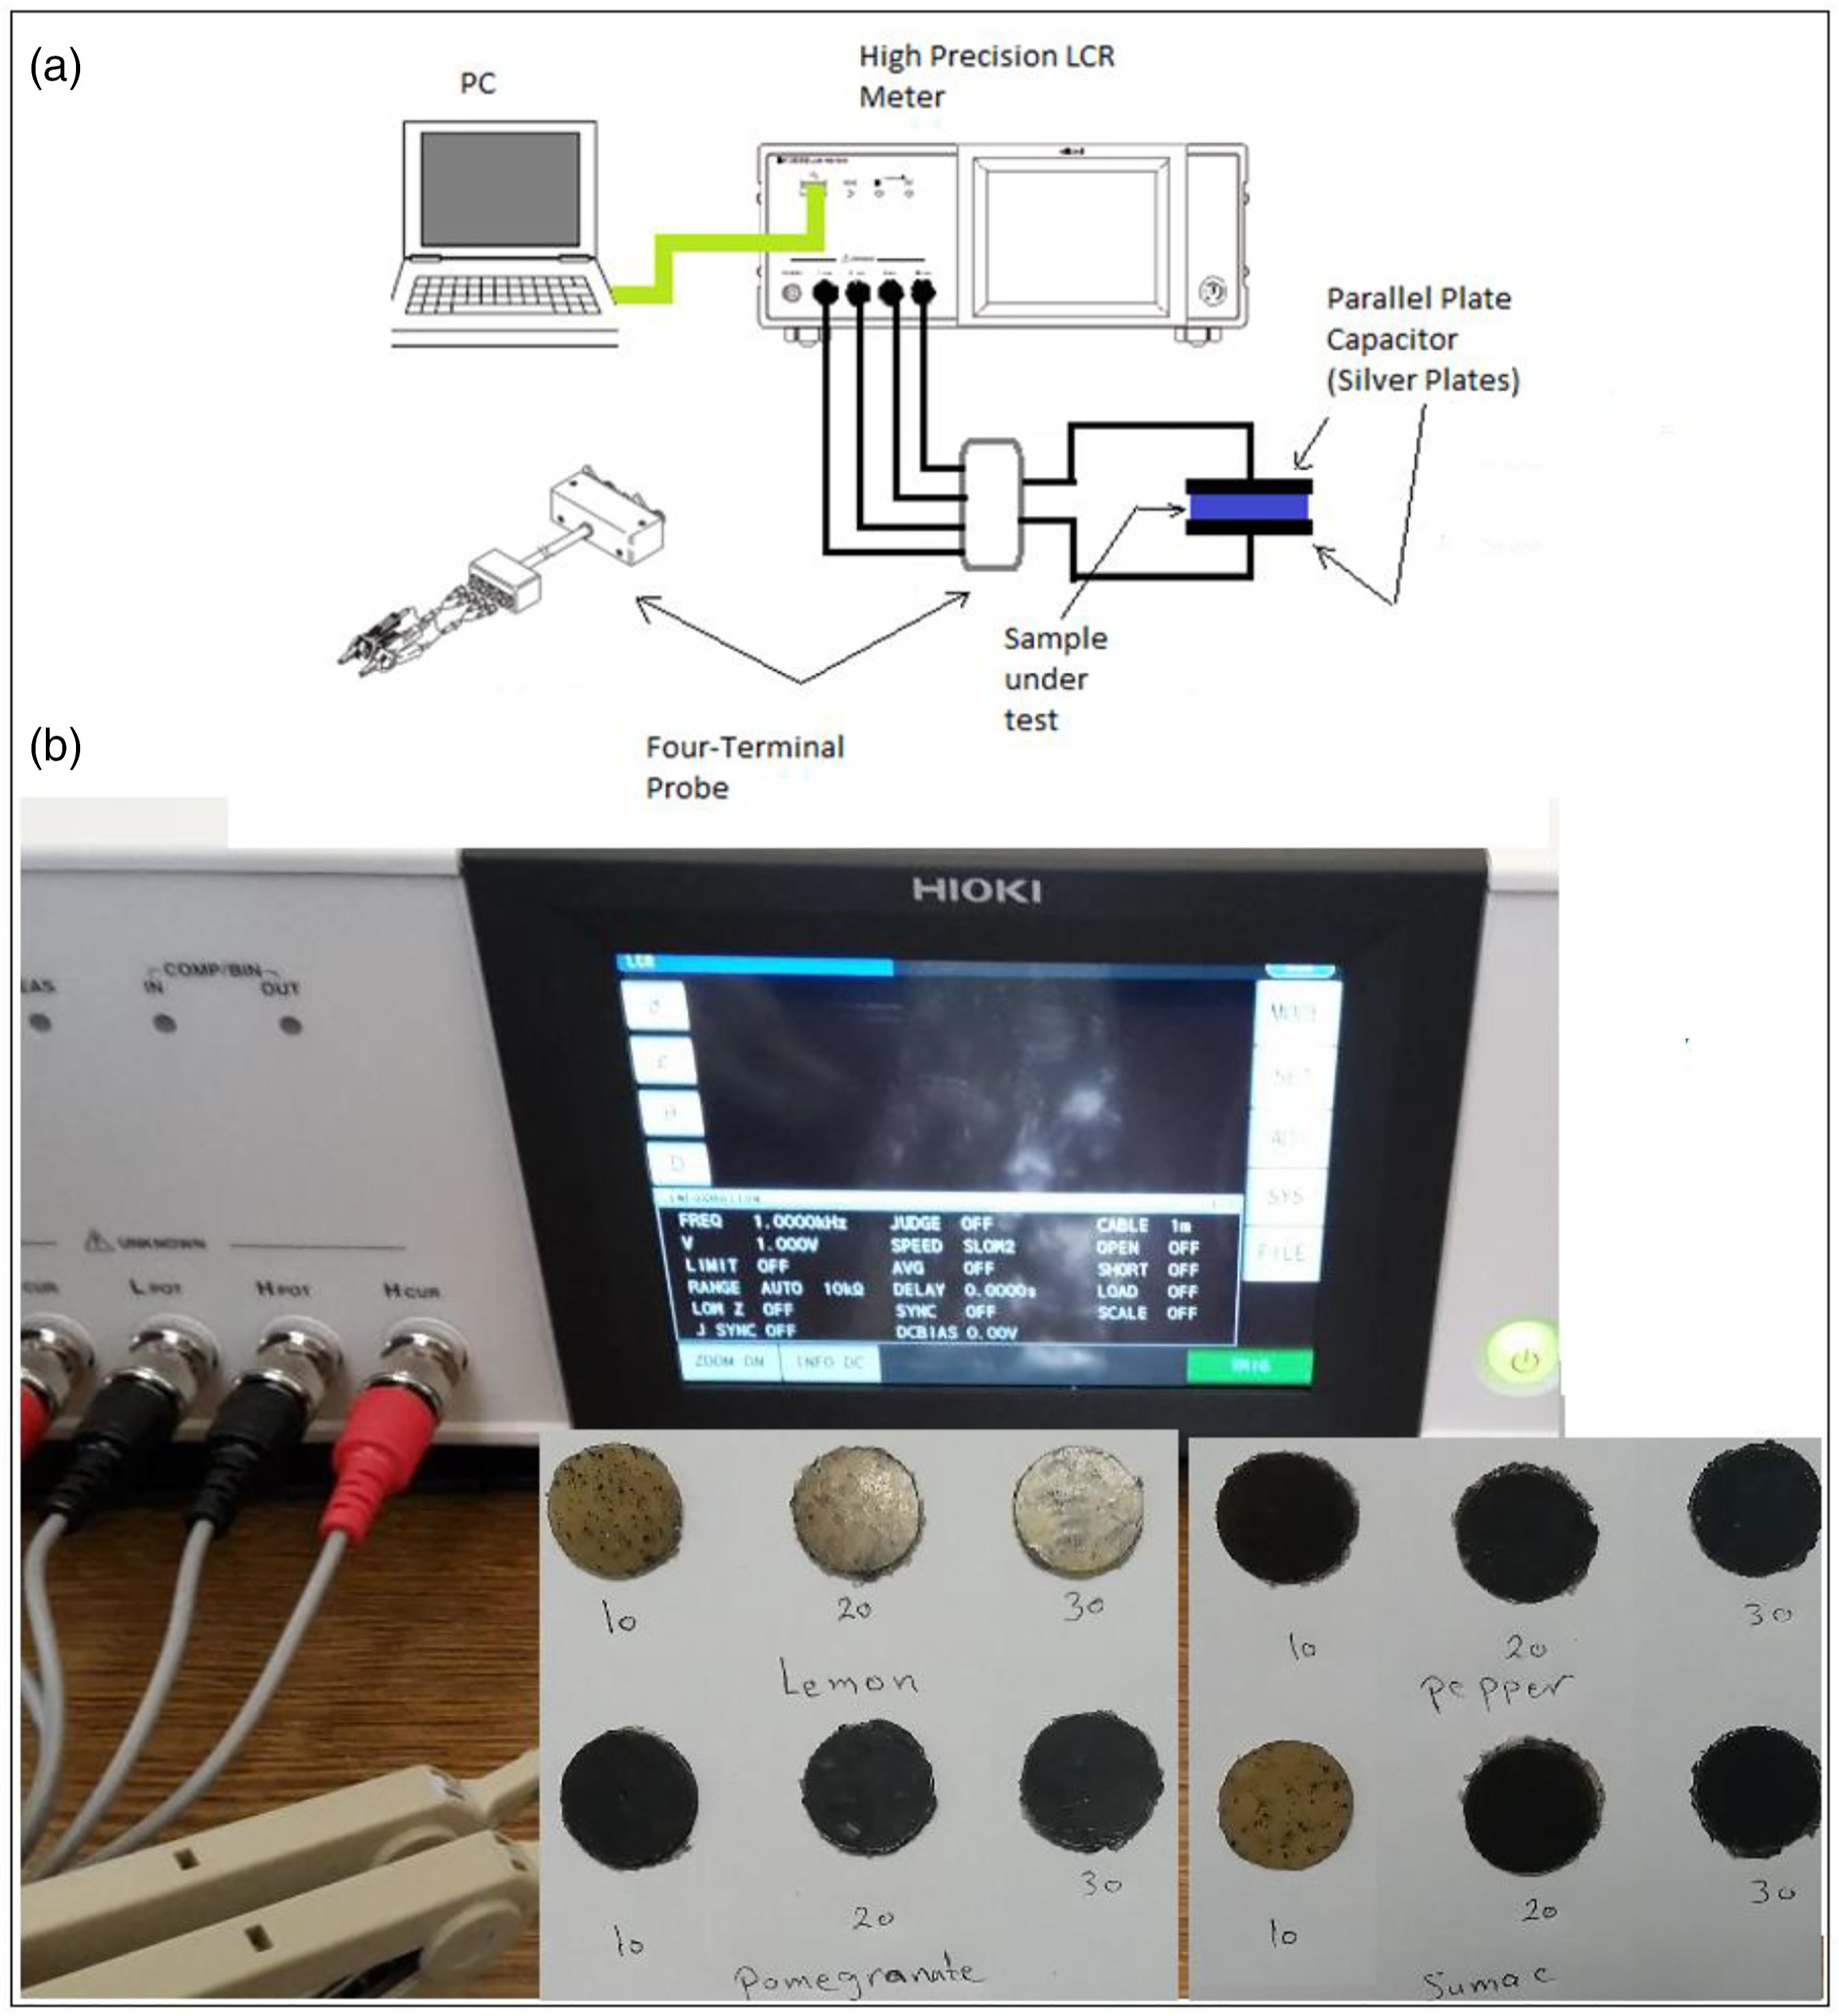
Samples under study
List of samples under test.


Composite preparations flowchart.

Scan electron microscope of the prepared samples demonstrating the filler size, (a) sumac, (b) pomegranate, (c) lemon, and (d) black pepper.
Results and discussion
In this section the measurements of the relative dielectric constant and the conductivity of the composite samples under study are represented. Figure 4 shows the behavior of the relative dielectric constant of the BP10, BP20, and BP30 samples in response to frequency variation. The frequency response of the relative dielectric constant of a pure sample is taken as a reference. The measured results show that the additive dopants did not affect the general behavior of the material characteristics. That is, it is almost following the same behavior of the pure sample. However, the dielectric constant shows relatively good increment with increased filler concentration especially at the low frequency side. At 1.0 KHz frequency, samples with 10% filler loading show an increment in the dielectric constant of about 8%. Increasing the filler to 30%, results in an increment in the dielectric constant about 42%. As the frequency was increased to 1.0 MHz, the percentage increment decreased to around 2% for BP10 and 24% for BP30. Table 3 shows a summary of the percentage increment in the value of the relative dielectric constant of the samples under study at selected frequencies. Relative dielectric constant of samples BP10, BP20, and PB30 in comparison with pure sample with respect to frequency variations. Summary of the percentage increment in the value of the relative dielectric constant at selected frequencies.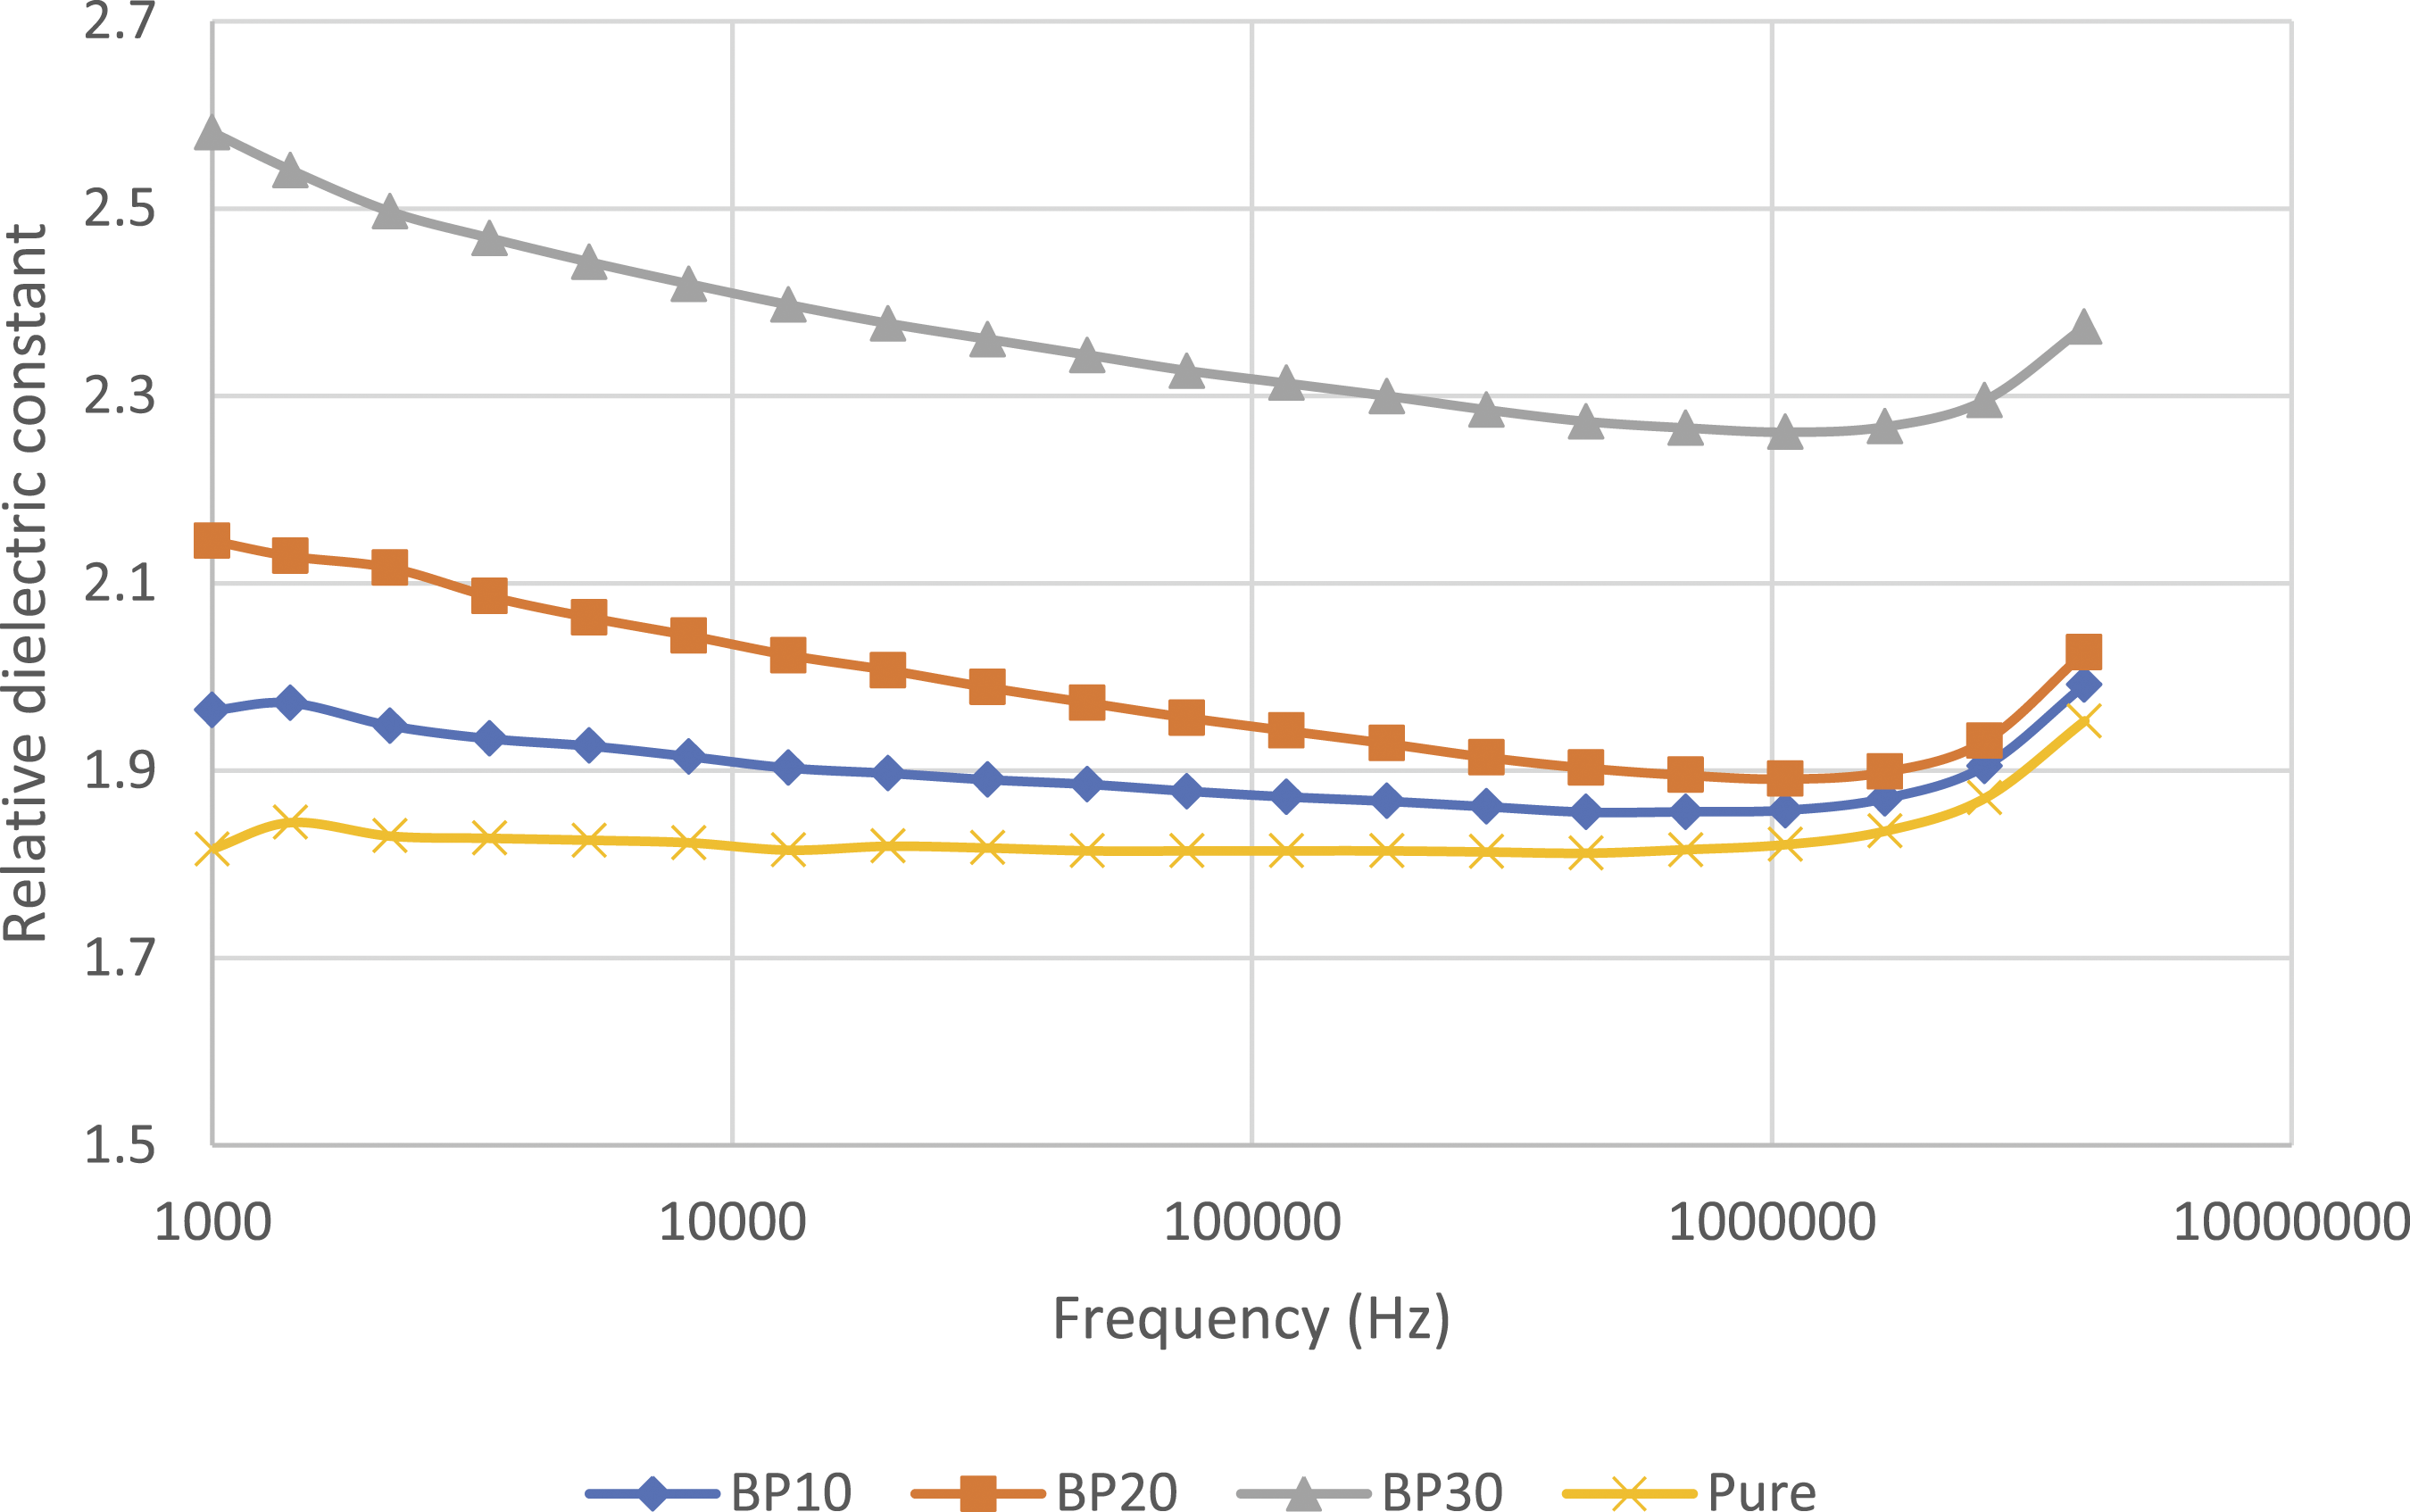

Similar behavior was noticed for samples doped with sumac powder (So10, So20, and So30) as shown in Figure 5. Sumac composites with low filler concentration, So10, have almost no effect on the dielectric constant of the pure polymer. When increased to 30% filler loading, sumac composite shows percentage increment in the relative dielectric constant of around 55% at 1.0 KHz and 31% at 1.0 MHz. Relative dielectric constant of samples So10, So20, and So30 in comparison with pure sample with respect to frequency variations.
Measured results of the material when doped with pomegranate powder are presented in Figure 6. Unlike black pepper and sumac composites, pomegranate samples show higher increment in the dielectric constant at the high frequency side. When the frequency of the applied electric field is set to 1.0 MHz the percentage increment reaches 5% for Po10 and 31% for Po30. At 1.0 KHz, the percentage increment is 1% for Po10 and 22% for Po30. Relative dielectric constant of samples Po10, Po20, and Po30 in comparison with pure sample with respect to frequency variations.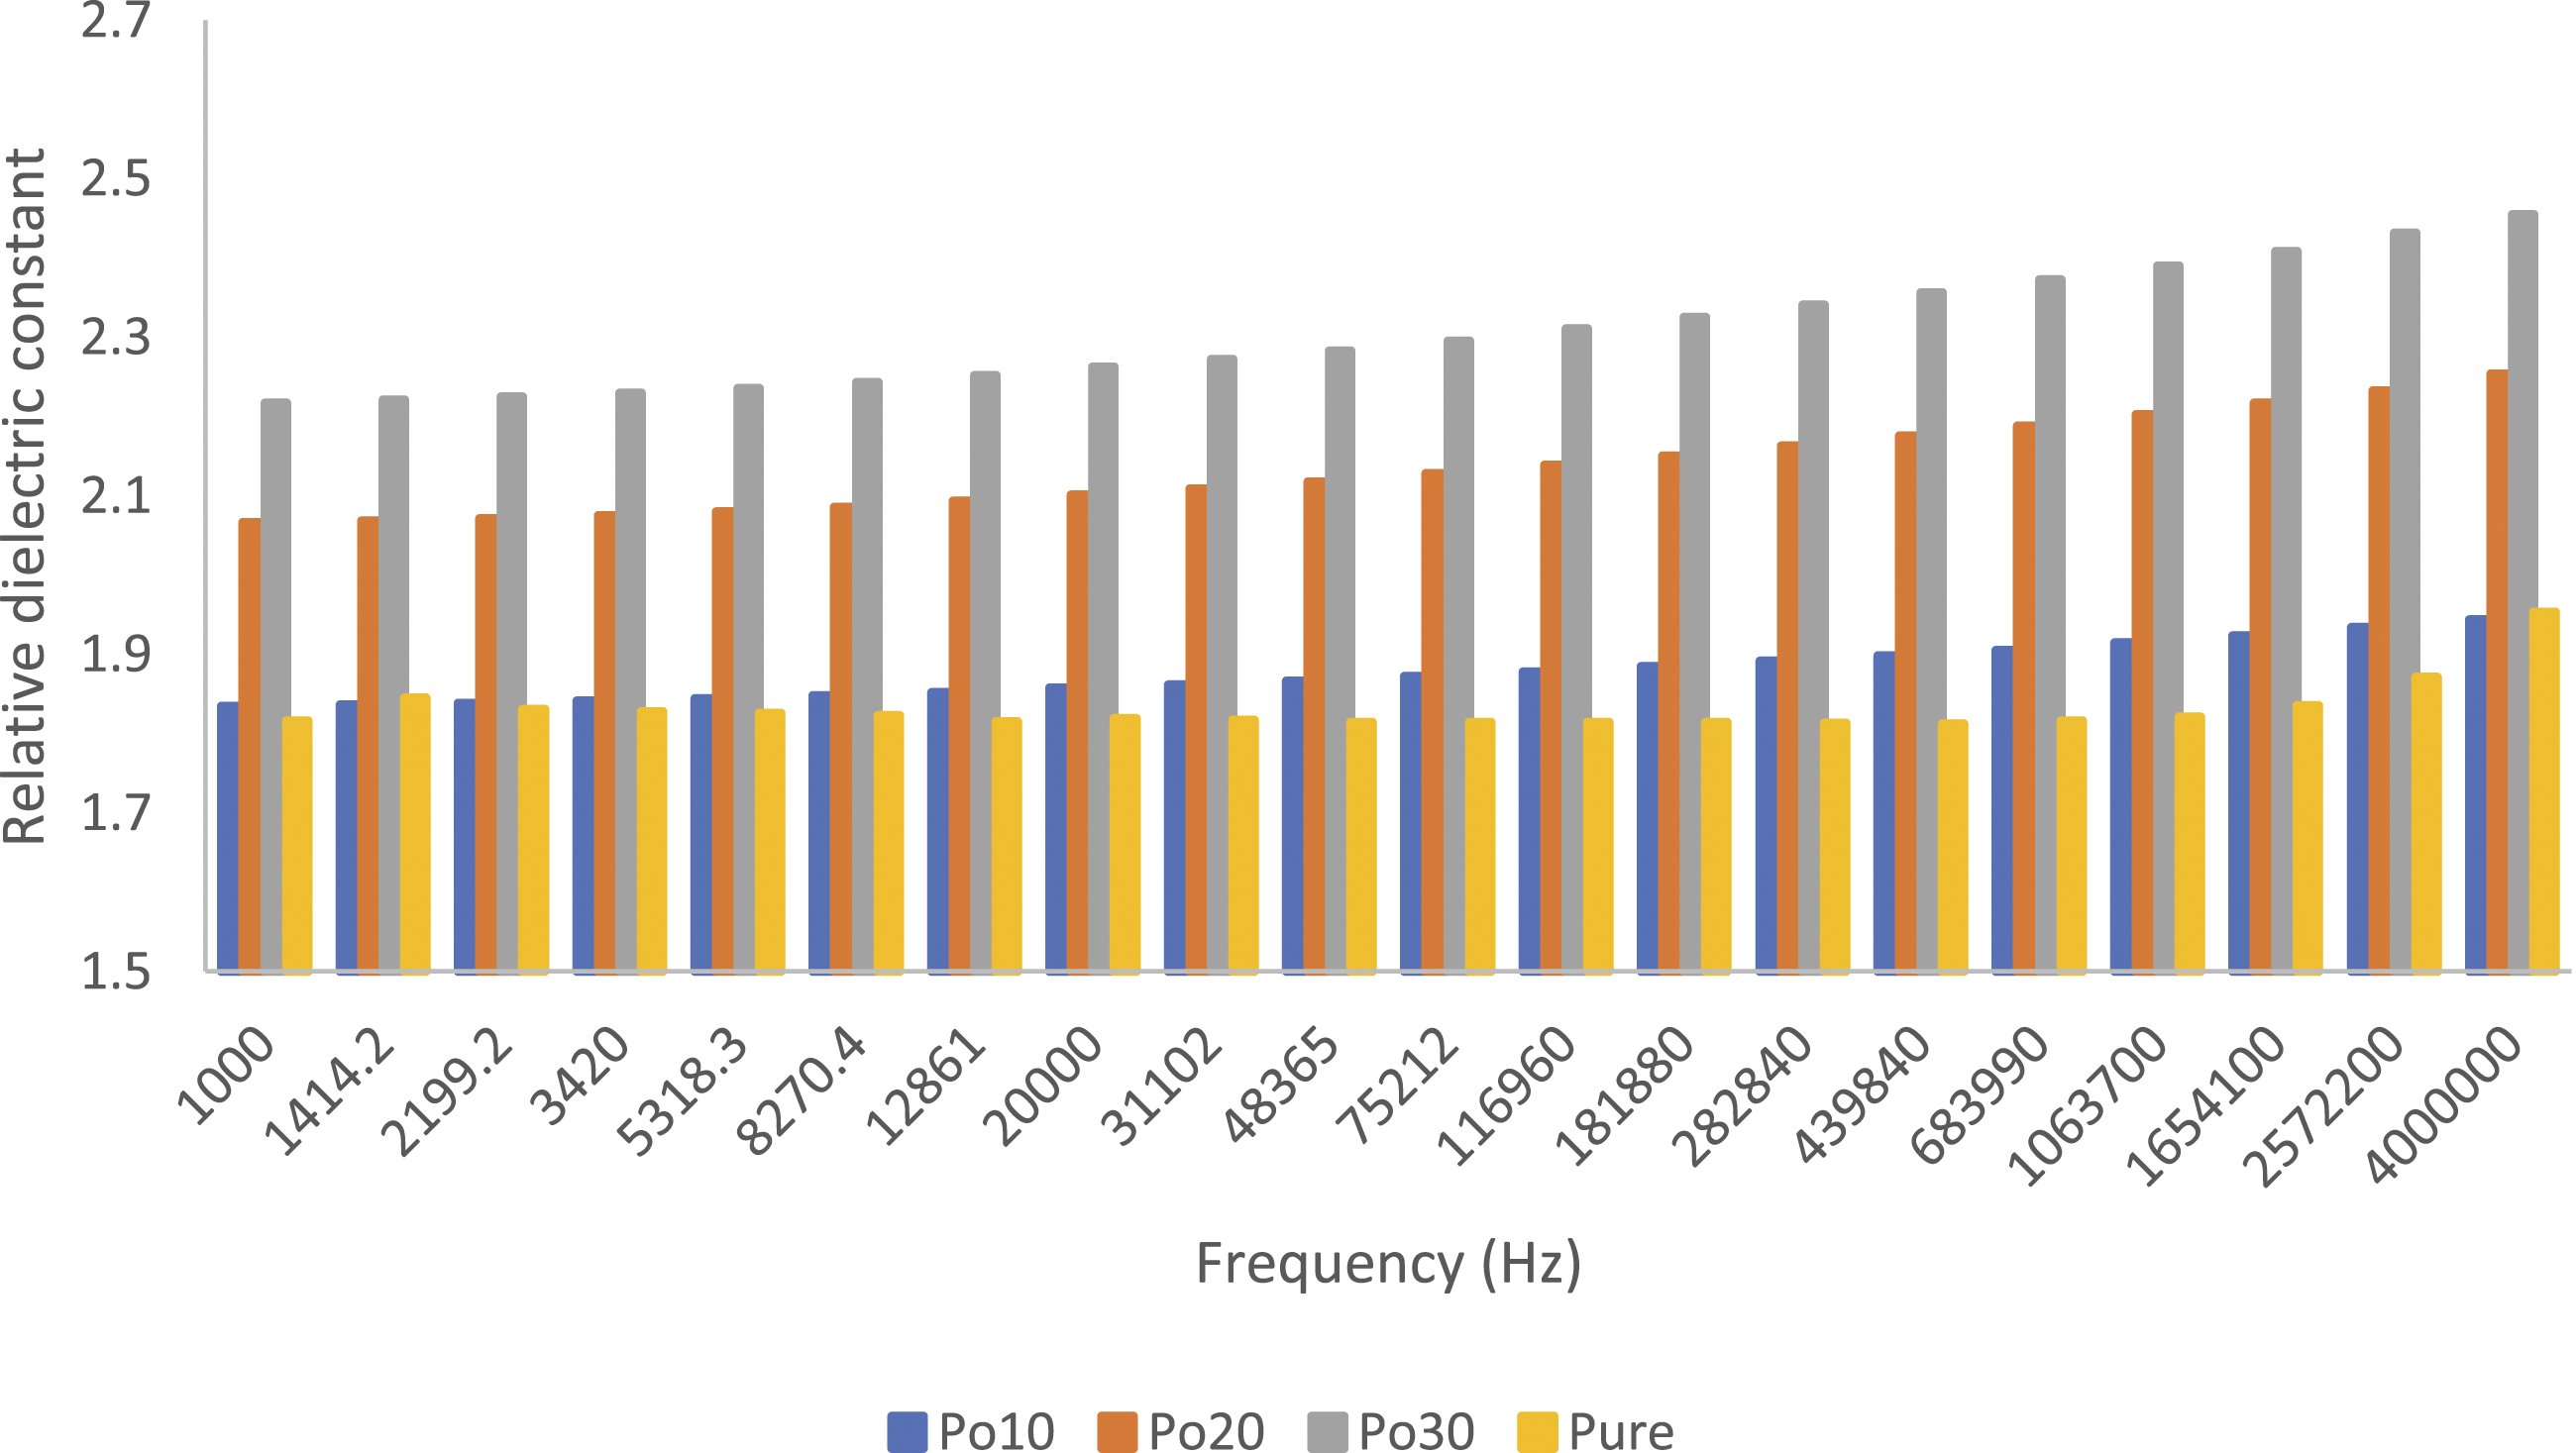
Composites with lemon powder show behavior like that of pomegranate powder composites, as presented in Figure 7. The percentage increment in the value of the dielectric constant was found to increase as the frequency increases. At low filler loading of 10% the relative dielectric constant of lemon reinforced composite was lower than that of the pure sample. As filler loading increased, the dielectric constant increased showing a percentage increment of around 13% at 1.0 KHz and 20% at 1.0 MHz for Le30 samples. Relative dielectric constant of samples Le10, Le20, and Le30 in comparison with pure sample with respect to frequency variations.
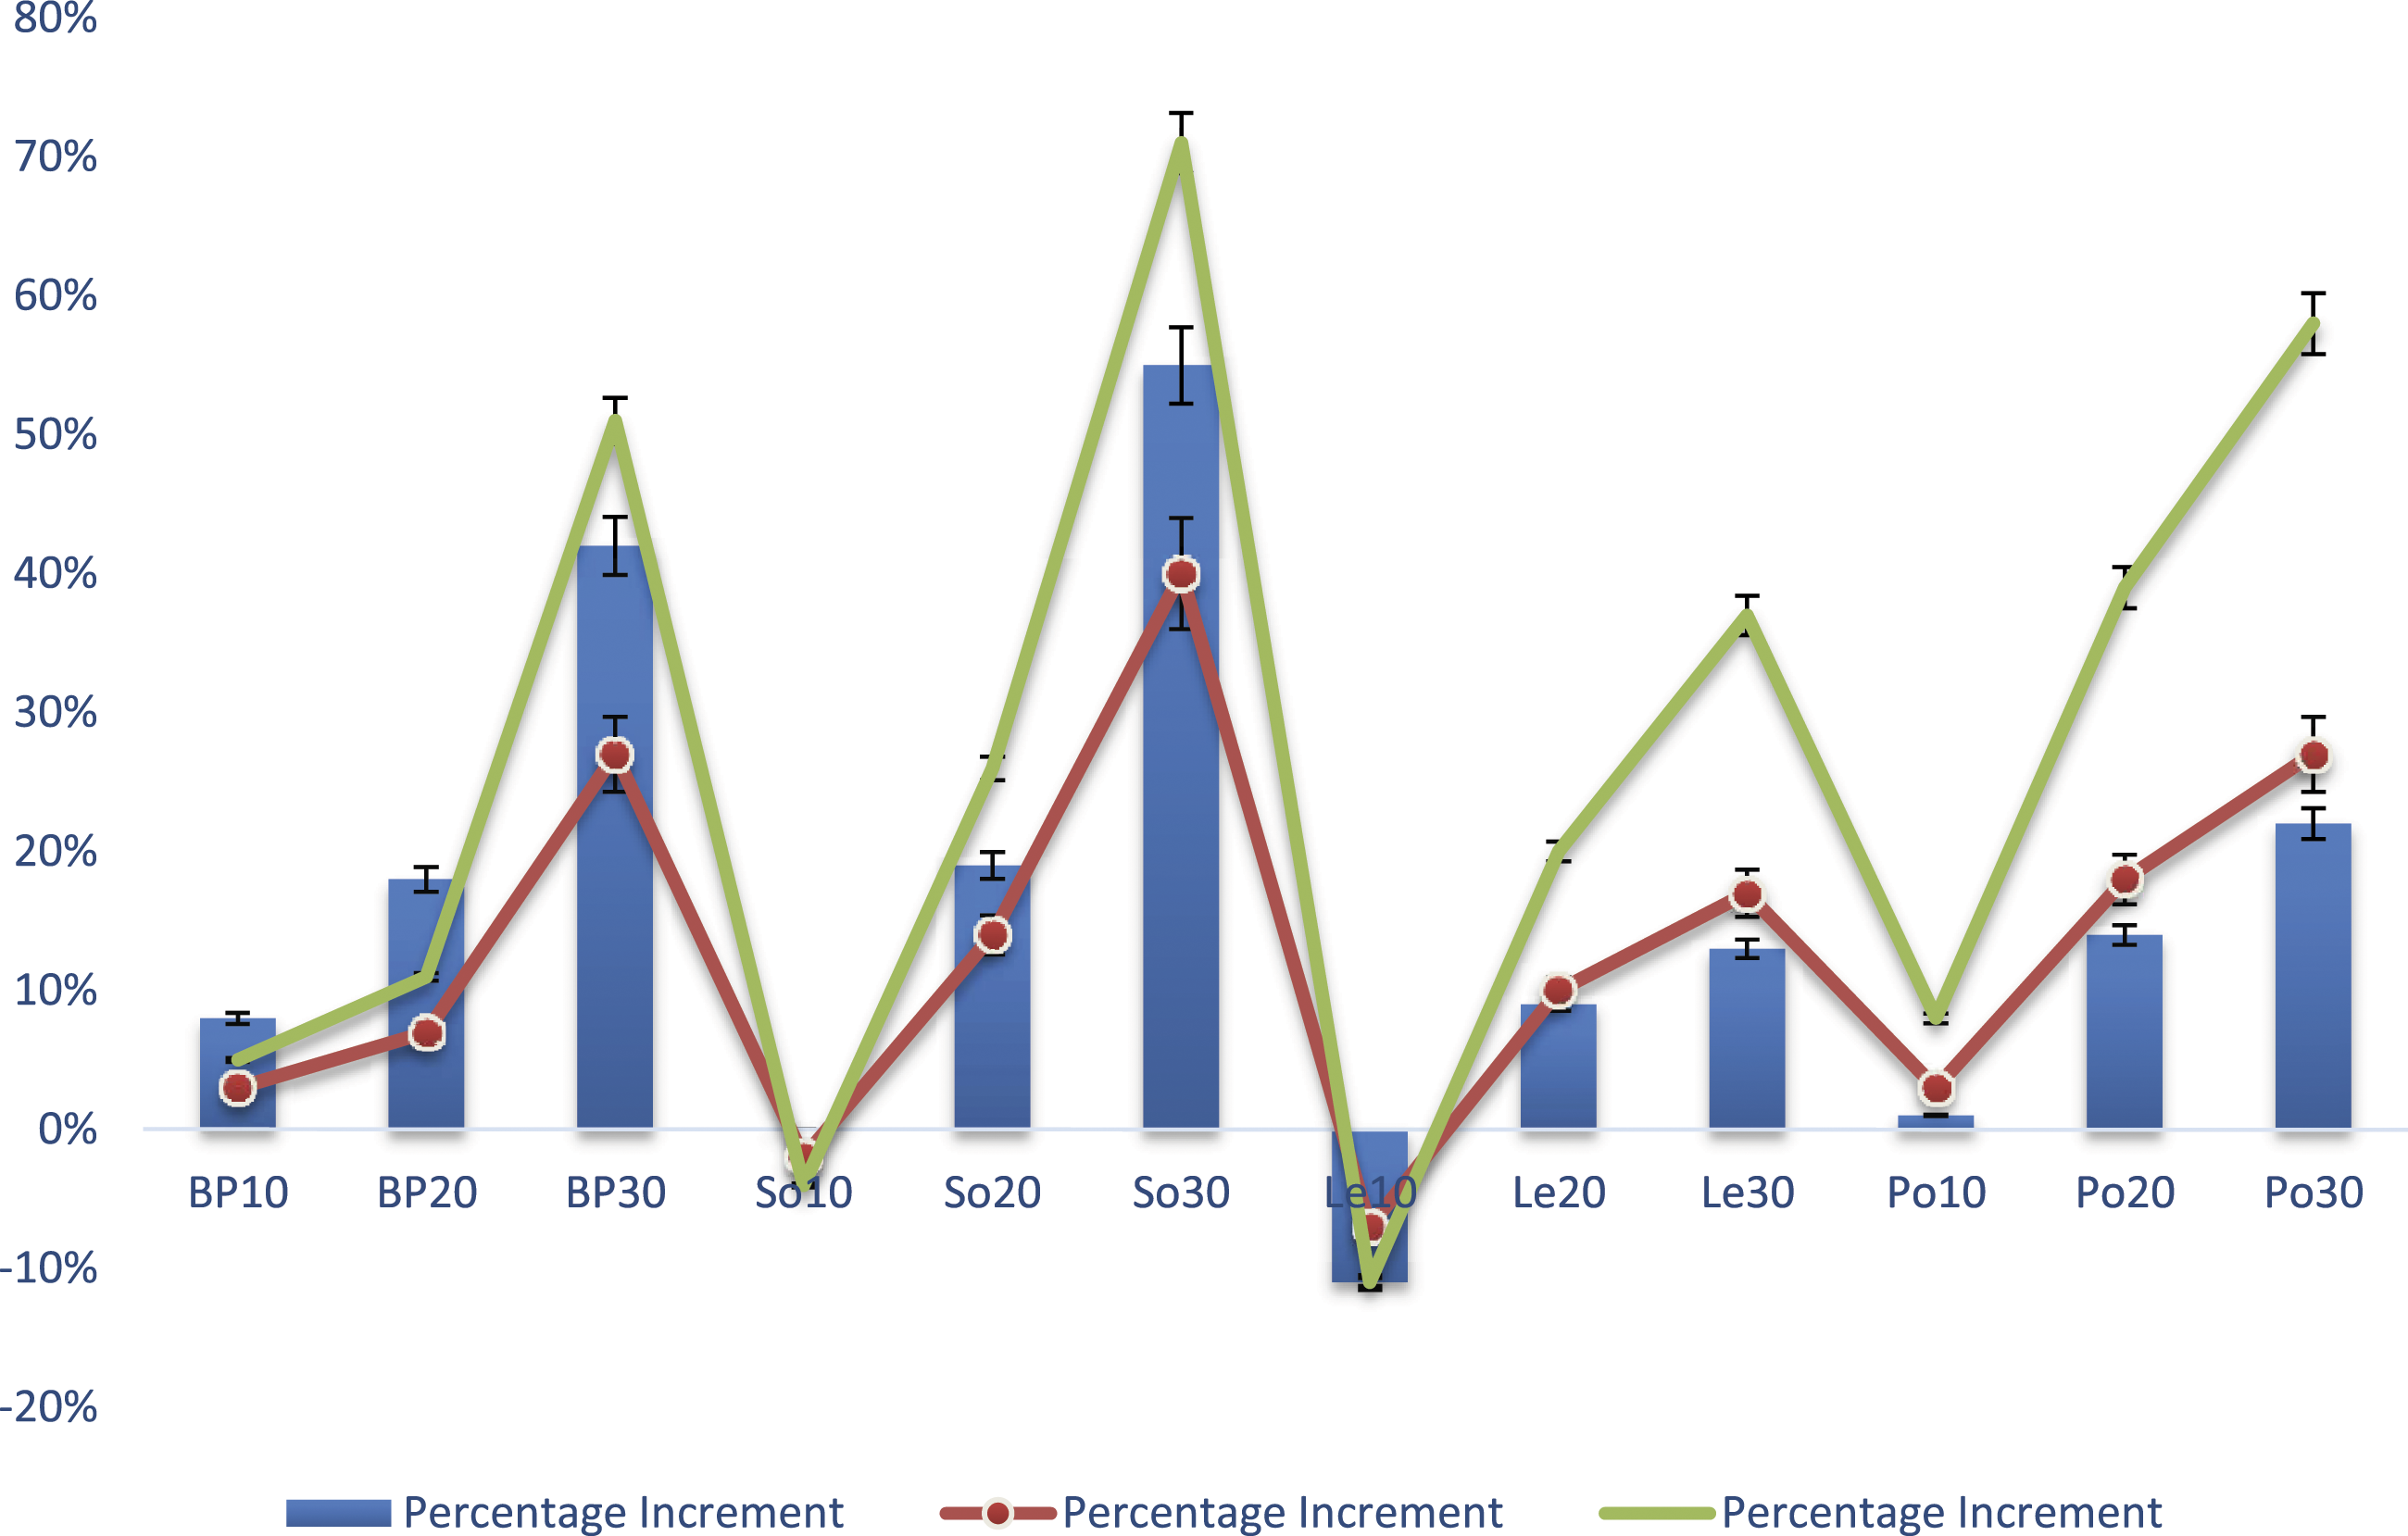
Figure 8 shows a direct comparison of the relative dielectric constant of the different composites with 30% doping referenced to the pure material. Doping with 30wt. % sumac powder resulted in the maximum increment in the relative dielectric constant while lemon powder resulted in the minimum increment within the frequency range under consideration. Figure 9 represents a comparison among the percentage increments of the dielectric constant of all composites at 1.0 KHz, 100 KHz, and 1.0 MHz. Relative dielectric constant of samples with 30% doping in comparison with pure sample with respect to frequency variations. Comparison among the percentage increments of the dielectric constant of all composites at 1 KHz, 100 KHz, and 1.0 MHz.
The frequency dependence of the ac conductivity of the same samples of the material under study is investigated under the same previous conditions; frequency range of 1.0 KHz to 4.0 MHz at room temperature and humidity. The ac conductivity of all composites under test show very similar trend as of the pure polymer. At low frequencies the composites behave as good insulators exhibiting very low conductivity. As the frequency of the applied electric field increases, the conductivity increased. The effect of increased filler loading is more obvious at higher frequencies.
Moreover, the measured conductivity of black pepper composites is presented in Figure 10. The conductivity increases as the frequency of the applied electric field increases in a manner like that of the pure polymer. The conductivity of samples with filler loadings 10% and 20% show very small increment compared to the pure polymer. The effect of 30% filler loading is more obvious especially at high frequency side reaching a value of 0.53 mS/m at 4 MHz compared to 0.43 mS/m for pure polymer. Conductivity of samples BP10, BP20, and PB30 in comparison with pure sample with respect to frequency variations.
The conductivity of sumac powder composites was found following the same trend as of the pure polymer. The effect of different filler loadings in sumac powder composites over the measured conductivity is clearer than that of black pepper composites as seen in Figure 11. At 4.0 MHz, the measured conductivity of So30, So20, and So10 were around 0.59 mS/m, 0.52mS/m, and 0.46 mS/m, respectively. Conductivity of samples So10, So20, and So30 in comparison with pure sample with respect to frequency variations.
The results of the measured conductivity of pomegranate composites are presented in Figure 12. Like sumac composites, variation of pomegranate filler loading results in clear effect on the conductivity measured. At 4.0 MHz, the measured conductivity of Po30, Po20, and Po10 were around 0.55 mS/m, 0.50mS/m, and 0.43 mS/m, respectively. Conductivity of samples Po10, Po20, and Po30 in comparison with pure sample with respect to frequency variations.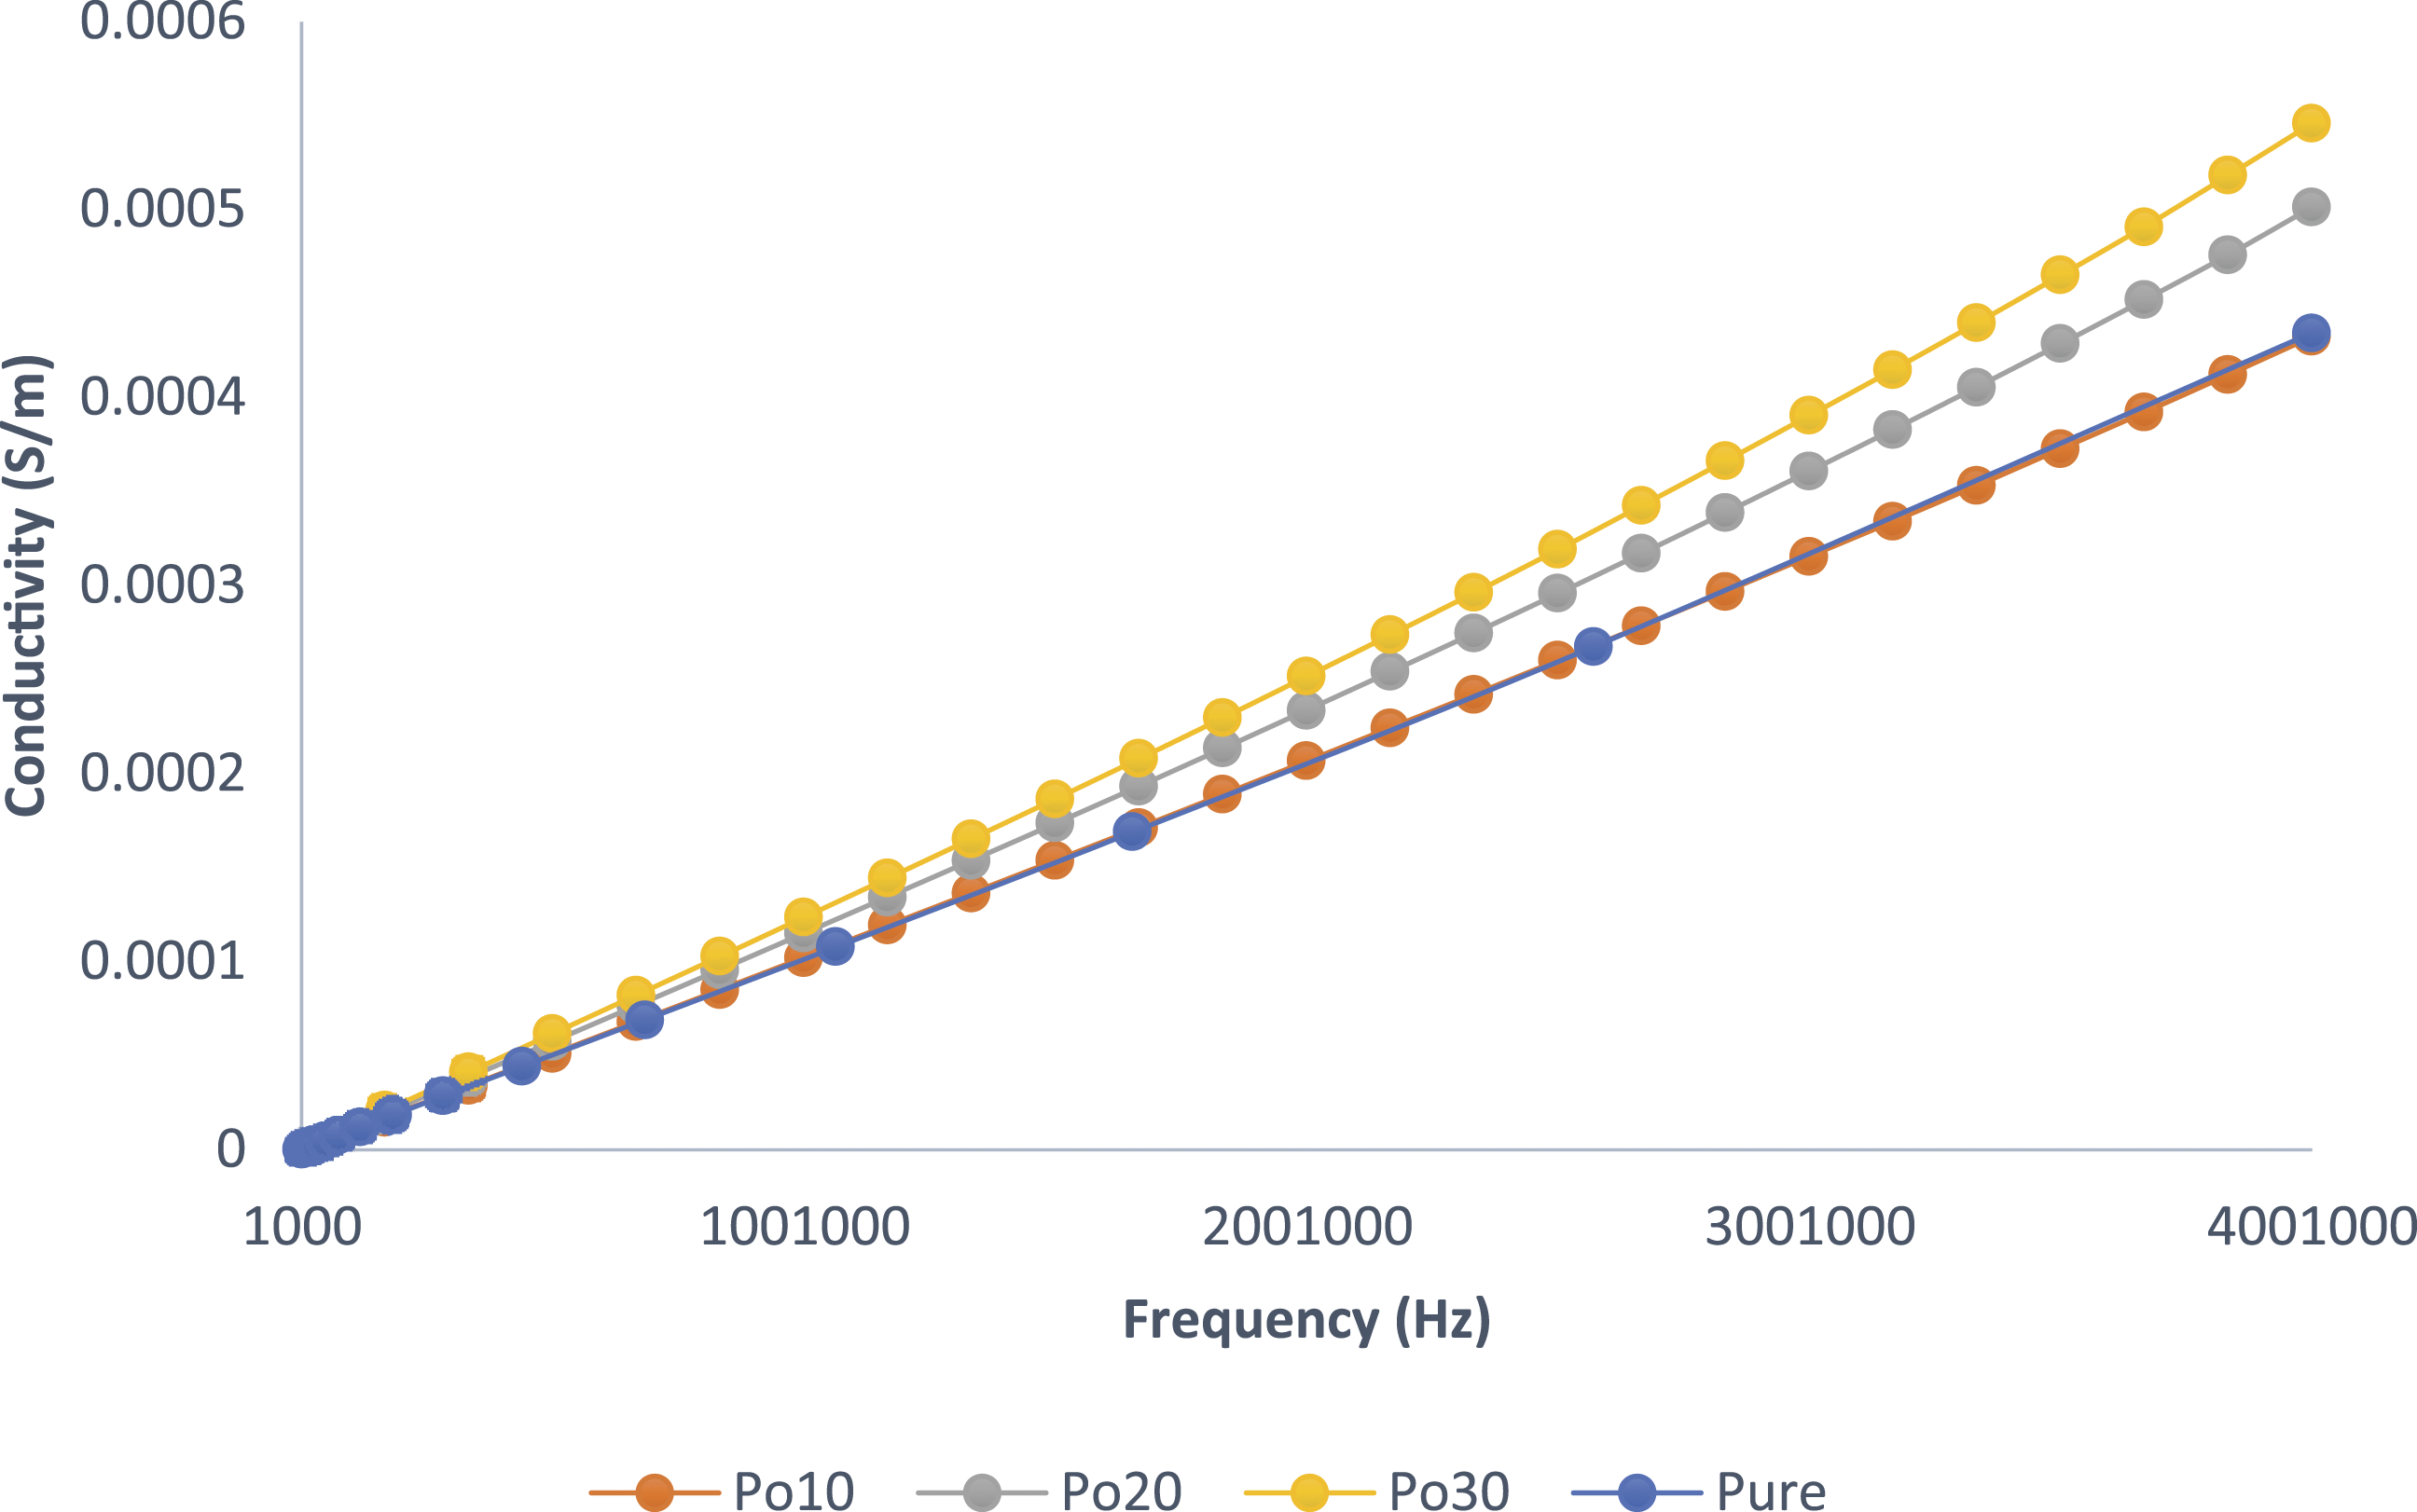
Measured conductivity of lemon powder composite is represented in Figure 13. For samples with 10% filler loading the measured conductivity was less than that of the pure polymer. However, as filler loading increased to 20% and 30% the conductivity became larger than that of the pure polymer. At 4.0 MHz, the measured conductivity of Le30, Le20, and Le10 were around 0.50 mS/m, 0.45mS/m, and 0.40 mS/m, respectively. Conductivity of samples Le10, Le20, and Le30 in comparison with pure sample with respect to frequency variations.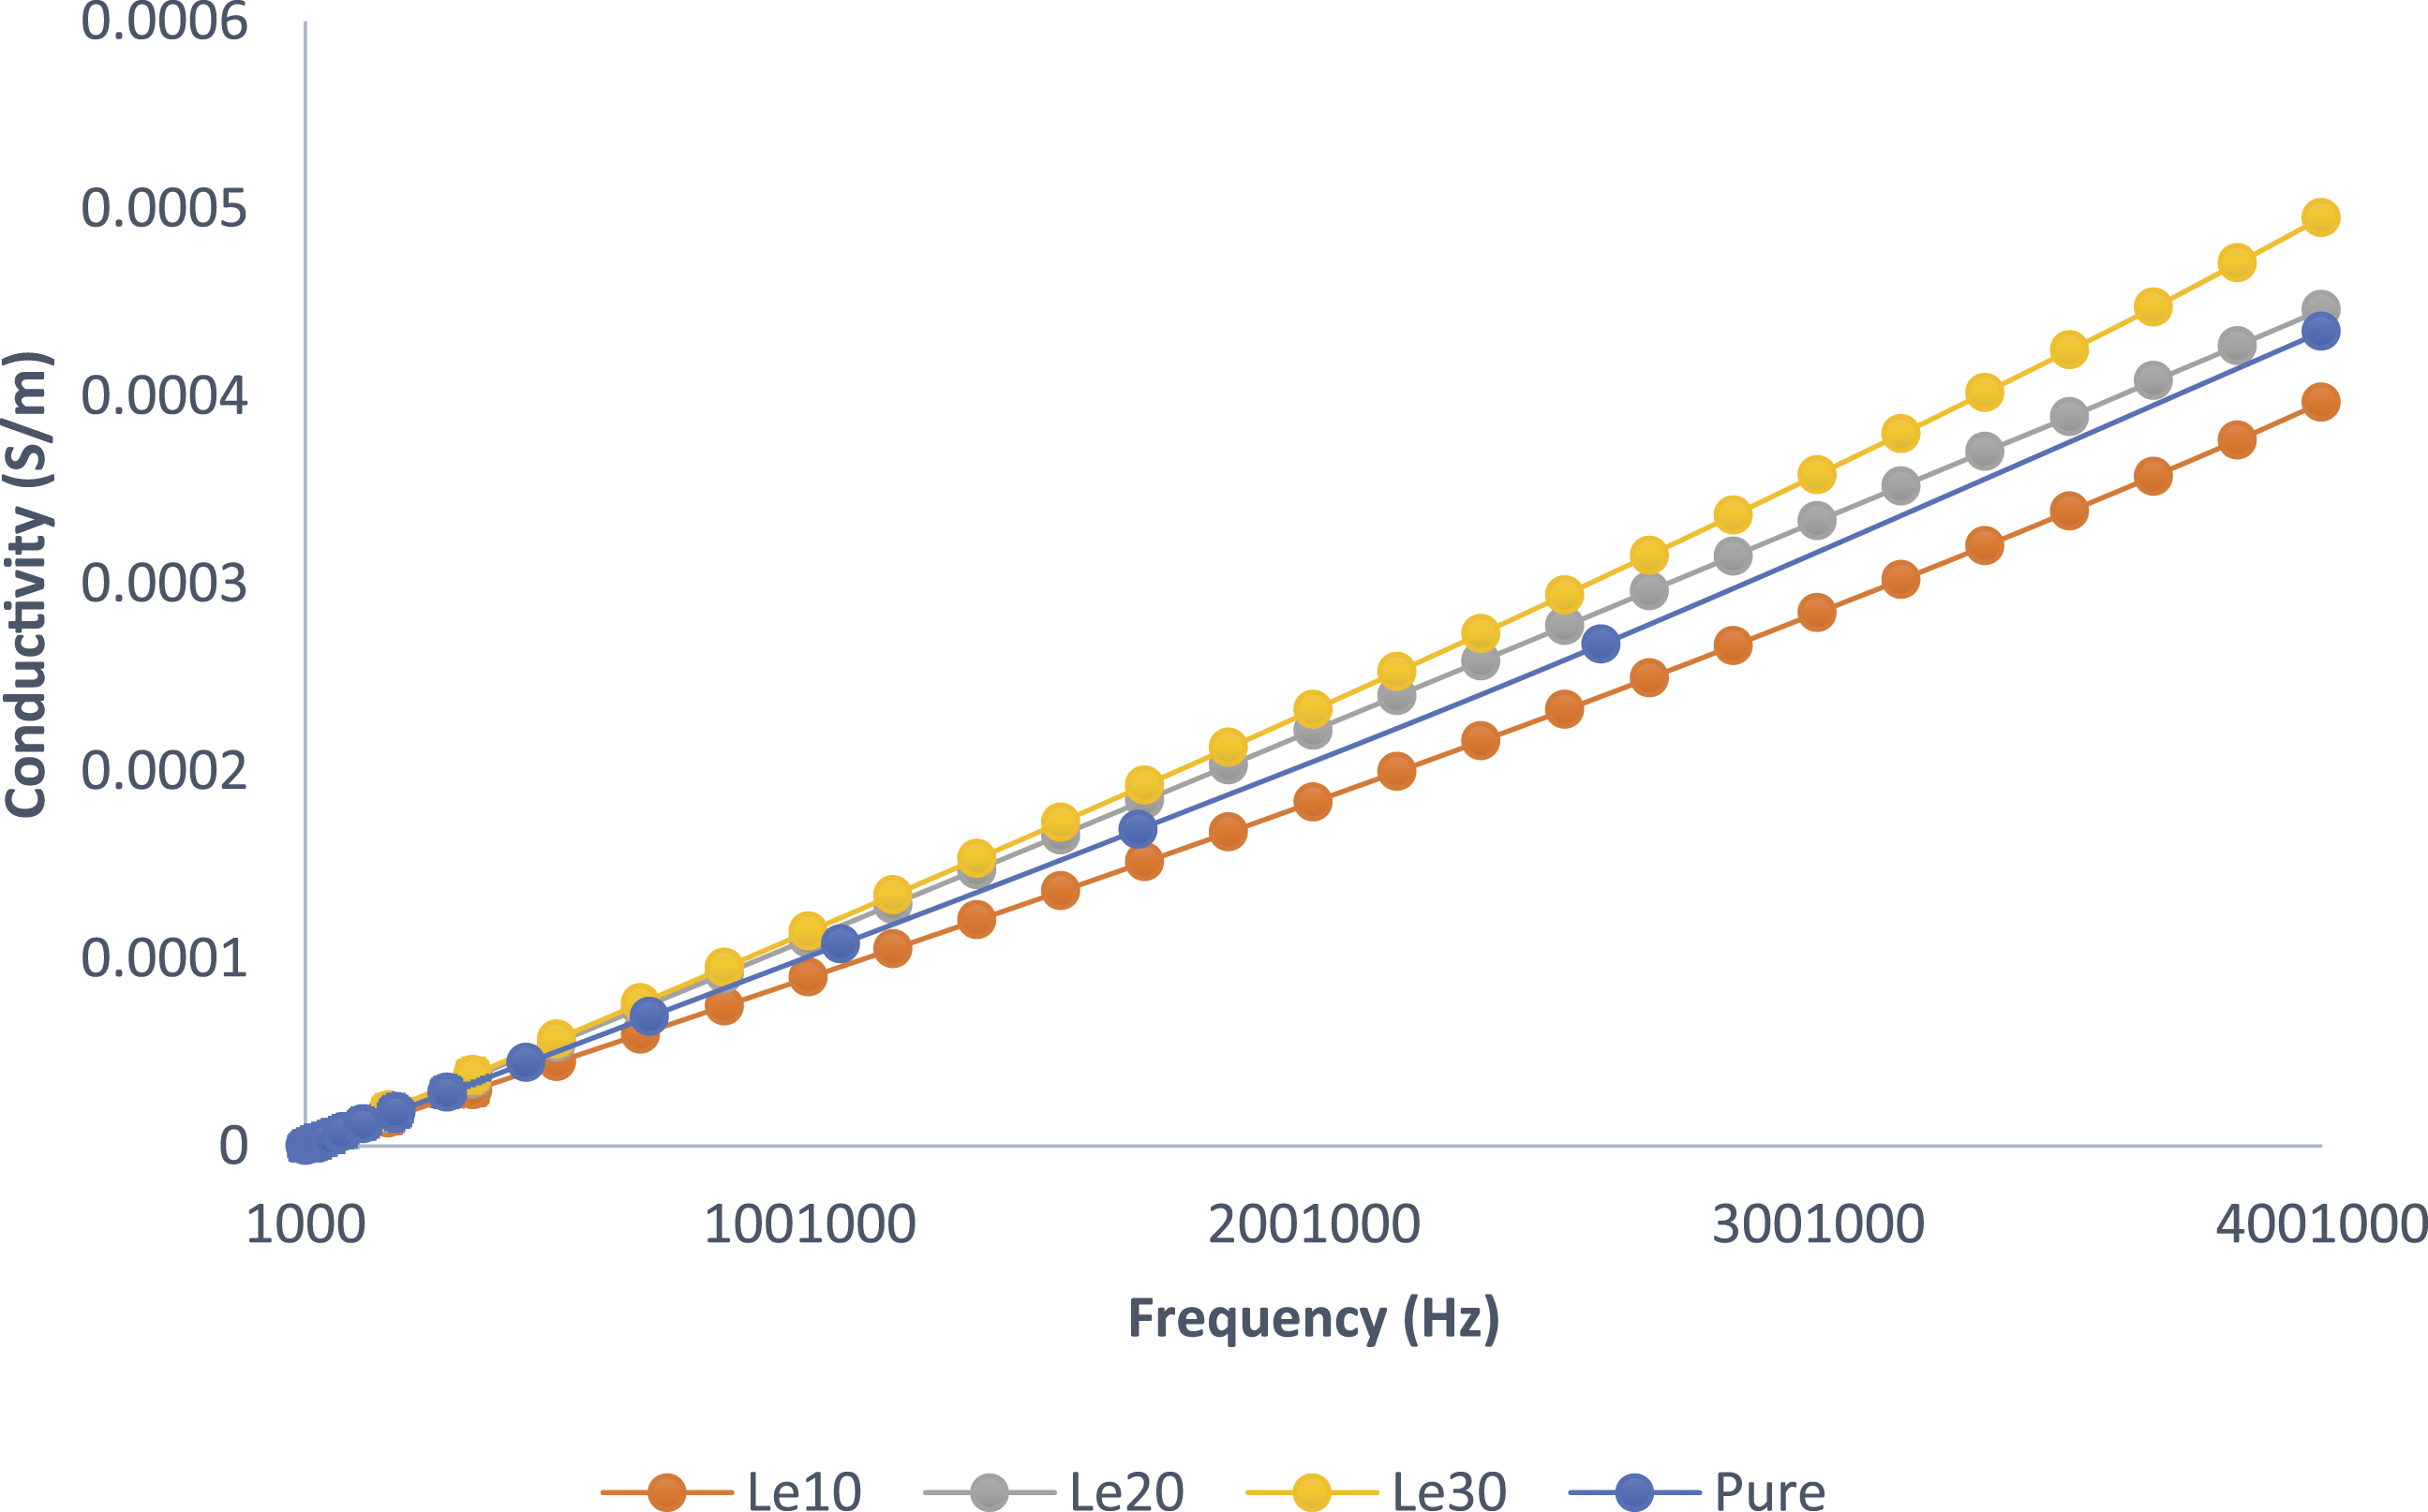
Figures 14(a) and (b) present the frequency dependency of the conductivity and the resistivity of the four different composites under study with 30% filler loading. It is obvious that all composites follow the same trend as the pure polymer with sumac powder composites showing highest conductivity and Limon powder composites being the lowest. To investigate the filler loading effect, Figure 15 shows the conductivity as a function of the filler concentration of all prepared composites at 1.0 MHz and 4.0 MHz. (a) Conductivity and (b) resistivity of samples with 30% doping in comparison with pure sample with respect to frequency variations. Conductivity as a function of filler loading at 1.0 MHz and 4.0 MHz.

It has been noticed in all cases that the dielectric constant and the conductivity of the composites increased as the filler loading increased. This is mainly due to the expected presence of polar groups of cellulose and water content within these natural fillers.12,54 With no electric field applied, these polar groups tend to have random directions resulting in a net zero polarization. When applying an electric field, the polar groups are redirected in the same direction of the electric field resulting in an increment in εr. When the frequency of the applied electric filed starts increasing, the randomness in the directions of the polar groups will also increase resulting in a decrement in the value of εr.
The net current density resulting from applied electric filed consists of three main components: the current density due to the applied source, the effective conduction current density, and the effective displacement current density. Both the effective conduction current density and the displacement current density are directly proportional to the frequency of the applied electric field. As the frequency increases, these two current densities will increase resulting in an increment in the total current density and thus increasing the conductivity of the dielectric composite.
Summary of the dielectric constant measurements presented in the literature.

Conclusions
Studying the electric characteristics of new natural composite materials is of crucial importance to be able to fully utilize them in new emerging industries. Various natural powder-based composites were investigated regarding their electrical behavior. It was revealed that the dielectric constant and the conductivity of the prepared composite materials show consistent trend behavior comparable to the pure samples with respect to frequency variation. Sumac powder composites have demonstrated the maximum increase in both dielectric constant and conductivity. The dielectric constant of So30 powder composites increased by about 55% at 1 KHz frequency and about 31% at 1 MHz. Le30 powder composites showed the minimum increment with 13% at 1 KHz and 20% at 1 MHz. It was also demonstrated that the conductivity of all composites has been increased with increasing the frequency. Sumac powder composites displayed the highest effect regarding enhancing the conductivity property, whilst lemon powder composites have demonstrated the lowest effect. The dielectric constant of the proposed composites showed low dependency on the frequency of the applied electric field within the considered range. The effect of filler loading was more obvious at higher frequencies. The ac conductivity showed high degree of dependency on frequency variations.
Footnotes
Acknowledgement
Authors would like to thank the anonymous reviewers for their valuable comments, which have enhanced the value of the work.
Declaration of conflicting interests
The author(s) declared no potential conflicts of interest with respect to the research, authorship, and/or publication of this article.
Funding
The author(s) received no financial support for the research, authorship, and/or publication of this article.
Data availability
The raw/processed data required to reproduce these findings cannot be shared at this time as the data also forms part of an ongoing study.