
Abstract
In the present ongoing pandemic, the N95 respirator is an essential protective barrier to suppress the spread of the SARS-Cov-2 virus and protect the frontline worker from exposure. The N95 respirators are meant for single usage; however, they can be used after sterilization, considering the economy and shortfall in availability. At this juncture, the performance of the respirator after various types of sterilization and usage condition is required to be analyzed in detail. With this motto, this work has proceeded. The respirator’s filtration efficiency (FE), breathing resistance, and quality factor are evaluated for two face velocities (5.8 ± 0.2 and 26.4 ± 0.9 cm/s). Sterilization techniques used here are dry air oven heating at 70–80 ± 3°C for 30 and 60 min, gamma irradiation for cumulative dose 15 and 25 kGy, and soaking in liquid hydrogen peroxide for 30 min. The filtration performance and electrostatic surface charge density are used to determine the facemask’s efficacy after sterilization. The respirator’s physical, chemical, and morphological degradation were investigated using materials area density, microscopic analyses, FTIR, Raman spectroscopy, EPR, and TGA analyses. The highest reduction in filtration efficiency is 29.36 ± 0.49–36.08 ± 1.78% after irradiation due to a reduction in the charge density (71–133%) of the respirator layers. However, the FE does not reduce significantly (0.39 ± 0.52 to −2.46 ± 0.60) for dry air heat and H2O2 sterilization despite a change in charge density (0.4–53%), but there is no direct correlation with FE. Electrostatic charge measurement of the filtration layer is a crucial indicator of FE degradation. Hence, dry air heat and H2O2 soaking are found to be the most suitable sterilization methods. No significant degradation was observed on the physical, chemical, and morphological properties of respirators layers after sterilization.
Keywords
Introduction
Personal Protective Equipment (PPE), such as respiratory facemasks, offers protection against the spread of COVID-19 through a droplet and aerosol transmission. 1 When an infected person breathes (exhale), speaks, sneezes, and coughs, the virus-containing droplets (>5.0 μm) and aerosols (<5.0 μm) will be excreted, remain suspended up to a few hours in the environment, and travel a longer distance in the air with the wind.2,3 N95 is an essential PPE to protect the wearer with at least 95% FE for Most Penetrating Particle Size (MPPS) 0.1–0.3 μm and higher efficacy for particles smaller or bigger than MPPS.4,5 Hence, the N95 facemask offers excellent protection when it correctly fits over the face. N95 masks are made of filter fabric, which consists of nylon, cotton, polyester, and polypropylene. 6 Though the N95 facemask was designed for single-use, the recent pandemic crises made it necessary to seek emergency alternatives for decontamination and reuse procedures. Globally, frontline workers are facing a shortage of certified masks because of the sudden increase in demand.7–9 Toward this crisis, facemasks are being reused multiple times after sterilization with the appropriate method without compromising their effectiveness.
Several non-traditional sterilization/decontamination methods have been evaluated with various degrees of success.9,10 Many potential sterilization methods have been explored already, and they are based on chemical and physical processes. The chemical methods include immersing the mask with liquid/vapor hydrogen peroxide, chlorine dioxide, ethylene oxide, chlorine dioxide, sodium hypochlorite, bleach, alcohols, soap solution, and ozone decontamination.11–14 The techniques such as soaking/dipping in alcohol, chlorine, soap, and bleach damage the fibers of facemasks and significantly degrade the respirator’s filtration ability. 15 The liquid/vapor hydrogen peroxide and ethylene oxide are reported to preserve filtration characteristics, but it needs complicated equipment, extensive procedure, low throughput, and trained human resource.12,14 The physical methods include treatment with dry/steam heat, microwave oven, hot water, UV light sterilization, electron beam, and ionizing radiation.16–18 Although UV radiation does not affect the filtering efficiency, it seldom penetrates the respirator’s filter layers, resulting in partial sterilization. 19 Sterilization by ionizing radiation and the electron beam is a well-known technology with large throughput for PPE and other medical equipment; however, recent studies show that the FE of N95 facemasks significantly deteriorates after gamma sterilization.20,21 Nonetheless, it was helpful for surgical and textile facemasks.9,20 The dry/steam heat treatment has emerged as a promising and straightforward decontamination method for respirators with good scalability and uniformity in disinfection.17,22 The steam sterilization (generated by autoclave and microwave) was found helpful as far as FE, but it may deteriorate fabric materials of the N95 mask.9,23 However, understanding the physical and chemical changes induced by the various treatments remain unexplored or incomplete in a few cases. Therefore, examining the potential changes in physical structure and in particular, the electrostatic charge density status of decontaminated respirators should be carried out. 24
Hence, the effect of decontamination processes on the electrostatic charge status, physical and chemical change in the fiber of the N95 respirator have been studied in the current work. The sterilization methods used in this work are (i) cumulative ionizing radiation dose of 15 and 25 kGy, (ii) dry heat (the temperature at 70–80°C) for 30 and 60 min, and (iii) liquid soaking in hydrogen peroxide (10% concentration) for 30 min. The respirators were evaluated for filtration performance (FE, breathing resistance, and quality factor) before and after the decontamination. Here, we carefully studied the FE and surface charge density on different layers of the facemask to notice a relation to the electrostatic filtration before and after various sterilization. In addition to that, the physical and chemical changes to the respirator fiber material were examined using an optical microscope, attenuated total reflectance-Fourier transform infrared spectroscopy (ATR-FTIR), electron paramagnetic resonance (EPR), Raman spectroscopy, and thermogravimetric analyses (TGA). Most of the recent studies are focused exclusively on the respirator’s filtration performance.14,17,22,25,26 Nonetheless, the current work aimed to investigate the effectiveness of the N95 respirators after decontamination by various methods and, most importantly, the origin cause for degrading respirator performance. The detailed experimental materials and methods, data analysis, results and discussion, conclusion are described in this article.
Materials and methods
Protective respirator
Detailed specifications of N95 respirators along with an optical image.

Filtration test setup
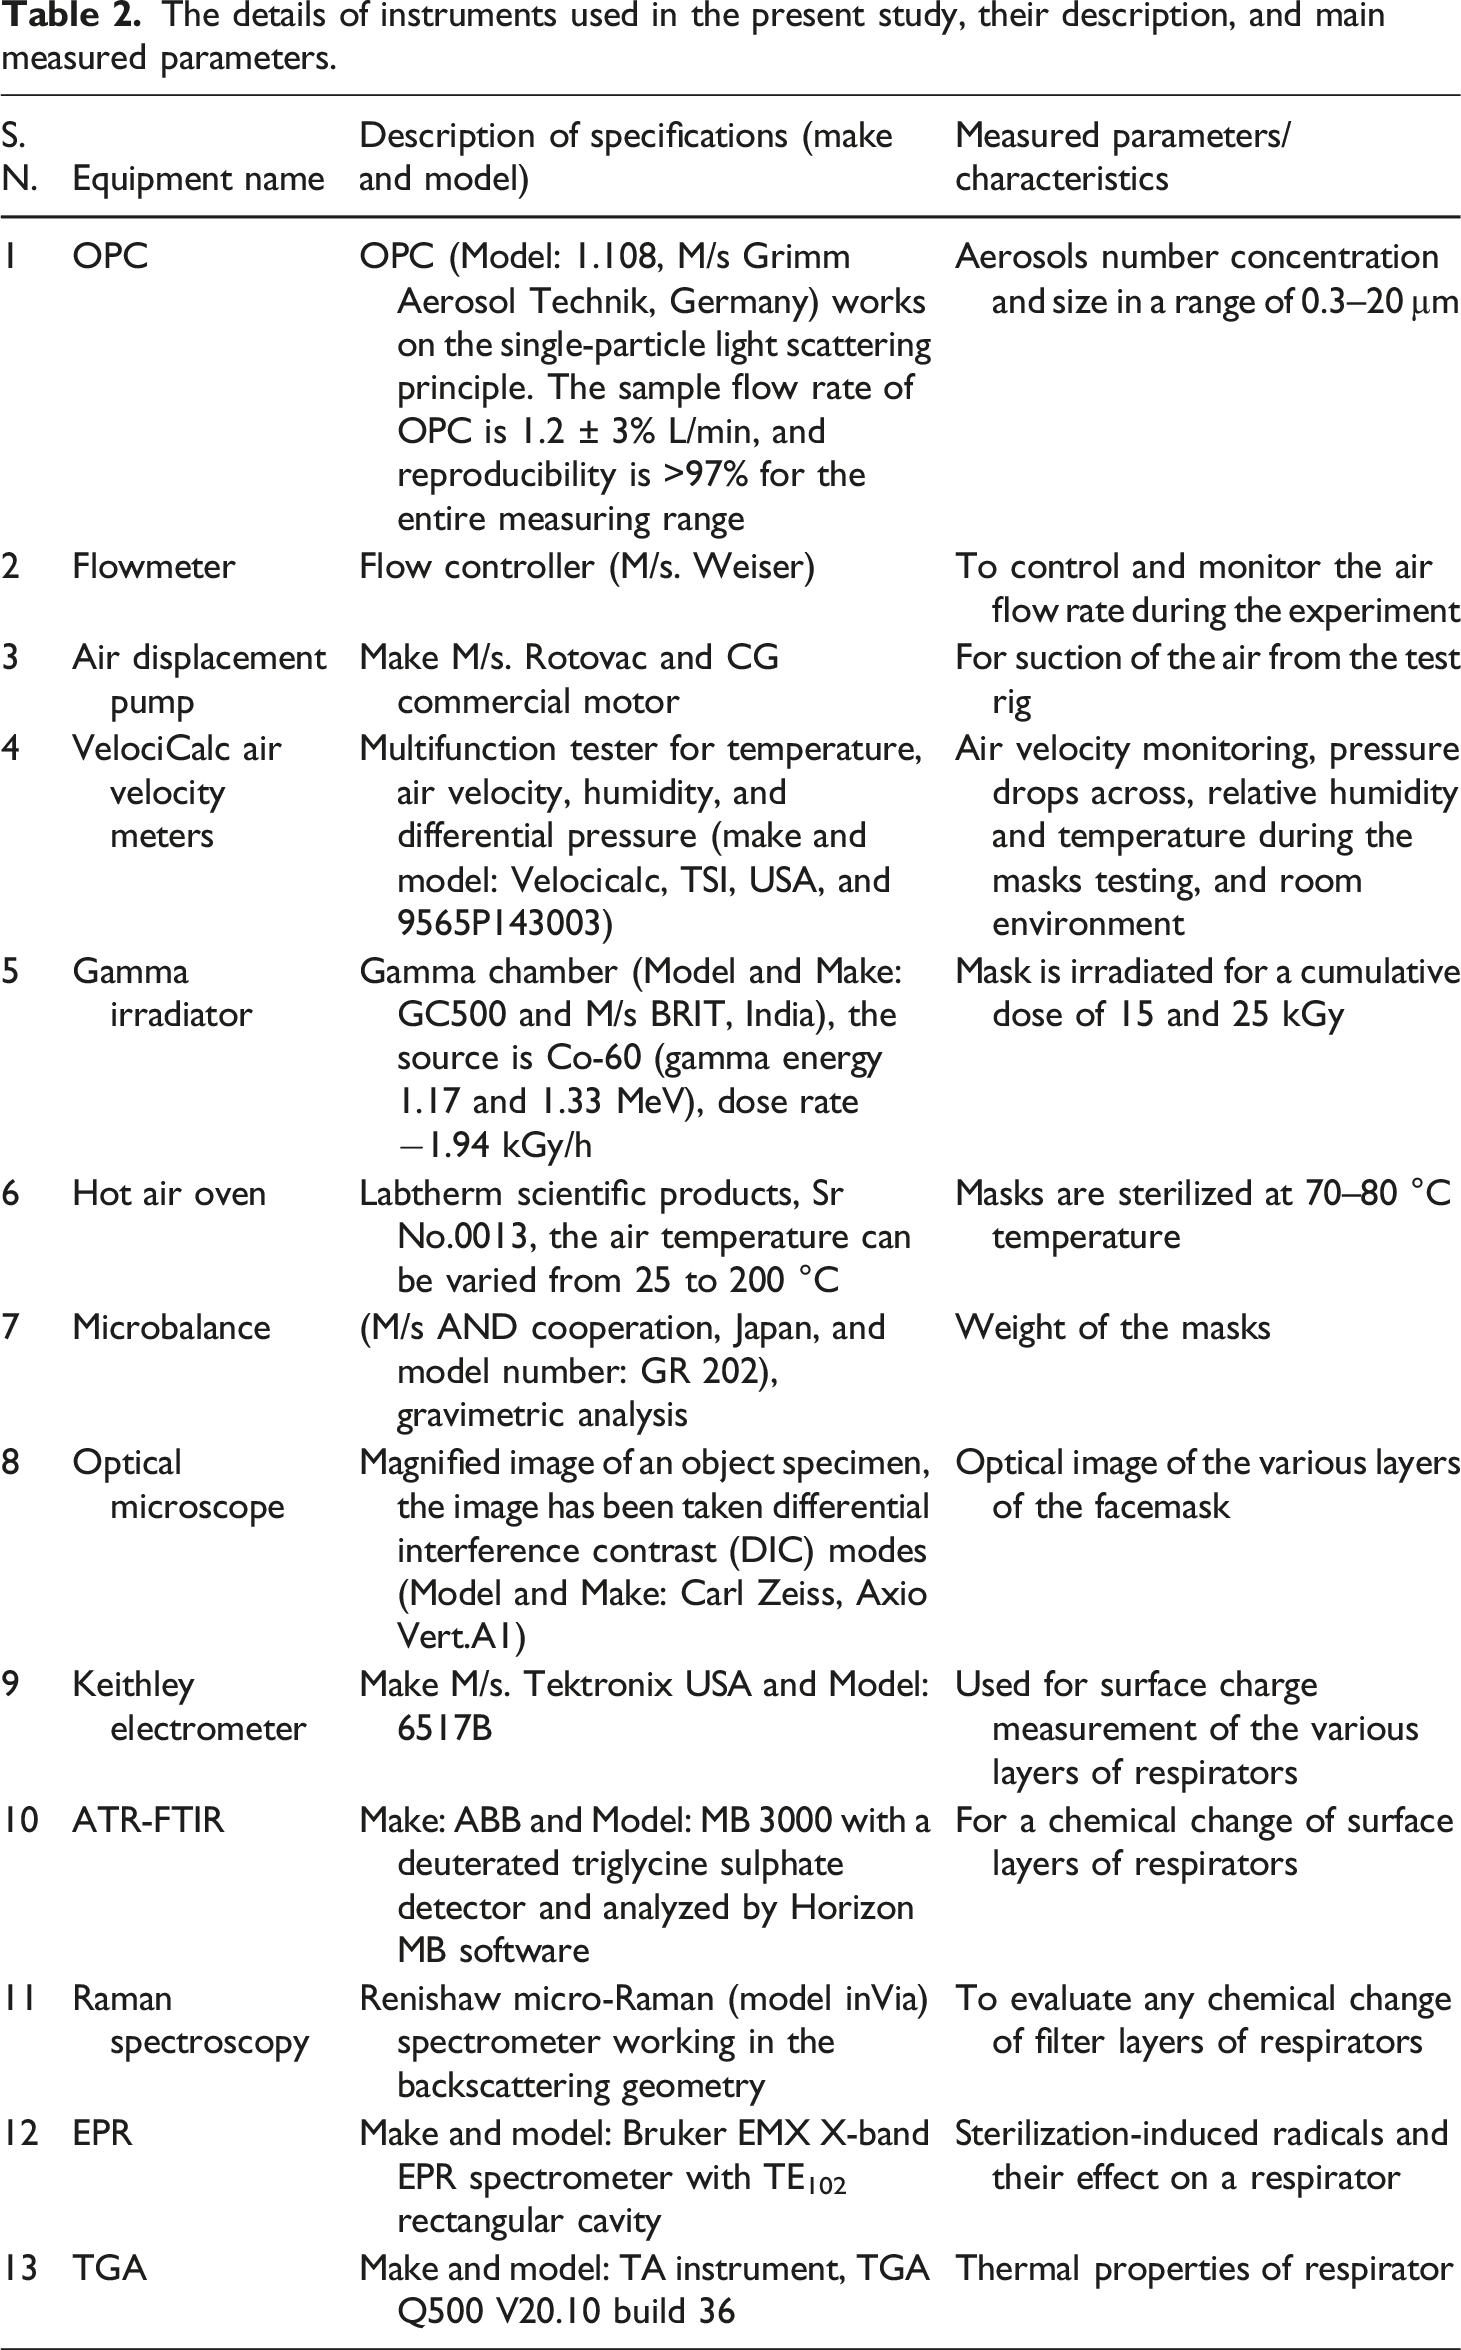
The details of instruments used in the present study, their description, and main measured parameters.
Sterilization/decontamination methods
Sterilization methods used in the present studies and their antibacterial and virus deactivation test parameters.

The dry heat sterilization of respirators was carried out for two different time durations of 30 and 60 min using a hot air oven with air temperature ranging from 70 to 80 ± 3°C. The sterilization temperature and duration are chosen accordingly to deactivate SARS-COV-2 without damaging the facemask fiber integrity. 47 The liquid H2O2 (M/s Thermo Fisher Scientific Pvt. Ltd., India, and brand name is Qualigens) is diluted with distilled water at a 1:9 ratio of H2O2 and water. The mixed solution is stirred for about 10 min to homogenize the solution, and then the respirator is submerged for 30 min. The H2O2 concertation and duration of soaking are selected for better sterility based on the literature. Special care has been taken in each sterilization process not to bend or damage the respirator to avoid reducing FE, decreasing surface charge density, and mechanical properties. The facemasks were dried overnight after soaking in H2O2 before performing the FE testing in the room environment. The ambient temperature and humidity are in the range of 25–30°C and 60–80%, respectively. The measuring range equipment for air temperature and RH are 10 to 60 ± 0.3°C and 5 to 95 ± 3%, respectively.
Test conditions
Summary of the experimental test conditions.

Data acquirement and analysis
The performance of the tested respirator was assessed in two aspects: (i) the FE, which was determined as % of aerosol particle retained by the respirator, and (ii) the comfort of the mask, which was represented by the breathing resistance (Rf). A good respirator model should combine high efficiency with low resistance; however, the resistance and filter efficiency often conflict with each other. Comprehensively considering these two parameters, the overall performance of a respirator can be assessed by the quality factor (Qf). A higher Qf value corresponds to the better overall performance of the respirator.
Filtration efficiency (FE %)
FE of the respirator is determined before and after sterilization using the following formula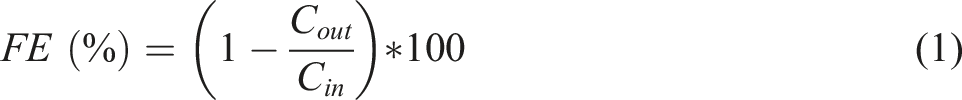
Breathing resistance (Rf)
Rf was determined as the pressure difference between the upstream (Pin) and downstream (Pout) side of the respirator when applied constant airflow
Quality factor (Qf)
A commonly used relation for filtration quality factor to determine the performance of the respirator is defined as15,57,58
The sampled data has been recorded for about 2–3 minutes in 6 s frequency of each tested condition from OPC (total sample record 20–30). FE estimated by taking the average of the collected data (upstream and downstream) for each mask for the tested period. FE averaged for all similar test conditions (face velocity and sterilization methods) and four replicates. To evaluate the statistical difference in the FE, Rf, and Qf after various sterilizations, one-way ANOVA was performed for two-face velocities. p-values < 0.05 were considered statistically significant. The FE, Rf, and Qf were calculated by equations (1)–(3) to assess the respirator’s particulate protection, breathing comfort, and overall performance. However, investigating the deterioration of electrical and material properties of polypropylene fiber needs further investigation.
Electrostatic charge measurement
The electrostatic surface charge density is determined by measuring the surface charge on the respirator layers. The Keithley electrometer used for charge measurement of the respirators and the schematic presentation is given in Figure S2 (Supplementary material). The electrometer’s input is a three-lug (Triax) connector, with the red-colored innermost wire (input high) as the charge-sensing terminal. The charge-sensing terminal is connected to the metal surface (Copper plate). The metal noise shield (another copper enclosure) is connected with black wire (input low), and the third wire (green color) is grounded. Both copper plate and noise shield are electrically isolated by introducing an insulating Teflon sheet in between. Resolution of charge measurement capability is few femtocoulombs (fC) with an accuracy of 0.4% of the measured value. The test sample is a piece that has an area of 10 cm2 (4 cm x 2.5 cm) cut from each respirator. Five samples were analyzed for each test case, and the average value with standard deviation was reported.
Raman spectroscopy
Each respirator sample was analyzed using a micro-Raman spectrometer working in the backscattering geometry and excited with a diode pump solid-state (DPSS) laser operating at a wavelength of 514 nm. The laser beam was focused through a 20× microscope objective. The power of the laser at the sample was approximately 2 mW. The scattered light was recorded using a Peltier-cooled CCD. Raman spectra were recorded on multiple fibers at various locations of each filter layer of a respirator.
Fourier transform infrared analysis
The respirators have been analyzed before and after decontamination by Attenuated Total Reflectance-Fourier Transform Infrared spectroscopy (ATR-FTIR). All the spectra of respirator layers were recorded from 4000 to 500 cm−1 wavenumber with a deuterated triglycine sulphate detector and analyzed by Horizon MB Software. All measurements were made using 50 scans and 4 cm−1 resolutions.
Electron paramagnetic resonance analysis
Electron paramagnetic resonance analysis of pristine and sterilized filter layer of the respirator was carried out using Bruker EMX X-band EPR spectrometer with TE102 rectangular cavity. All the EPR spectra records were performed at room temperature using 9.84 GHz microwave frequency, 6.23 mW microwave power, 100 kHz modulation frequency, 8G modulation amplitude, 40.96 ms time constant, and 41.94 ms sweep time. Approximately 20 mg filter layer samples were taken in a quartz tube (3 mm inner diameter) for EPR analysis.
Thermogravimetric analyses analysis
A thermogravimetry instrument was used to study the sterilization effect on the thermal properties of the respirator’s fiber mat. All thermal analysis experiments were carried out in argon atmosphere from room temperature to 700°C with a 10°C/min heating rate.
Respirator structure and microscopic analysis
The material area density (fabric mass per unit area) is determined by weighing a specified area of 1 inch 2 (2.54 × 2.54 cm2) of each layer of respirator material. The fabric mat weight has been calculated based on each layer. An analytical microbalance with an accuracy of 0.1 mg was used to weigh the masks, and the error in the dimension of the length of the respirator specimen is 0.1 cm. Further, macro and microscopic assessment of the physical structure of the respirator was examined by the optical microscope. The average diameter of fibers of different layers of respirator is assessed using Image J software.
Results and discussion
FE for aerosol optical size >0.3 µm
The measured upstream aerosols concentration, for ambient aerosols of <1.0 μm size, ranges from 97.45 to 97.75% and >1.0 μm, ranges from 2.55 to 2.25% for the face velocity of 5.8 cm/s. At the higher face velocity (26.4 cm/s), it ranges from 98.03 to 98.22% and 1.97 to 1.78% for aerosols <1.0 μm and >1.0µm, respectively. 9 The highest aerosol concentration is observed to be in the range of 0.3–0.5 μm. A significantly lower aerosol concentration is observed in the upper size range >1.0 μm for both face velocities. The data analysis was excluded for separate size bins because as size increases statistical error will be upsurged due to lower concentration. In addition, it is to be noted that, the separate size bin analysis of FE of N95 masks is greater than 99% for particles higher than 1 μm after various sterilizations. 9 Nevertheless, the foremost objective of the present work is to investigate the root cause of FE degradation based on the physical and chemical characterization of the various layers of mask media rather than size-dependent FE. Hence, the FE evaluation of the facemask for two face velocities and four replicates assessed for aerosol diameter >0.3 μm and is briefed in the Supplementary material (Table S1).
Filtration efficiency, breathing resistance, and quality factor of respirator for two face velocity, control, and after decontamination.

Breathing resistance (Rf)
Rf is an important parameter to characterize the performance of the respirator. The measured Rf across the respirators before and after sterilization for two face velocities is given in Table 5. As expected, the Rf across respirators increases with an increase in face velocity. The average Rf of control respirators is 31.38 ± 2.16 and 258.90 ± 4.61 Pa for low face velocity and high face velocity correspondingly. The Rf across respirators remains similar after dry heat, H2O2, and ionizing radiation sterilization for low face velocity. In the case of high face velocity, the Rf almost remained the same after ionizing irradiation; however, it slightly increased after dry heat sterilization and decreased after H2O2 disinfection. For all tested conditions, the Rf indicates the condition for usage during breathing (even for high face velocity), which is in the accepted range, 345 and 245 Pa for inhalation and exhalation resistance limit, respectively. 60 These findings reveal that the tested N95 mask did not deteriorate as far as breathing resistance was concerned after sterilization.
Quality Factor (Qf)
Based on the FE and Rf reported in Table 5, the Qf was calculated for two face velocities to assess the overall performance of the tested respirator. The results are presented in Table 5. The higher Qf value corresponds to the better overall performance of respirators. The Qf of pristine and decontaminated respirators ranges from 0.188 to 0.157 Pa−1 for 5.8 cm/s face velocity and 0.012–0.014 Pa−1 for 26.4 cm/s face velocity for dry heat and hydrogen peroxide sterilization. In the case of gamma radiation, the Qf becomes 0.04 and 0.004 Pa−1 for low and high face velocity, respectively. The decrease of Qf value with an increase of face velocity is consistent with the literature. The Qf values of respirators at low face velocity and after sterilization are more than defined values for inhalation and exhalation resistance. However, it is found less than the defined limits (0.031 Pa−1 and 0.022 Pa−1 for inhalations and exhalation) for high face velocity due to high-pressure drop across the mask (except gamma sterilization). In the case of ionizing radiation decontamination, the Q f value is 3–5 times lower than the pristine respirator, which was mainly a reduction in FE. The overall performance of the tested respirator based on FE, Rf, and Qf shows that the respirator was worsened only after gamma sterilization.
Electrostatic surface charge density (σ)
The electrostatic charge on respirators is measured before and after sterilization to evaluate the effect of surface charge density on FE. The average surface charge on a full respirator (without cutting and separating each layer) is measured and summarized in Table S2 (Supplementary material). The average surface charge on the control respirator is 1.031 ± 0.277 nC, which is in line with other literature. 61 The polarity of the surface charge on the respirator changed after sterilization; however, the magnitude of charge has increased despite sterilization methods. The variation in the average surface charge between pristine and sterilized respirators ranges from 2 to 7 times. The highest variation was observed after gamma sterilization, while the lowest was in dry heat sterilization. Here, we observed that the full respirators charge measurement does not convey any correlation with FE. However, FE has decreased after gamma sterilization, but the average charge on the respirator surface increased.
To investigate more insightful information on the surface charge on each layer of respirator, the surface charge is measured by separating each layer of the filter media with the sample area 10 cm2. Care has been taken not to damage the filter media while cutting otherwise which would alter the electrostatic charge measurement. The σ (nC/m2) calculated for each respirator layer from measured charge and surface area is summarized in the Supplementary material (Table S3) and presented in Figure 1. The measured σ of pristine respirator is negative polarity for the outer (−1927 ± 662 nC/m2) and the inner layer (−2220 ± 203 nC/m2), while for the filter layer, it is positive (+3530 ± 750 nC/m2). The electrostatic charge on pristine masks showed that each layer has a significant amount of surface charge density. The charge density imposed on the respirators layer is the same order of magnitude as other reported values.
62
It appears that charge density on each layer gets reduced after sterilization, and polarity has changed for the filter layer after gamma irradiation. After sterilizing the respirator by dry heat and H2O2, the polarity of charge density remains similar, but the magnitude persists for H2O2 and decreases for dry heat decontamination. After gamma irradiation, the polarity of charge density on the filter layer changes while remaining identical for the inner and outer layers; however, a significantly considerable reduction in charge density. The measured σ has a significant statistical variation, and absolute values are uncertain; however, the substantial change in charge density is detected qualitatively. The present observation on electret electrostatic charge in line with other literature21,61,62 shows inconsistent variation. Electrostatic surface charge density on each layer of a pristine and sterilized respirator.
The percentage change in FE (ΔFE%) and surface charge density (Δσ%) after different sterilization from pristine facemasks are summarized in the Supplementary material (Table S4). The ΔFE of the facemask from pristine to dry heat and H2O2 sterilization is ranged from less than 0.57% and - 2.46% for low and high face velocity. However, FE changes around 29.36 ± 0.49–36.08 ± 1.78% for gamma sterilization for both flow conditions. The ΔFE% is higher for gamma sterilization and further enhances for higher face velocity. The Δσ on the outer and inner layers ranges from 70.98 to 86.13%, while for filter layer ranges from 122.69 to 133.67% for gamma sterilization. In case of dry heat sterilization, the Δσ on the outer, inner and filter layer ranges from 3.10 to 53.10%, and for H2O2 sterilization, the Δσ ranges from 0.35 to 8.70%. The most significant reduction in charge density observed after gamma sterilization correlates with the decrease in respirator FE. The FE does not affect much after dry heat and H2O2 sterilization despite the change in surface charge density. There is a qualitative correlation between σ and FE; masks with higher reduction in charge density show a higher decrease in FE. Nevertheless, the finding is consistent with other studies that have observed the degradation in the FE of respirator associated with filter media electrostatic charge degradation. Previous studies also demonstrated similar observations. 62
It is known that aerosol filtration occurs by five basic mechanisms, viz. gravitational settling, inertial impaction, interception, diffusion, and electrostatic force.63,64 The N95 mask consists of electrets fibers media capable of capturing and retaining fine particles through electrostatic and mechanical filtration processes. 65 However, the mechanical filtration was not influenced by electrostatic force, that is surface charge density. The least efficiency is associated with particles from 100 to 500 nm, more prominent for diffusion and lesser for interception; hence, the 95% efficiency achieved for this range of particles by electrostatic force and dielectrophoretic force. When the electret media modified its charges (σ), the efficiency may also get altered. It is found from the present studies that each layer of respirator has a different charge density and different polarity. The filter layer is composed of opposite charge layers, which gives rise to a strong electric field gradient inside the filter layers. In the absence of a durable inhomogeneous electric field, the respirator’s filtration properties are reduced, which is observed in ionizing radiation sterilization.9,20,21,24,39,61 The gamma irradiation produced significant bipolar ions (positive and negative ions) in the surrounding environment and in the respirator fiber material (electrons and/or holes). These ions attracted, trapped, de-trapped, and recombined in the PP fiber structure and modified their surface charge density. The electrons and/or holes produced inside the PP fibers during irradiation also contributed to reducing surface charge density. 66 The surface charge density decreased rapidly at the initial stage of irradiation exposure and got saturated when charge density fell below the value at which significantly ion recombination occurred. In the case of dry heat sterilization, the reduction in charge density is due to the de-trapping of electrons and holes, which depends on the sterilization temperature. With increasing temperature, trapped charged on PP layer de-trapped easily, that is, the charge dissipation flux is more prominent at a higher temperature. 62 In the case of H2O2 sterilization, no significant reduction in charge density is observed.
Evaluation of physical, chemical, and morphological properties of facemask structure
N95 respirator comes in many brands and models that use different materials and methods to meet industrial filtration requirements. Most of the N95 respirators use a melt-blown electret material that employs electrostatic forces to increase the filtration for MPPS. Ionizing radiation and other sterilization methods are known to modify the properties and structure of the polymer. They can also adversely affect filter fiber in several ways, such as enhancing polymer oxidation, chain scission, cross-linking, and charge neutralization of electret material.67,68 To check any significant change of the respirator, an investigation is carried out for physical, chemical, and morphological properties caused by sterilization. The respirator was analyzed using Raman spectroscopy, FTIR, EPR, TGA, optical microscopy, and gravimetry analysis.
Raman analysis
Changes in chemical structure due to sterilization were investigated by recording Raman spectra of pristine and sterilized respirators (Figure 2). Raman spectrum of pristine respirator exhibits multiple bands due to CH2, CH3 groups frequencies, and their coupled modes corresponding to isotactic polypropylene (iPP).
69
Bands in the 800 to 1200 cm−1 range are attributed to the 31 helix, a regular conformation of isotactic polypropylene polymorphs.
69
No modification was observed in the number of peaks and peak positions, confirming that iPP retains its chemical structure even after various sterilizations. In addition, no chemical changes were observed in Raman analysis of gamma-irradiated facemasks up to 25 kGy. Although few studies show that >50 kGy gamma irradiation forms carbonyl and hydroxyl groups in iPP fiber,
70
however, in the present study, corresponding peaks were not present, which is in line with other work.
21
Raman spectra of pristine and sterilized filter layer of the respirators.
Fourier transform infrared analysis
Typical FTIR spectra of respirators filter layer with and without decontamination are shown in Figure 3. ATR-FTIR spectrum of the pristine respirator exhibits four IR peaks in the range of 2750–3000 cm−1 due to stretching vibrations of CH2 and CH3 groups. Peaks at 2950 and 2871 cm−1 are due to CH3 asymmetric and symmetric stretching vibrations, respectively, while peaks at 2908 and 2833 cm−1 are due to CH2 asymmetric and symmetric vibrations, respectively.71,72 ATR-FTIR spectrum of respirator also contains two intense peaks and various small peaks in 1500 to 750 cm−1. The peak at 1457 cm−1 is attributed to CH3 asymmetric deformation or CH2 scissor vibrations, while 1373 cm−1 is due to CH3 symmetric deformation vibrations.
71
Absorption peaks displayed at 1162, 997, 971, and 899 cm−1 are assigned to CH3 rocking vibrations, while peaks at 843 and 805 cm−1 are assigned to CH2 rocking vibrations. Also, the peaks at 1162, 971, and 899 cm−1 can be assigned to C-H wagging, C-C asymmetric stretching, and C-C symmetric stretching vibrations, respectively.71,73 ATR-FTIR spectra of respirators confirm that the filter layer is made of polypropylene fiber. The peak position and number of peaks remain the same before and after various sterilization methods (Figure 3). It can be concluded that gamma irradiation and other sterilization methods have not caused any significant changes in the molecular structure of iPPs. ATR-FTIR spectra of pristine and sterilized filter layer of the respirators.
Thermogravimetric analyses analysis
Thermal properties of pristine and sterilized filter layer of respirator were analyzed with TGA and presented in Figure 4. The thermal properties of the pristine and sterilized respirators are identical. TGA curve and its derivative for the filter layers for pristine and sterilized masks showed a significant weight loss with a peak degradation temperature of 460°C. Besides, no significant changes were observed in the TGA curve of the sterilized respirator layer, confirming no change in the thermal properties of facemasks after sterilization. TGA analyses (left figure) and derivative of TGA (right figure) curve of filter layer of respirators.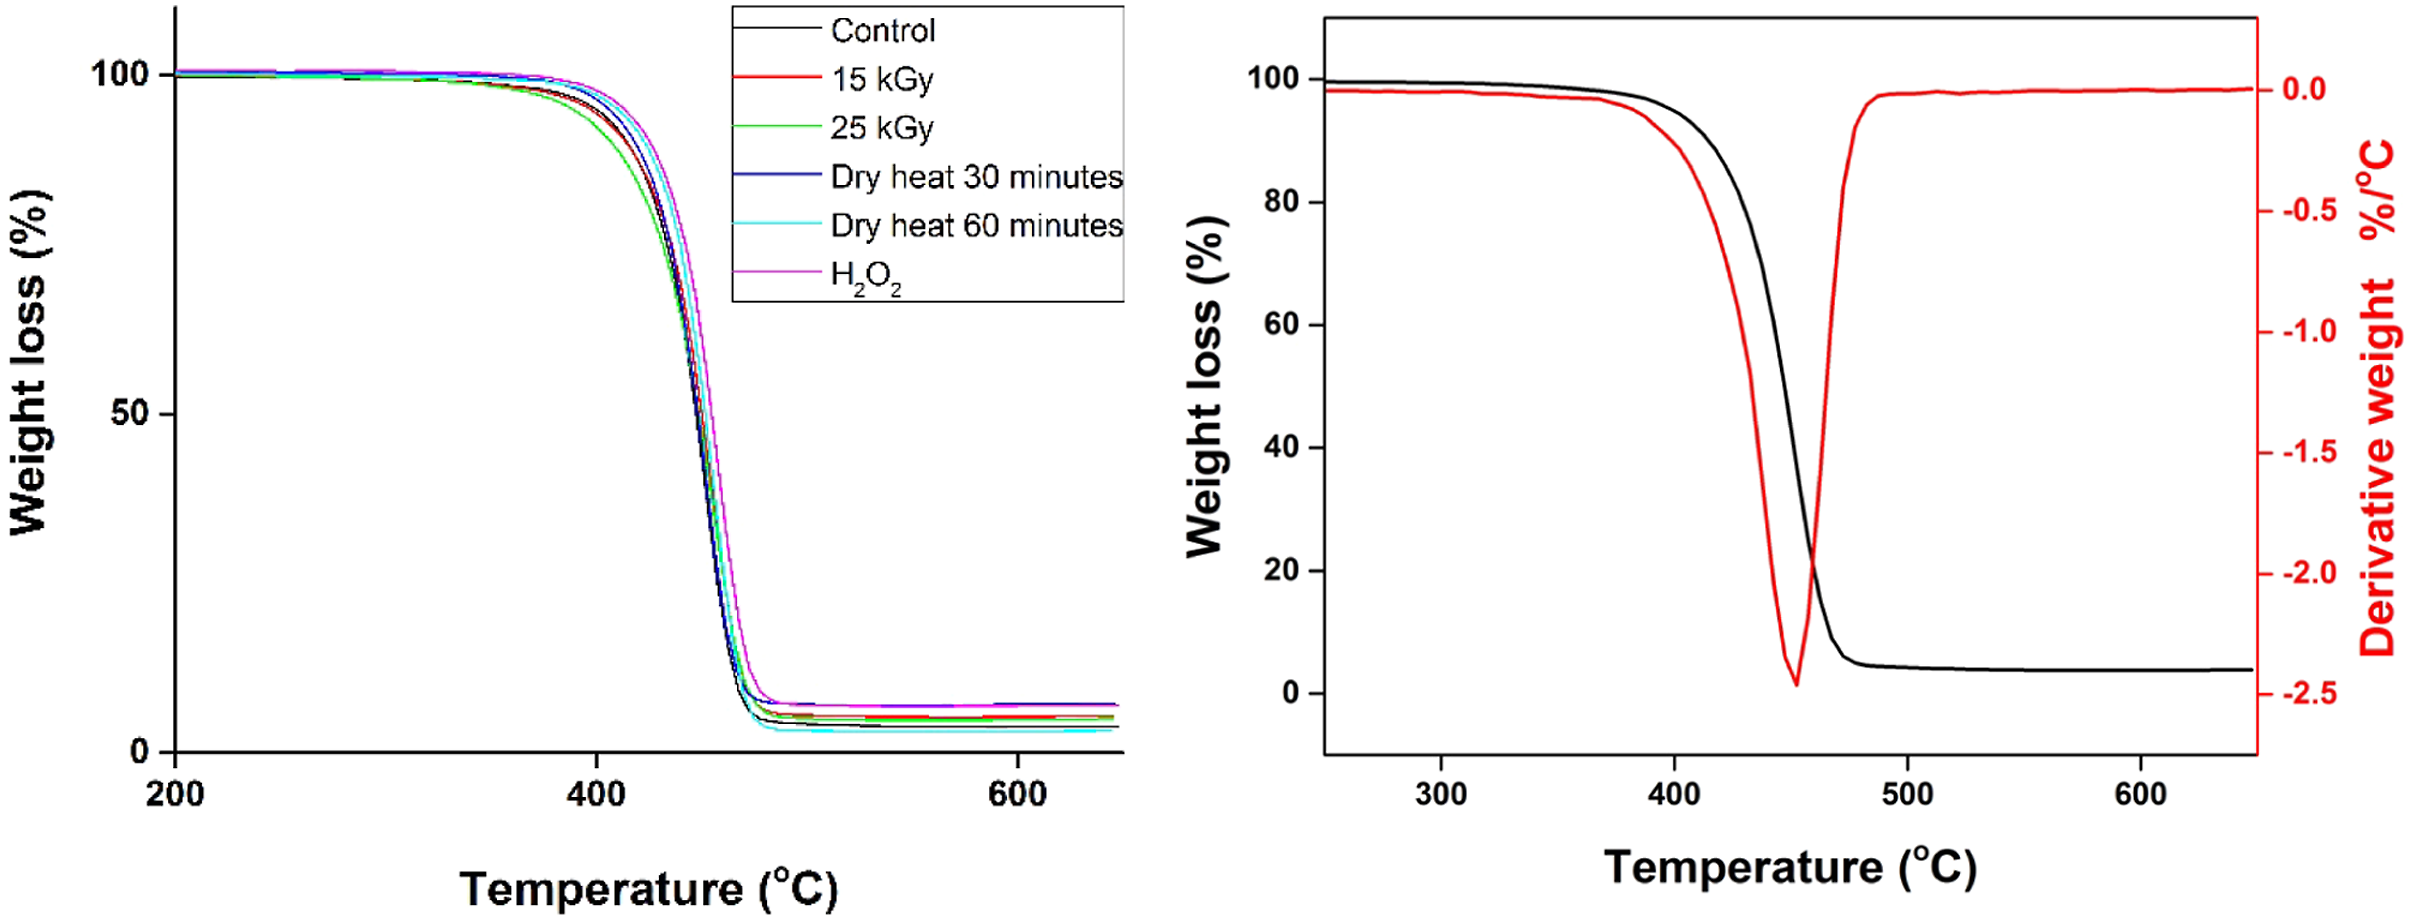
Electron paramagnetic resonance analysis
Sterilization of respirators can generate radicals (electrons and/or holes) that may lead to a change in the properties of the respirator’s fiber materials. EPR analysis was carried out to investigate the behavior of sterilization-induced radicals and their effect on respirator performance. EPR spectra of the pristine and sterilized respirator are shown in Figure 5. No change was observed in the EPR spectra of pristine, dry heat, and H2O2 treated filter layers. However, a gamma sterilized facemask exhibits three EPR signals at g
1
= 2.035, g
2
= 2.008, and g
3
= 2.005, and the signal intensity of these radicals increases with an increase in radiation dose. These radicals are attributed to stable peroxyl radicals (ROO•) formed by exposure to carbon-based radicals (generated during irradiation) with atmospheric oxygen.74,75 EPR spectra of pristine and sterilized filter layer of the respirators.
Gamma irradiation-induced radicals may lead to further modifications in the respirator fiber material. The stability of radicals was investigated by storing the irradiated respirator at room temperature and recording the EPR spectra at different time intervals of up to 30 days. The signal intensity spectra and peak intensity variation with storage time for 25 kGy are shown in Figure 6, and for 15 kGy are given in the Supplementary material (Figure S3). The EPR peak signal intensity decreases with time for both radiation doses (Figure 6 and S2), and the signal fades 95–97% after 30 days from the radiation exposure. The radiation-induced radicals react with the polymer backbone via chain scission or cross-linking, which leads to a decrease in radical concentration. However, as revealed by FTIR and Raman studies, the dose used for sterilization (up to 25 kGy) is insufficient to induce any materials properties changes in the respirator layer. The iPP has excellent resistance to a radiation dose up to ∼10 kGy widely accepted and performed acceptably up to ∼40 kGy for year storage.
76
Electron paramagnetic resonance signal intensity spectra and peak intensity variation with storage time.
Physical and morphological properties
The N95 respirators were disassembled to understand their structural components and possible physical and morphological degradation of the respirator. The masks are made of three primary structure layers: outer, filter, and inner layer, and the filter layer is composed of two sub-layers. The filter layer of the respirator is sandwiched between the outer and inner layers. The macro and microscopic analysis of the respirator physical structure was carried out using gravimetric analysis and an optical microscope. The material areal density of different layers of respirator is investigated and given in Figure 7. The measured average material areal density of the outer, filter, and inner layer of the respirator is 5.97 ± 0.29, 5.83 ± 0.31, and 4.06 ± 0.26 mg/cm2, respectively. The fabric material area density is 30–32% higher for the outer and filter layer than the respirator’s inner layer. The material areal density remained almost the same before and after decontamination, and the variation was insignificant. The combined three layers of mask material’s area density are 15.74 ± 0.55 mg/cm2. Comparison of material area density for pristine and sterilized respirator layers.
Further, optical microscopic analysis of polypropylene fiber layers of respirator has been conducted, and optical images are shown in Figure 8. There is no observable and significant change found in the morphology of the fiber after various decontamination. The respirator fiber diameter of the inner and outer layer is 20.19 ± 1.35 μm, and the filter layer is 3.58 ± 1.31 μm. The filter layer has less mean fiber diameter compared to the outer and inner layers. Optical image of three-layer certified mask: outer, inner, and filter layers of control and sterilized. The scale bar represents 200 μm in length for outer and inner layers and 100 μm for filter layers. Merge corner image is in higher optical magnification.
Conclusions
During the initial stage of the pandemic, it was unclear whether the supply chain of respirators could adequately respond to the demand. This motivated the present study for the reusability of respirators after sterilization. The N95 respirator was evaluated for particulate FE, breathing resistance, quality factor after sterilization using dry heat, H2O2 soaking, and ionizing radiation for a single cycle and two face velocities 5.8 and 26.4 cm/s. As expected, the breathing resistance increases with increasing face velocity; this reflects that it is harder to breathe through a facemask when the respiratory flow is high. The measured breathing resistance of the tested facemask is in the accepted range for inhalation and exhalation resistance, that is, breathing resistance was not changed significantly. The FE does not deteriorate considerably after dry heat for 30 and 60-min duration and H2O2 sterilization. However, in the case of gamma sterilization, FE reduces to 68.69 ± 0.35–70.44 ± 0.54% for low face velocity and is still reduced with higher face velocity. The quality factor of facemasks under-investigated sterilization conditions is in the acceptable range except for ionizing irradiation.
Further, the surface charge density on respirator layers was investigated and found to be changed 71–133% during the first cycle of irradiation sterilization. In the case of dry heat and H2O2 treatment, the surface charge density dropped 3–53% and 0.35–8.7% during the first cycle, respectively. The EPR analysis reveals that the ionizing radiation has generated substantial radicals inside respirator fiber media; however, in the case of dry heat and H2O2 sterilization, there are no significant radicals observed. The FTIR, Raman, and TGA spectra of the respirator’s layer revealed that irradiation and other sterilization methods have not caused any considerable chemical and thermal changes on the fiber materials. The morphological and materials area density analysis of the respirator layers indicates that no significant deterioration has occurred after sterilization. The most significant reduction in charge density observed after gamma sterilization correlates with reducing respirator FE. However, the FE does not affect much after dry heat and H2O2 sterilization despite the change in surface charge density. Thus, it is recommended that the N95 respirator may be sterilized a few cycles with dry heat and H2O2 soaking. N95 masks, made of electret filtering media, are not recommended for sterilization by ionizing radiation; it will compromise the FE, that is, quality factor. Nonetheless, few researchers advocate the reusability of masks post gamma sterilization by recharging the masks that recover the FE.21,61
This study comprises electrostatic charge measurement to detect a change in FE after various sterilization methods. Like some other tests (the face fit test) is meant for control materials and can only determine the respirator’s fitness appropriate to the user. They cannot be able to conclude to what degree and why the masks are degraded after sterilization. Nonetheless, the fit test is important to check if the mask has any physical modifications following the decontamination process, which will be attempted in the future course of action. Most of the recent works focused on measuring the respirator’s surface potential and correlated it to the filtration performance.21,62 Electrostatic charge measurement of the filtration layer is a crucial indicator of FE degradation. The present study was used to understand the degree of degradation under gamma sterilization and correlate with electrostatic charge properties on each respirator layer. However, it is worth noting that the large variability in charge measurement made it challenging to obtain high certainty in observations. Nevertheless, the finding is consistent with other studies that have observed the degradation in FE of masks associated with filter media electrostatic charge degradation.21,24,39,61,62 Further, the N95 respirators are available in many brands and models that use different materials and manufacturing methods to meet industrial filtration requirements. Additionally, electret charge measurement of other brands of respirators and each cycle of sterilization can also be assessed for their reusability and various sterilization methods.
Supplemental Material
sj-pdf-1-jit-10.1177_15280837221090663 – Supplemental Material for A detailed investigation of N95 respirator sterilization with dry heat, hydrogen peroxide, and ionizing radiation
Supplemental Material, sj-pdf-1-jit-10.1177_15280837221090663 for A detailed investigation of N95 respirator sterilization with dry heat, hydrogen peroxide, and ionizing radiation by Amit Kumar, Shailesh Joshi, Subramanian Venkatesan and Venkatraman Balasubramanian in Journal of Industrial Textiles
Footnotes
Acknowledgements
The authors acknowledge Director, IGCAR, Shri S. Athamalingam, Associate Director, Radiological and Environmental Safety Group (RESG), and Dr R. Venkatesan, Head, Radiological and Environmental Safety Division (RESD), for their encouragement and support to carry out this work. Dr O. Anna Lakshmi and Dr S. Balakrishnan were acknowledged for providing EPR and TG/DTA analyses facility. Dr Soumee Chakraborty and Dr Ch. Kishan Singh was admitted for Raman analysis and optical microscope of various layers of the mask. The authors would like to thank the reviewers for their valuable comments and suggestions, which significantly enhanced the article’s value.
Declaration of conflicting interests
The author(s) declared no potential conflicts of interest with respect to the research, authorship, and/or publication of this article.
Funding
The author(s) received no financial support for the research, authorship, and/or publication of this article.
Supplemental Material
Supplemental material for this article is available online.
References
Supplementary Material
Please find the following supplemental material available below.
For Open Access articles published under a Creative Commons License, all supplemental material carries the same license as the article it is associated with.
For non-Open Access articles published, all supplemental material carries a non-exclusive license, and permission requests for re-use of supplemental material or any part of supplemental material shall be sent directly to the copyright owner as specified in the copyright notice associated with the article.