
Abstract
Generally, carbon and glass fibers based composites are used in high-tech end products, but these are not preferred in indoor, outdoor and hygienic furniture applications due to microorganisms attack and prone to fire. In the first section of the research, different percentages (5%, 10%, and 15%) of zirconium phosphate (ZrP) particles were added in epoxy resin and corresponding glass/epoxy composites were fabricated to enhance their flame retardancy (FR) and mechanical properties (tensile, flexural, Charpy impact, and short beam shear). In the second section, different percentages (0.5%, 1%, and 1.5%) of zinc oxide (ZnO) particles were mixed in the epoxy resin and corresponding glass/epoxy composites were fabricated to optimize their antibacterial activity and mechanical performance. 15% concentration of ZrP particles exhibited the maximum flame retardancy and mechanical performance in composites, and 1.5% concentration of ZnO particles exhibited the highest antibacterial activity along with improved mechanical performance. In the third section, two (02) pure glass and carbon, and two (02) glass-carbon/carbon-glass hybrid composites were made with optimized concentrations of both ZrP and ZnO particles. Carbon/epoxy (H2) composite showed the highest mechanical properties in comparison with glass and hybrid composites due to the presence of four layers of carbon reinforcement. These functional hybrid composite-based furniture products can be used in indoor, hygienic (hospitals, schools, and offices), and outdoor furniture applications.
Keywords
Introduction
A composite has two major constituents, that is, matrix and reinforcement, which have combined properties over the individual one. Resin and fiber are mixed physically on macroscopical scale to manufacture a composite and different fillers are also added to get certain functionalities.1–3 Composite materials are replacing heavy metals because of their high strength to weight ratio and low density. These composites are used in low-end to high-tech applications like furniture, doors, wall paneling, automobiles, electronics, construction, aerospace, submarines, etc.4,5
Matrix shows the surface quality of composites and helps in load transfer. Matrices are available in the form of polymers, ceramics, and metals. Polymer matrices are most commonly used in low-end to high-end applications. 6 Thermoset and thermoplastic matrices are two types of polymer matrices. Thermoset polymers are those polymers which are not able to remelt and reshape after curing. Epoxy, vinyl ester, phenolic and polyester resins are the types of thermoset polymer matrices. 7 Thermoplastic polymers are able to remelt and reshape on heating. Polyethylene, polypropylene, and PVB are the examples of the thermoplastic polymer matrices.8,9 While reinforcement consisting of different synthetic (carbon, glass, aramids, etc.) or natural (jute, hemp, flax, etc.) fibers is the stiff part of the composite which is incorporated into the matrix and provides strength to the composite. 10
Composites having two or more than two different fibers as reinforcements or different types of matrices are known as hybrid composites. Hybridization can also be achieved by adding synthetic and natural fibers or resins in a single composite to get the required characteristics.11,12 Also, composites can be made flame retardant and antibacterial and other functionalities can be added in the composites by mixing different filler content or fibers or resins having inherent desired properties.13–15
Gopinath et al., examined the mechanical performance of composite made from jute fibers with polyester and epoxy resins. It was revealed that jute/epoxy exhibited superior mechanical properties than jute/polyester composites. Hence, the jute/epoxy composite was a better selection for automotive applications than jute/polyester composites. 16 Abbas et al., investigated the effect of glass microspheres on the hemp/green epoxy composites and revealed that Charpy impact, flexural and tensile properties were enhanced by adding glass microspheres in the composites. 17 Also, addition of lignin in hemp/epoxy composite lead to the increase in their mechanical performance. 18
Wang et al., investigated the impact of coupling agent (maleic anhydride-grafted polyethylene “MAPE”) with hemp fiber. The yield stress and compressive modulus was increased with the presence of MAPE and by increasing the hemp fiber content. 19 Silver and zinc nanoparticles improved the antimicrobial activity of their corresponding PLA and chitosan-based composites along with other properties.20,21,22 Furthermore, nanoparticles of silver, magnesium hydroxide, zinc oxide, zinc borate, and layered hydroxides are majorly used as flame retardant materials. 23
Cone calorimeter is used as the most common instrument for research and measurement of the fire retardancy of polymeric materials. It measures the values based on the external heat flux, the peak of heat release rate, thermal feedback, and dimensional distances from the cone heater. UL-94 vertical burn test (v) ratings are used for the cone calorimeter analysis of the thermoplastics. 24 Disk diffusion, agar dilution, and broth dilution are well commonly used methods for combating bacteria. Flow cytoflurometric and bioluminescent methods are new methods used in this field of research. 25
In the previous works, different particles were added in the composites to enhance the mechanical performance, antibacterial activity, and flame retardancy of polymeric composites. To the best of author’s knowledge, no study was found on the simultaneous use of zirconium phosphate (ZrP) and zinc oxide (ZnO) particles to optimize the flame retardancy, antibacterial activity, and mechanical properties of glass-carbon hybrid composites. In the first section, different concentrations of ZrP particles were used in the epoxy resin to get optimized mechanical properties and flame retardancy of composites. While in the second section, different concentrations of ZnO particles were added in the epoxy resin to get optimized antibacterial activity and mechanical performance of their corresponding glass/epoxy composites. In the last third part, glass, carbon, and two (02) hybrid (glass-carbon) epoxy composites were prepared with enhanced antibacterial activity, flame retardancy, and mechanical properties.
Experimentation
Materials
Two types of woven reinforcements, that is, glass (1/1 plain weave having 514 g/m2 areal density) and carbon (2/1 twill weave having 520 g/m2 areal density) were used in this study. Glass was got from the Qingdao Feelongda Ltd., China, while carbon reinforcement was imported from Formosa Plastics, Taiwan. EPIKOTE™ 816 (HEXION, USA) epoxy resin and EPOTEC TH 7301 (Aditya, Thailand) hardener were utilized for composite manufacturing. Zirconium phosphate (ZrP) and zinc oxide (ZnO) particles imported from Sunshine, China, were utilized as fillers to enhance the flame retardancy (FR) and antibacterial activity, respectively. The particle sizes of the ZrO and ZrP were 343.2 nm and 812.3 nm, respectively. 14
Composite fabrication
Design of experiment 1 (DOE 1)
In the 1st section of this study, flame retardancy (FR) and different mechanical properties were tested of the fabricated composites to optimize the ZrP percentage. Different percentages (5%, 10%, and 15%) of ZrP particles were mixed in the epoxy on the weight of resin and were applied on woven glass plies. Four layered symmetrical glass/epoxy composites were fabricated by hot compression molding technique. 13-ton pressure and 120°C temperature were set on a compression machine for 40 min to get void-free composites. Reference composite sample without the addition of ZrP was also formed for comparison purpose. The fiber volume fraction of composites was calculated using equation (1) and maintained at 46% ± 0.7
14

Experimental design for the optimization of ZrP particles.

Design of experiment 2 (DOE 2)
Experimental design for the optimization of ZnO particles.

Design of experiment (DOE 3)
Experimental design for the hybrid composite.

G: Glass, C: Carbon
Testing
Different mechanical tests, that is, tensile, flexural (3-point), pendulum (Charpy) impact, and short beam shear (SBS) were performed to investigate the mechanical performance of composites in three (03) different experimental designs. Horizontal and vertical flame retardancy tests were performed in DOE 1 and DOE 3. Qualitative antibacterial test was utilized to study the antibacterial activity in DOE 2 and DOE 3.
Tensile test (ASTM D3039) having dimensions of 25 mm wide and 250 mm long, flexural test (3-point, ASTM D7264) with sample dimensions of 13 mm wide and 120 mm long, and short beam shear test (ASTM D2344) with 5 mm wide and 20 mm long sample size were performed on the UTM (Z100 All-round, Zwick) having capacity of 100 KN.26–28 Pendulum impact test (ISO 179) was performed using Charpy impact tester (Zwick/Roell, HIT 50P) having 10 mm wide and 100 mm long sample dimensions. 29 Each test was performed three times and average of results and curves were reported.
EN ISO 15025 standard test method was used for the horizontal 30 and ASTM D6413 was used for vertical 31 flame retardancy tests. AATCC 147 test method was utilized to determine antibacterial activity against Staphylococcus aureus (S. aureus) bacterial strain. 32
Results and Discussion
Design of experiment 1
In the 1st section, flame retardancy and different mechanical tests (tensile, flexural, Charpy impact, and SBS) of developed glass/epoxy composites loaded with ZrP particles were performed and compared.
Horizontal and vertical flame retardancy (FR)
Flame retardancy testing results for ZrP-loaded composites.

FM: flame retardancy
Tensile testing
The effect of ZrP particles on tensile stress in the glass/epoxy composites is shown in Figure 1, which showed the tensile stress versus extension curves. The tensile stress of composite samples was increased with the increase of ZrP percentage in this samples. It revealed that the composite containing the highest percentage of ZrP, that is, 15% gave the highest tensile stress followed by 10% and 5% ZrP and least was observed in ZrP0 composite sample. With the addition of ZrP, chain bonding disrupts and their clusters are formed which enhances the tensile properties of the ZrP-loaded composites.
35
A slight increase in the stiffness of composites is also observed as the ZrP percentage is increased. Tensile stress versus extension curves of ZrP-loaded composites.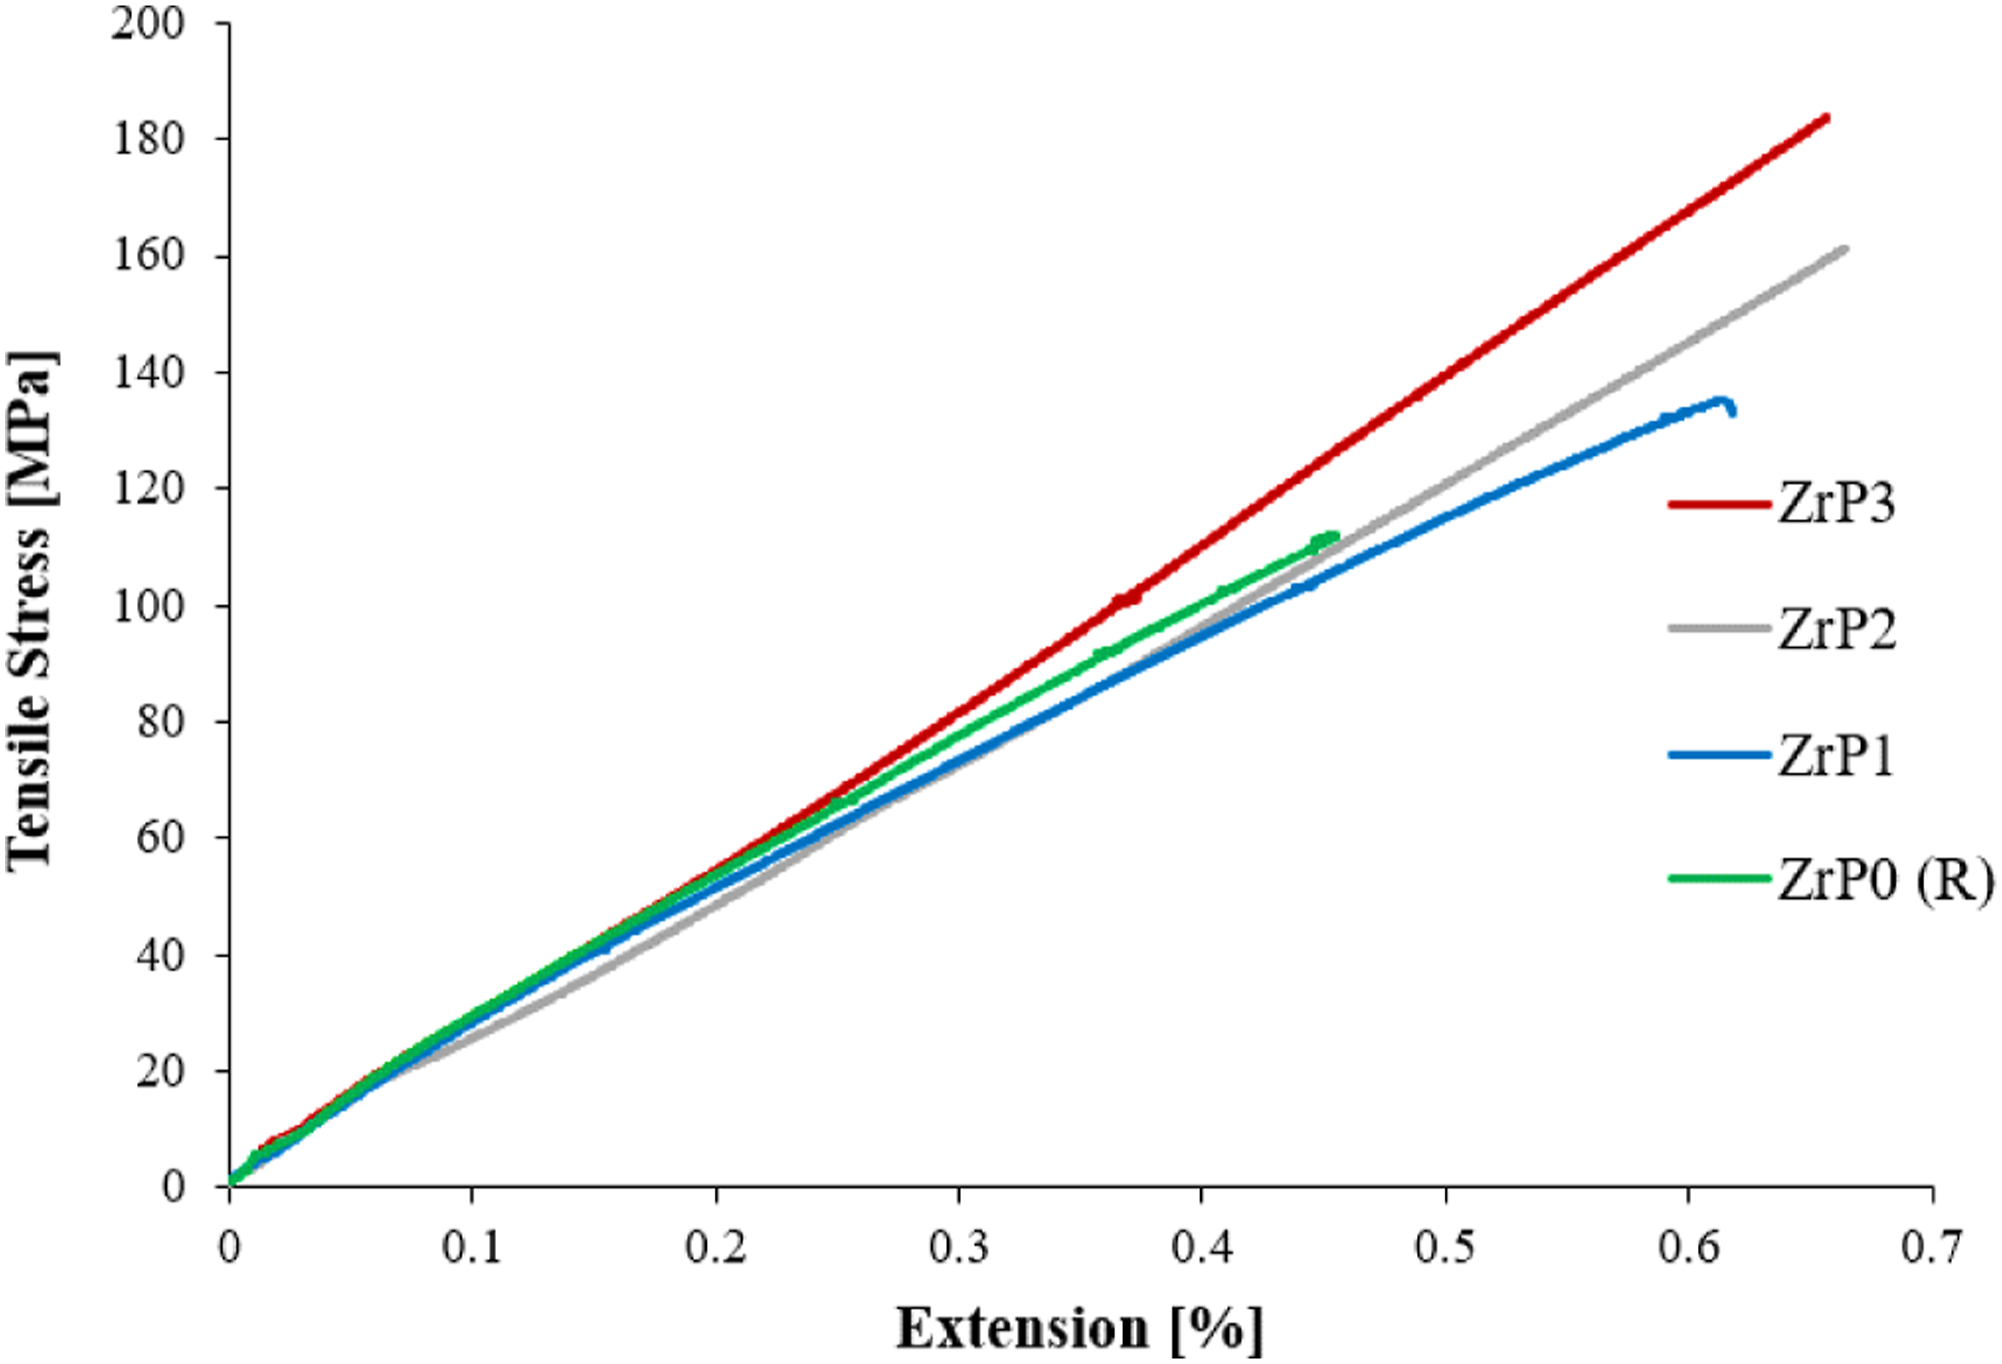
Tensile testing results of ZrP-loaded composites.

Flexural testing (3-point)
Figure 2 showed the flexural stress versus deformation curves of ZrP-loaded glass/epoxy composites. This can be observed that flexural stress was increased as the %age of ZrP was raised in the composites. The maximum value of flexural stress was observed in 15% ZrP-loaded composite followed by 10% and 5%. With the addition of ZrP, chain bonding disrupts and their clusters are formed which enhances the flexural properties of composites.
35
Flexural stress versus deformation curves of ZrP-loaded composites.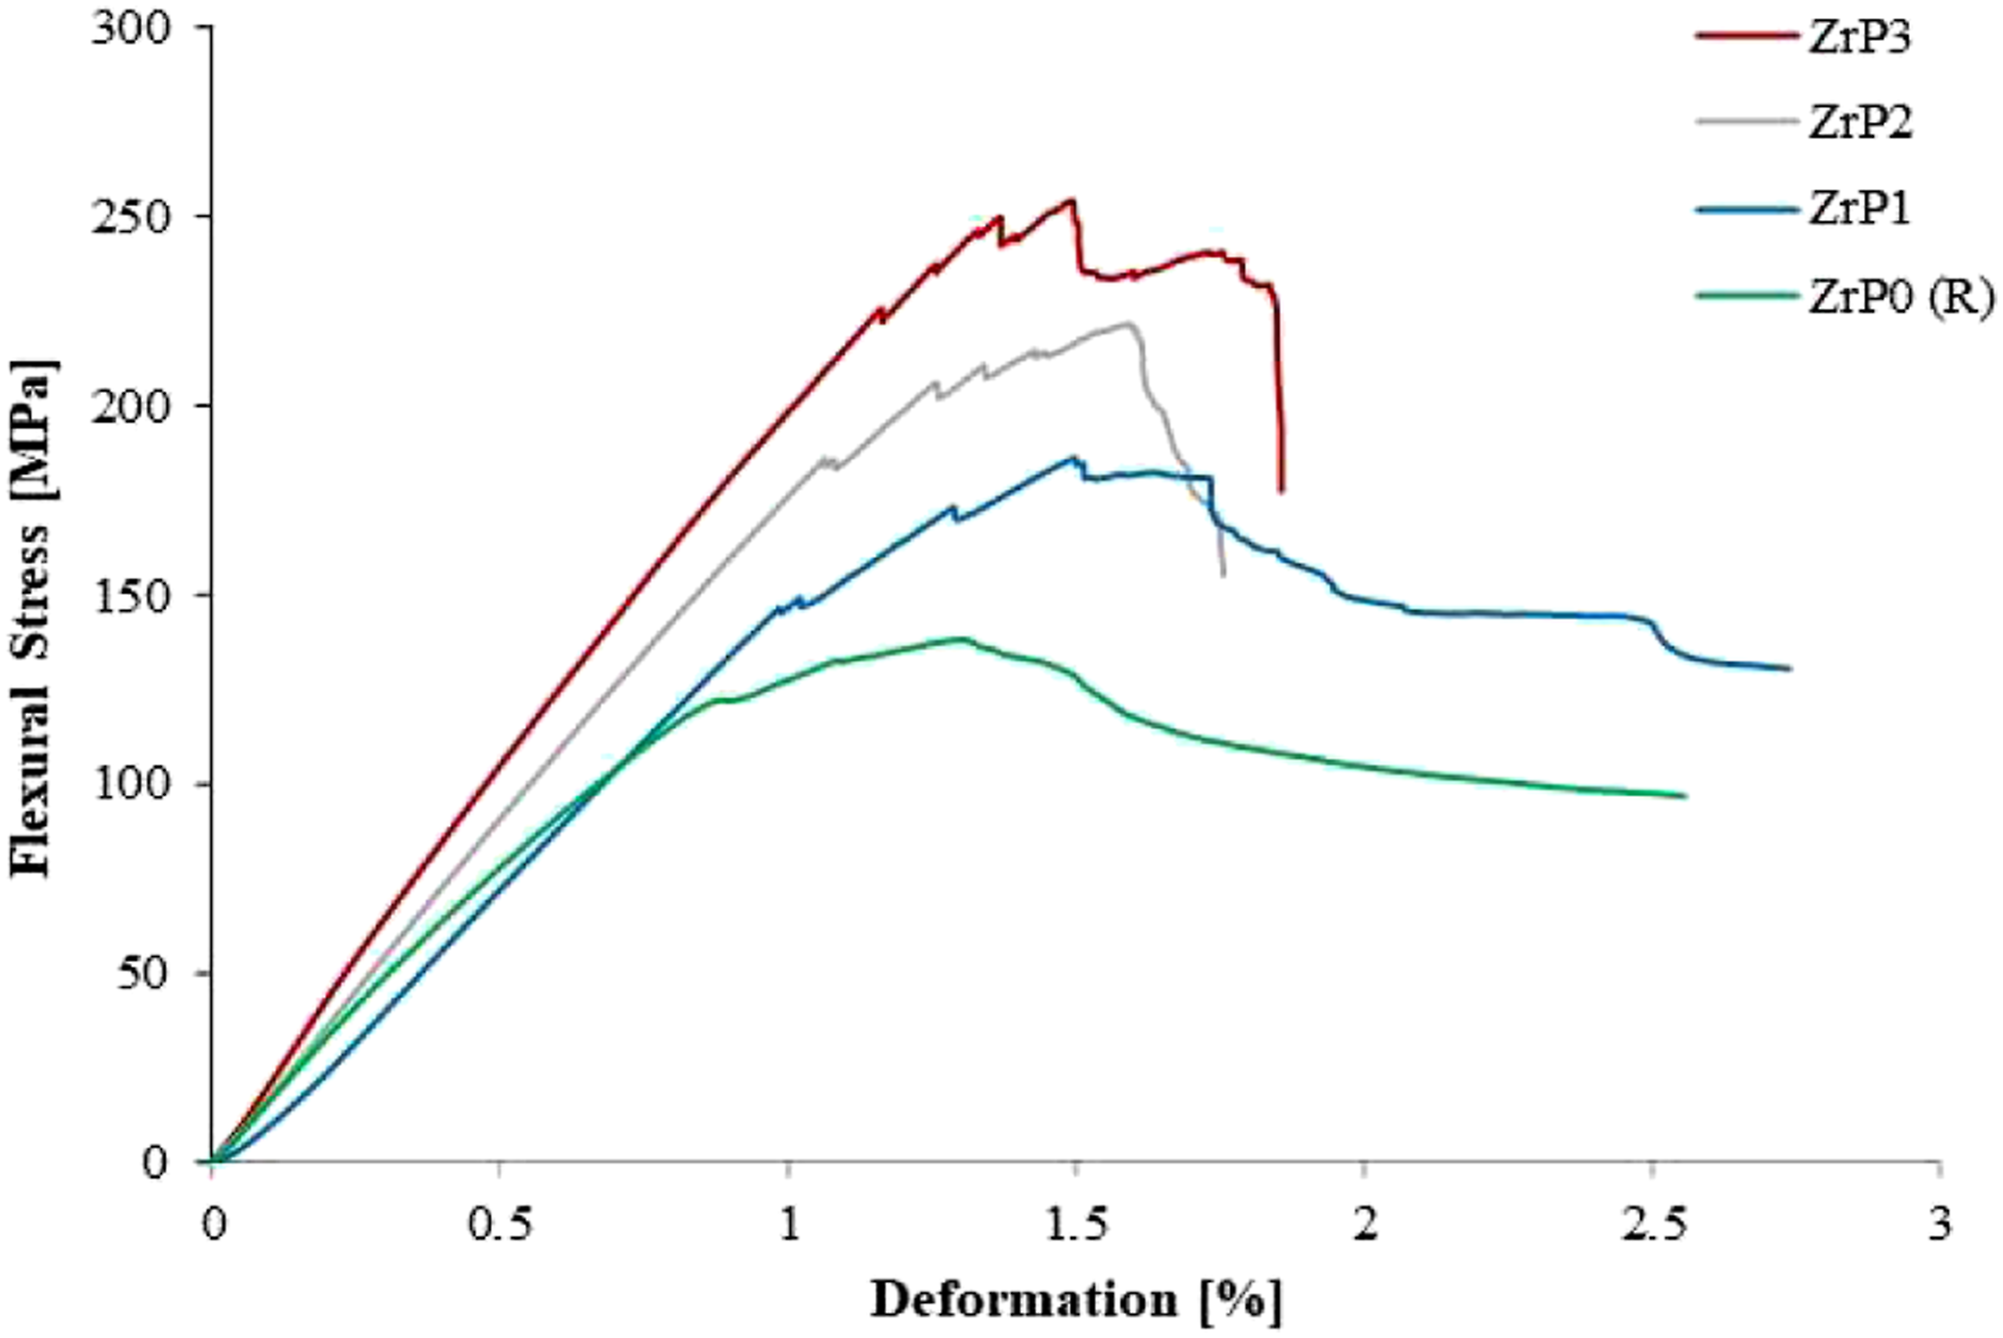
Flexural testing results of ZrP-loaded composites.

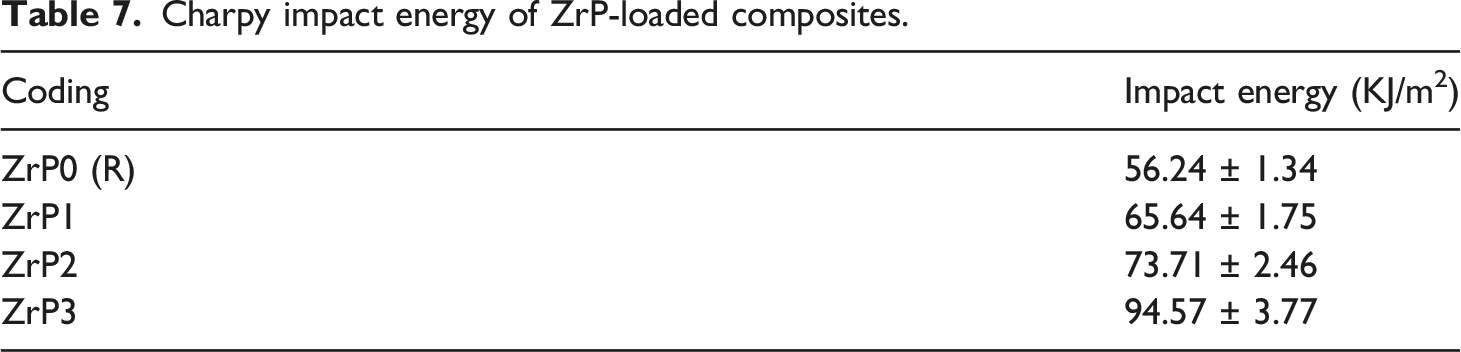
Impact testing (Charpy)
Force versus displacement, force versus test time, and work versus displacement curves of ZrP-loaded glass/epoxy composites are shown in Figure 3(a)–3(c) respectively. Maximum force value was observed in 15% ZrP-loaded glass/epoxy composite followed by the 10%, 5% ZrP-loaded composites and least value of force was observed in composite without ZrP.
Charpy impact energy of ZrP-loaded composites.
Short beam shear (SBS) testing
The effect of addition of ZrP particles in the glass/epoxy composites on short beam shear stress is shown in Figure 4. SBS stress was increased with the rise of ZrP percentage. The highest SBS stress was observed with the 15% ZrP loadings followed by 10%, 5% ZrP loadings and least value of SBS stress was observed in reference sample. (a) Force versus displacement, (b) Force versus test time, and (c) work versus displacement curves of ZrP-loaded composites. Short beam shear stress versus deformation curves of ZrP-loaded composites.

Short beam shear testing results of ZrP-loaded composites.

Design of experiment 2
In the 2nd section, different mechanical tests (tensile, flexural, Charpy impact, and short beam shear) and antibacterial activity of glass/epoxy composites loaded with ZnO particles were performed and compared.
Tensile testing
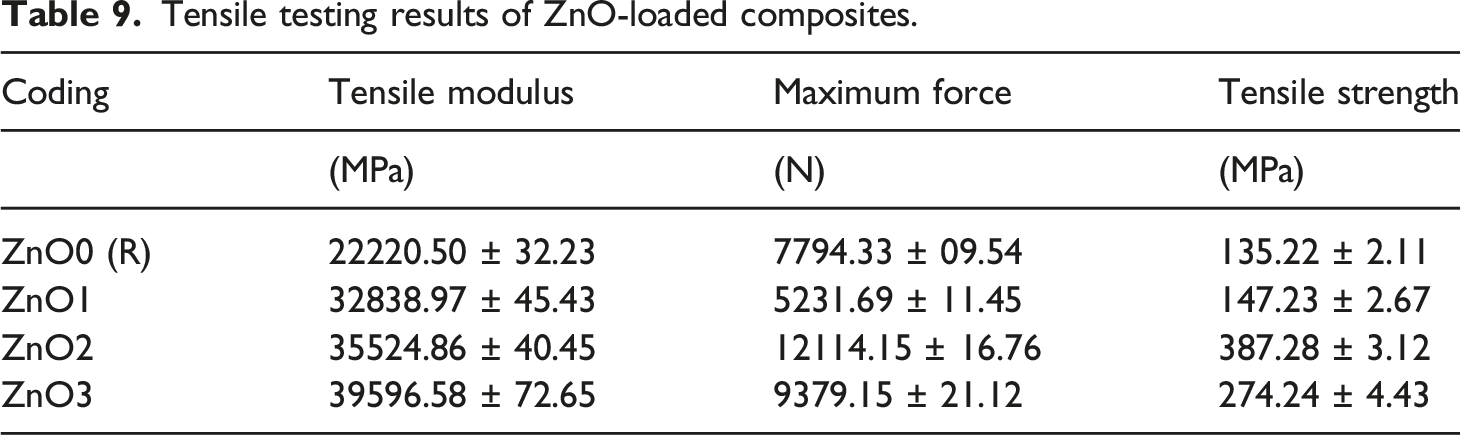
The effect of ZnO particles on the tensile stress of glass/epoxy composites is shown in Figure 5 which showed the tensile stress versus extension curves of composite samples. The tensile stress of composites was increased by increasing the ZnO percentage in the epoxy resin.
39
Figure 5 showed that the highest percentage (1.5%) of ZnO gave the highest tensile stress followed by 1% and 0.5% ZnO loadings and the least value was showed by reference sample. Because the addition of ZnO particles improves the load distribution and fiber-matrix interface in the composites, that enhanced the tensile properties. Also, curves showed that stiffness of composites was also improved with the rise of ZnO percentage. Tensile stress versus extension curves of ZnO-loaded glass/epoxy composites.
Tensile testing results of ZnO-loaded composites.
Flexural testing (3-point)
The impact of ZnO particles on the flexural stress of glass/epoxy composite is shown in Figure 6, which showed the flexural stress versus deformation curves of composites. It is evident that flexural stress was increased with the increase in ZnO percentage from zero to 1.5%. The highest value of flexural stress was observed in 1.5% ZnO concentration followed by 1% and 0.5%, and least value was showed by reference sample. Also, curves showed that stiffness of composites was also increased with the increase of ZnO percentage in composites. A similar increasing trend of flexural strength and modulus was increased with the increase of ZnO percentage
40
as given in Table 10. Flexural strength and modulus were increased to 37% and 34%, respectively, with the increase in ZnO percentage from zero to 1.5%. Flexural stress versus deformation of ZnO-loaded composites. Flexural testing results of ZnO-loaded composites.

Impact testing (Charpy)
Force versus displacement, force versus test time, and work versus displacement curves of ZnO-loaded glass/epoxy composites are shown in Figures 7(a)–(c), respectively. It is evident that maximum force values were increased with the increase of ZnO percentage. The highest value of force was observed in 1.5% ZrP-loaded composites, followed by 1% and 0.5% ZrP loadings and the least value of force was observed in reference composite sample. A similar increasing trend of force with test time was observed in Figure 7(b). Figure 7(c) curves displayed the efficacy of adding ZnO particles in the composites. Both stiffness and energy absorption were increased with the increase in ZnO percentage. The work done curves showed that resistance to crack was increased with the rise of ZnO percentage showing more steeper curves, while for reference sample curve was less steep. (a) Force versus displacement, (b) Force versus test time, and (c) Work versus displacement curves of ZnO-loaded composites.
Charpy impact energy of ZnO-loaded composites.

Short beam shear (SBS) testing
The impact of ZnO particles on the SBS stress of glass/epoxy composite is shown in Figure 8, which showed the SBS stress versus deformation curves of composites. The highest SSB value of stress was observed with the 1.5% ZnO loadings followed by 1%, 0.5% ZrP loadings and least value of SBS stress was observed in reference sample. Table 12 highlighted the maximum force and SBS strength values of ZnO-loaded composites, both values were increased with the increase in ZnO percentage. The highest values were showed by the 1.5% ZnO-loaded composites and least values were showed by reference composite sample. Maximum force and SBS strength values were increased to 61% and 48%, respectively, with the rise of ZnO percentage from zero to 1.5%. Short beam shear stress versus deformation curves of ZnO-loaded composites. Short beam shear testing results of ZnO-loaded composites.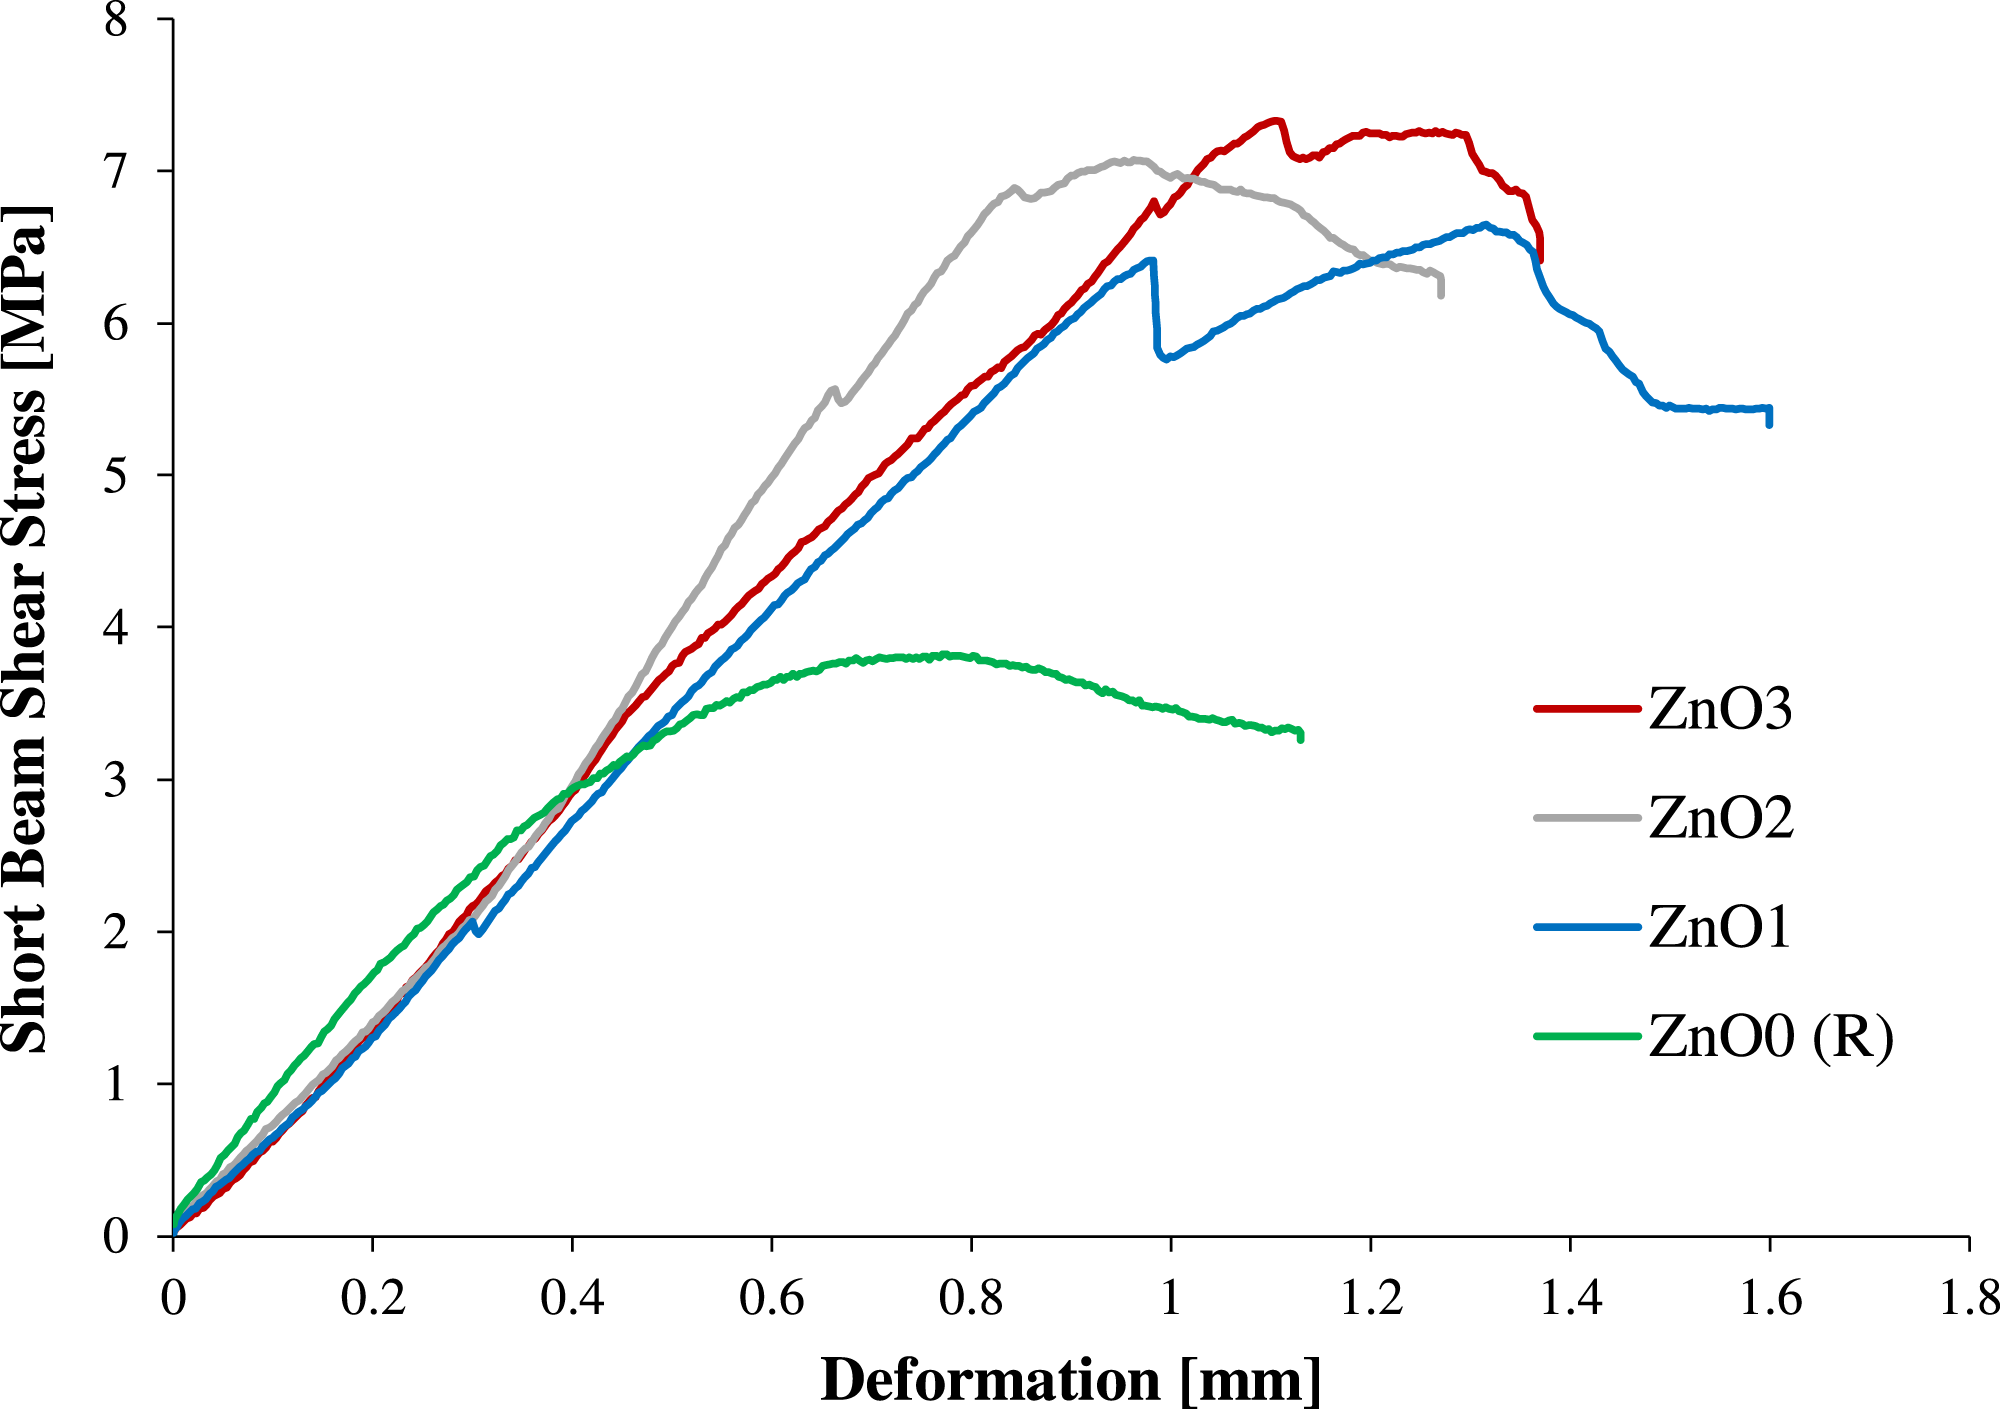

Antibacterial activity
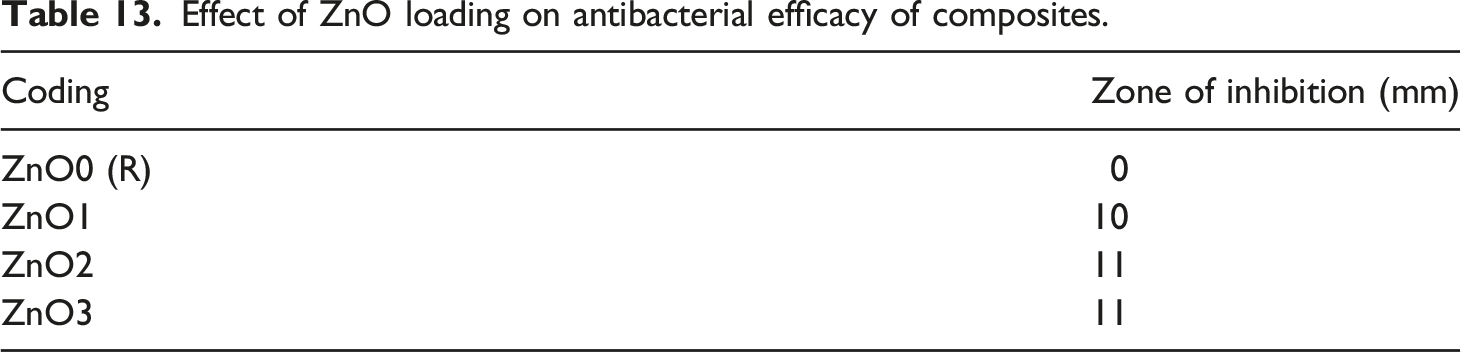
Effect of ZnO loading on antibacterial efficacy of composites.
Optimization with hybridization (DOE 3)
In the 3rd section, optimized percentages of ZrP and ZnO achieved from DOE 1 and DOE 2, respectively, were mixed in the epoxy resin, and glass, carbon, and two (02) hybrid (glass and carbon) epoxy-based composites were prepared. Flame retardancy, mechanical tests (tensile, flexural, harpy impact, and short beam shear), and antibacterial activity were performed of these composites.
Horizontal and vertical flame retardancy (FR)
Flame retardancy testing results for ZrP and ZnO-loaded composites.
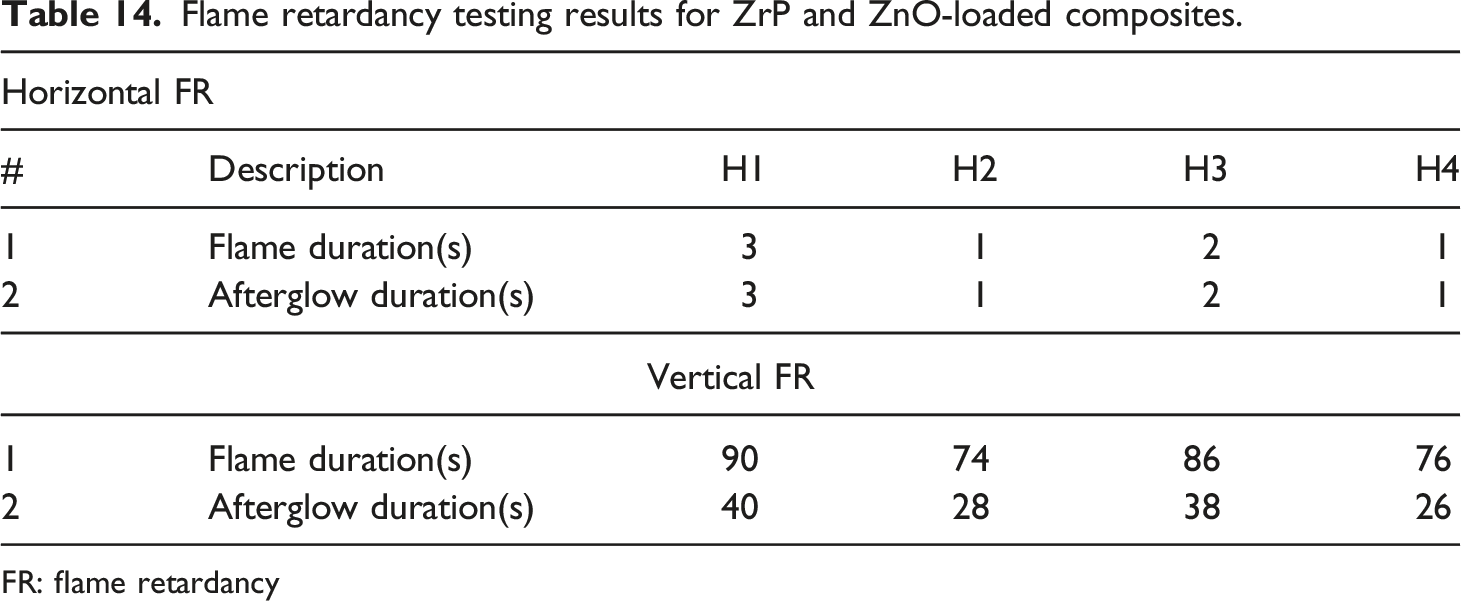
FR: flame retardancy
Tensile testing
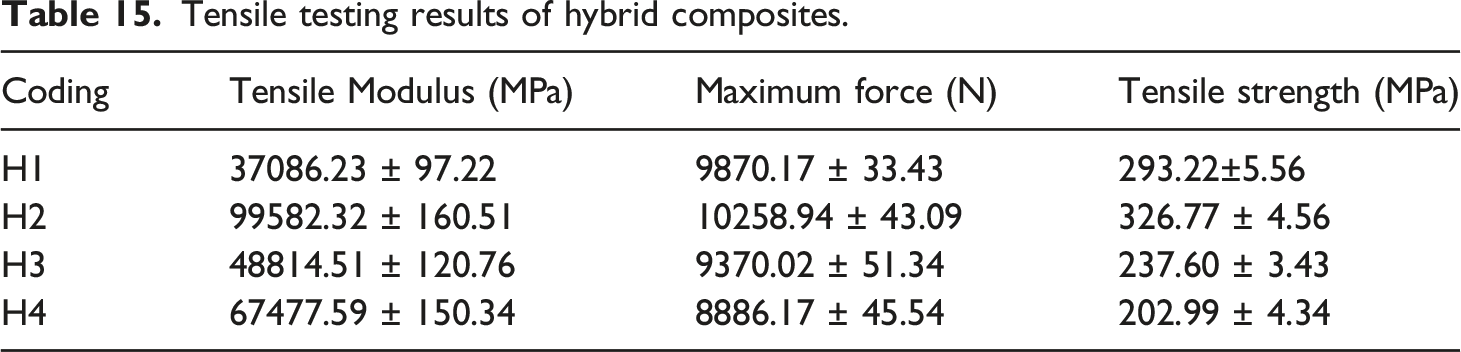
Figure 9 showed the tensile stress versus extension %age curves with optimized percentages of ZrP (15%) and ZnO (1.5%) particles of glass(H1), carbon(H2), and glass-carbon(H3) and carbon-glass(H4) hybrid composites. The trend of increase in the tensile stress is mainly due to the carbon and glass reinforcements. Furthermore, ZnO particles improve the interfacial bonding between matrix and reinforcements, and ZrP particles enhance the matrix strength by forming a microcluster in structure. The combined result of both particles helped in improving the tensile properties of the hybrid composites. The hybrid composite H2 showed the highest tensile stress because it has four layers of carbon reinforcements. Carbon fiber is a strong manmade fiber due to its higher mechanical strength. Carbon fiber helped in bearing the initial load and enhanced tensile properties of H2 hybrid composite.
43
H1 composite showed the 2nd highest peak of tensile stress due to presence of four layers of glass reinforcement. While H3 and H4 containing two, two plies of carbon and glass reinforcements showed the least values of tensile stress. Within H3 and H4 composite, H3 showed better tensile stress values as compared to the H4 composite sample. With the increase of carbon layers, the stiffness of the composite was also increased as shown in Figure 9. H2 curve indicated the highest steep behavior as compared with the other composite curves. Tensile stress versus extension (%) curves of hybrid composites.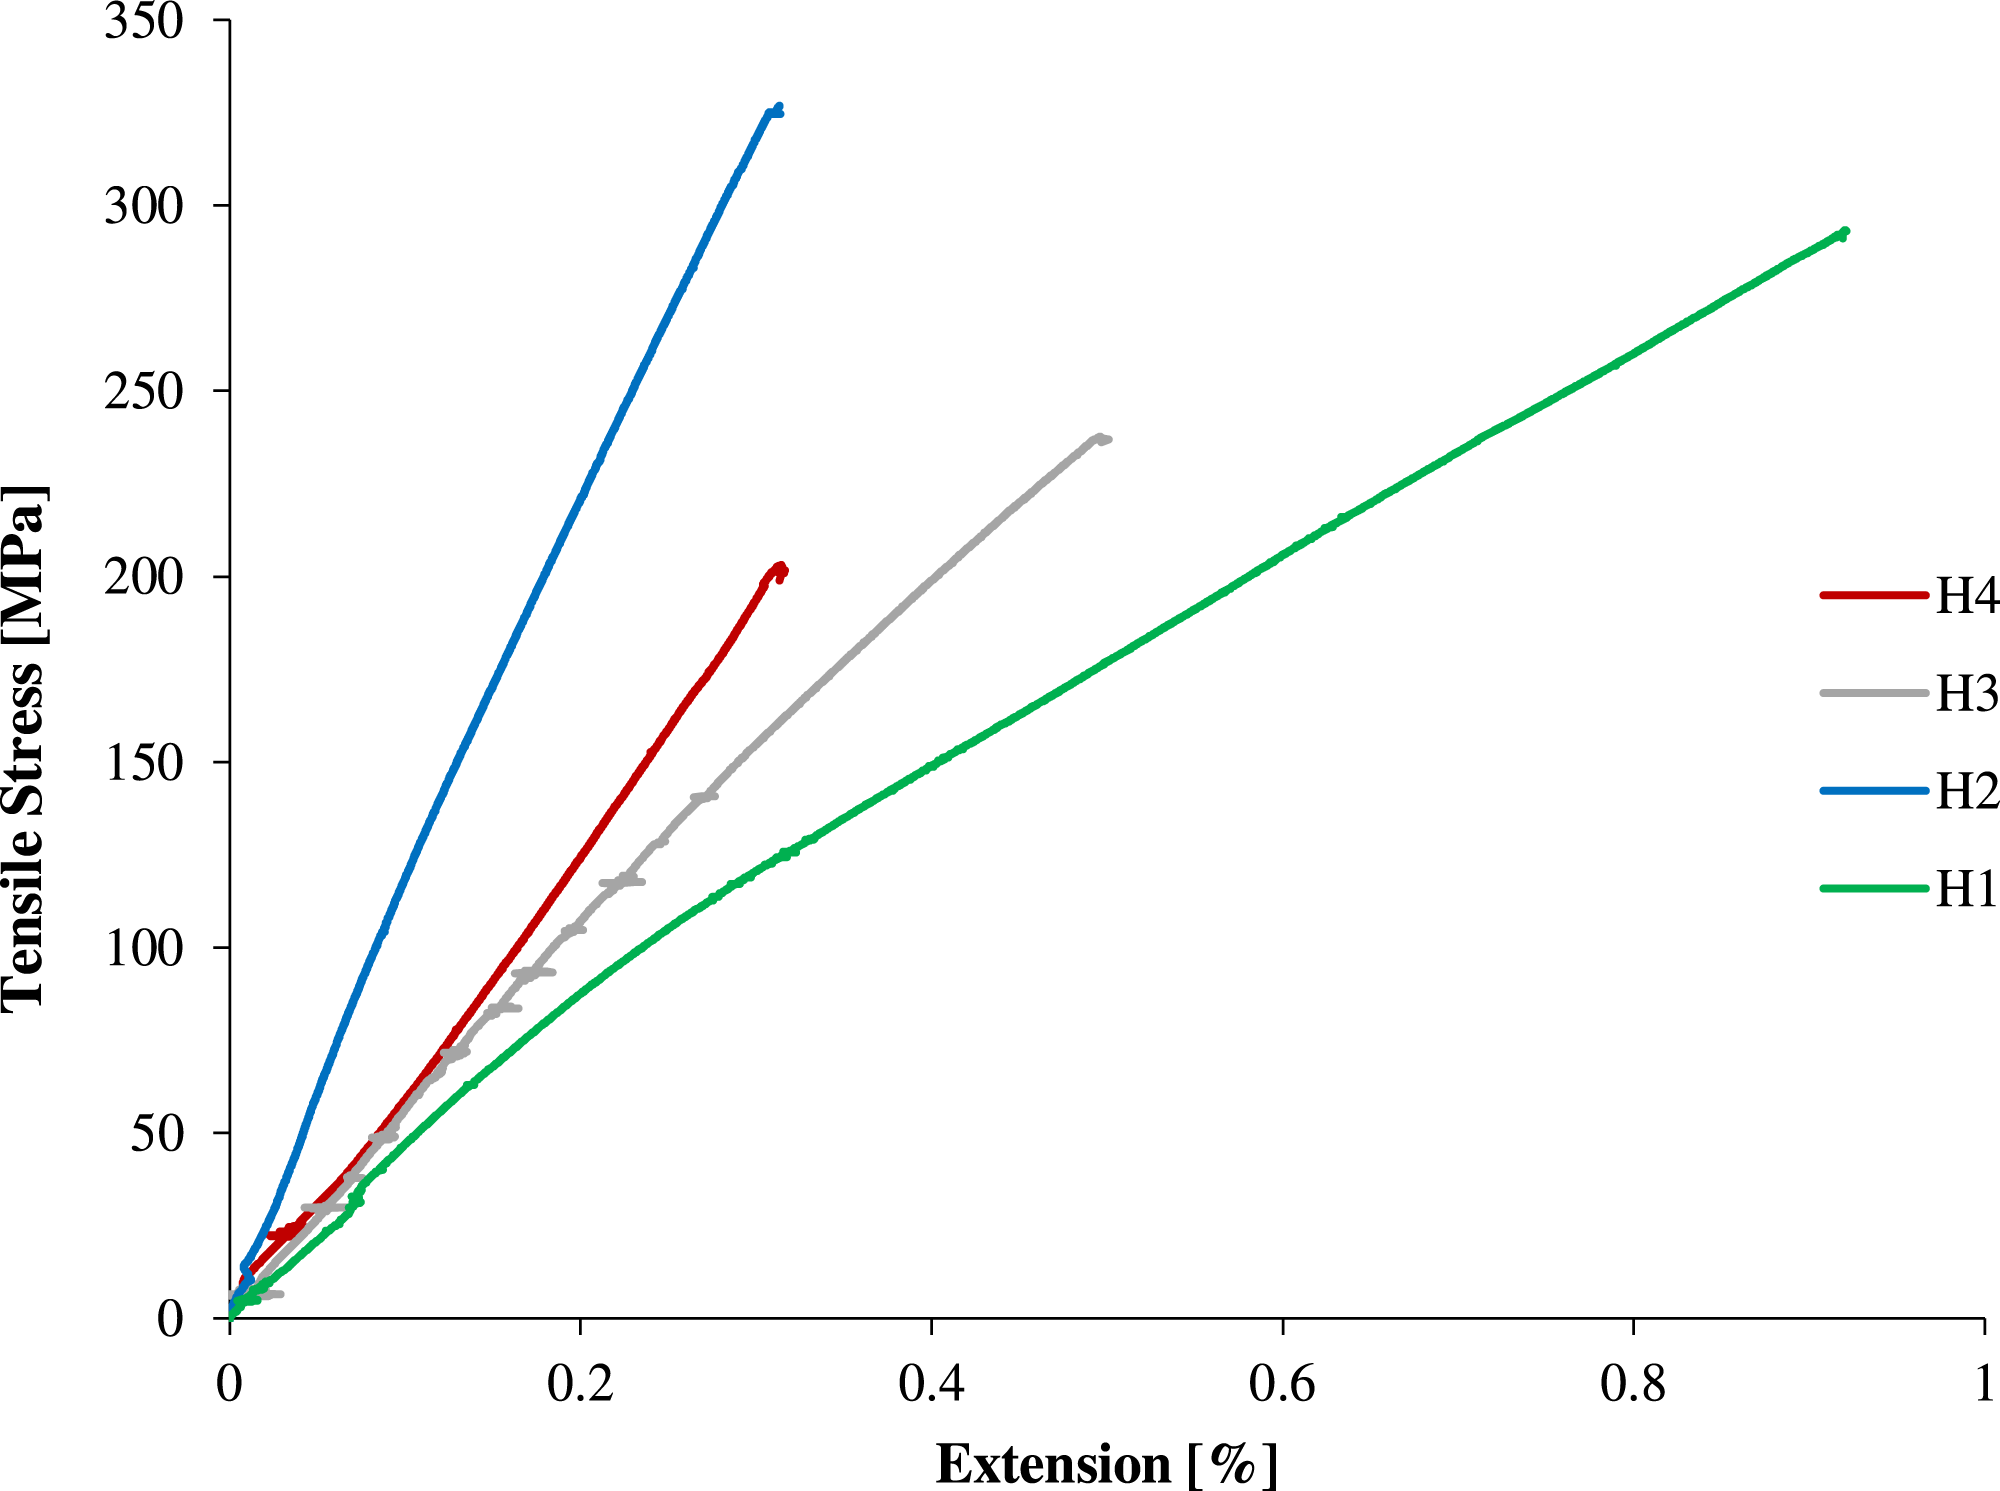
Tensile testing results of hybrid composites.
Flexural testing (3-point)
Figure 10 showed the flexural stress versus deformation %age curves having optimized percentages of ZrP (15%) and ZnO (1.5%) particles of glass(H1), carbon(H2), and glass-carbon(H3) and carbon-glass(H4) hybrid composites. The trend of increase in the flexural stress mainly depends on the carbon and glass reinforcements. The ZnO and ZrP particles improved the interfacial bonding between matrix and fibers, and matrix strength is enhanced by forming a microcluster. The hybrid composite H2 showed the highest value of flexural stress followed by H4, H3, and H1, respectively. H2 hybrid composite gave higher flexural stress because of carbon layers. The carbon is a strong manmade fiber due to its higher mechanical strength it helped in bearing the initial load and maximum force on deformation and enhanced flexural properties. Flexural stress versus deformation curves of hybrid composites.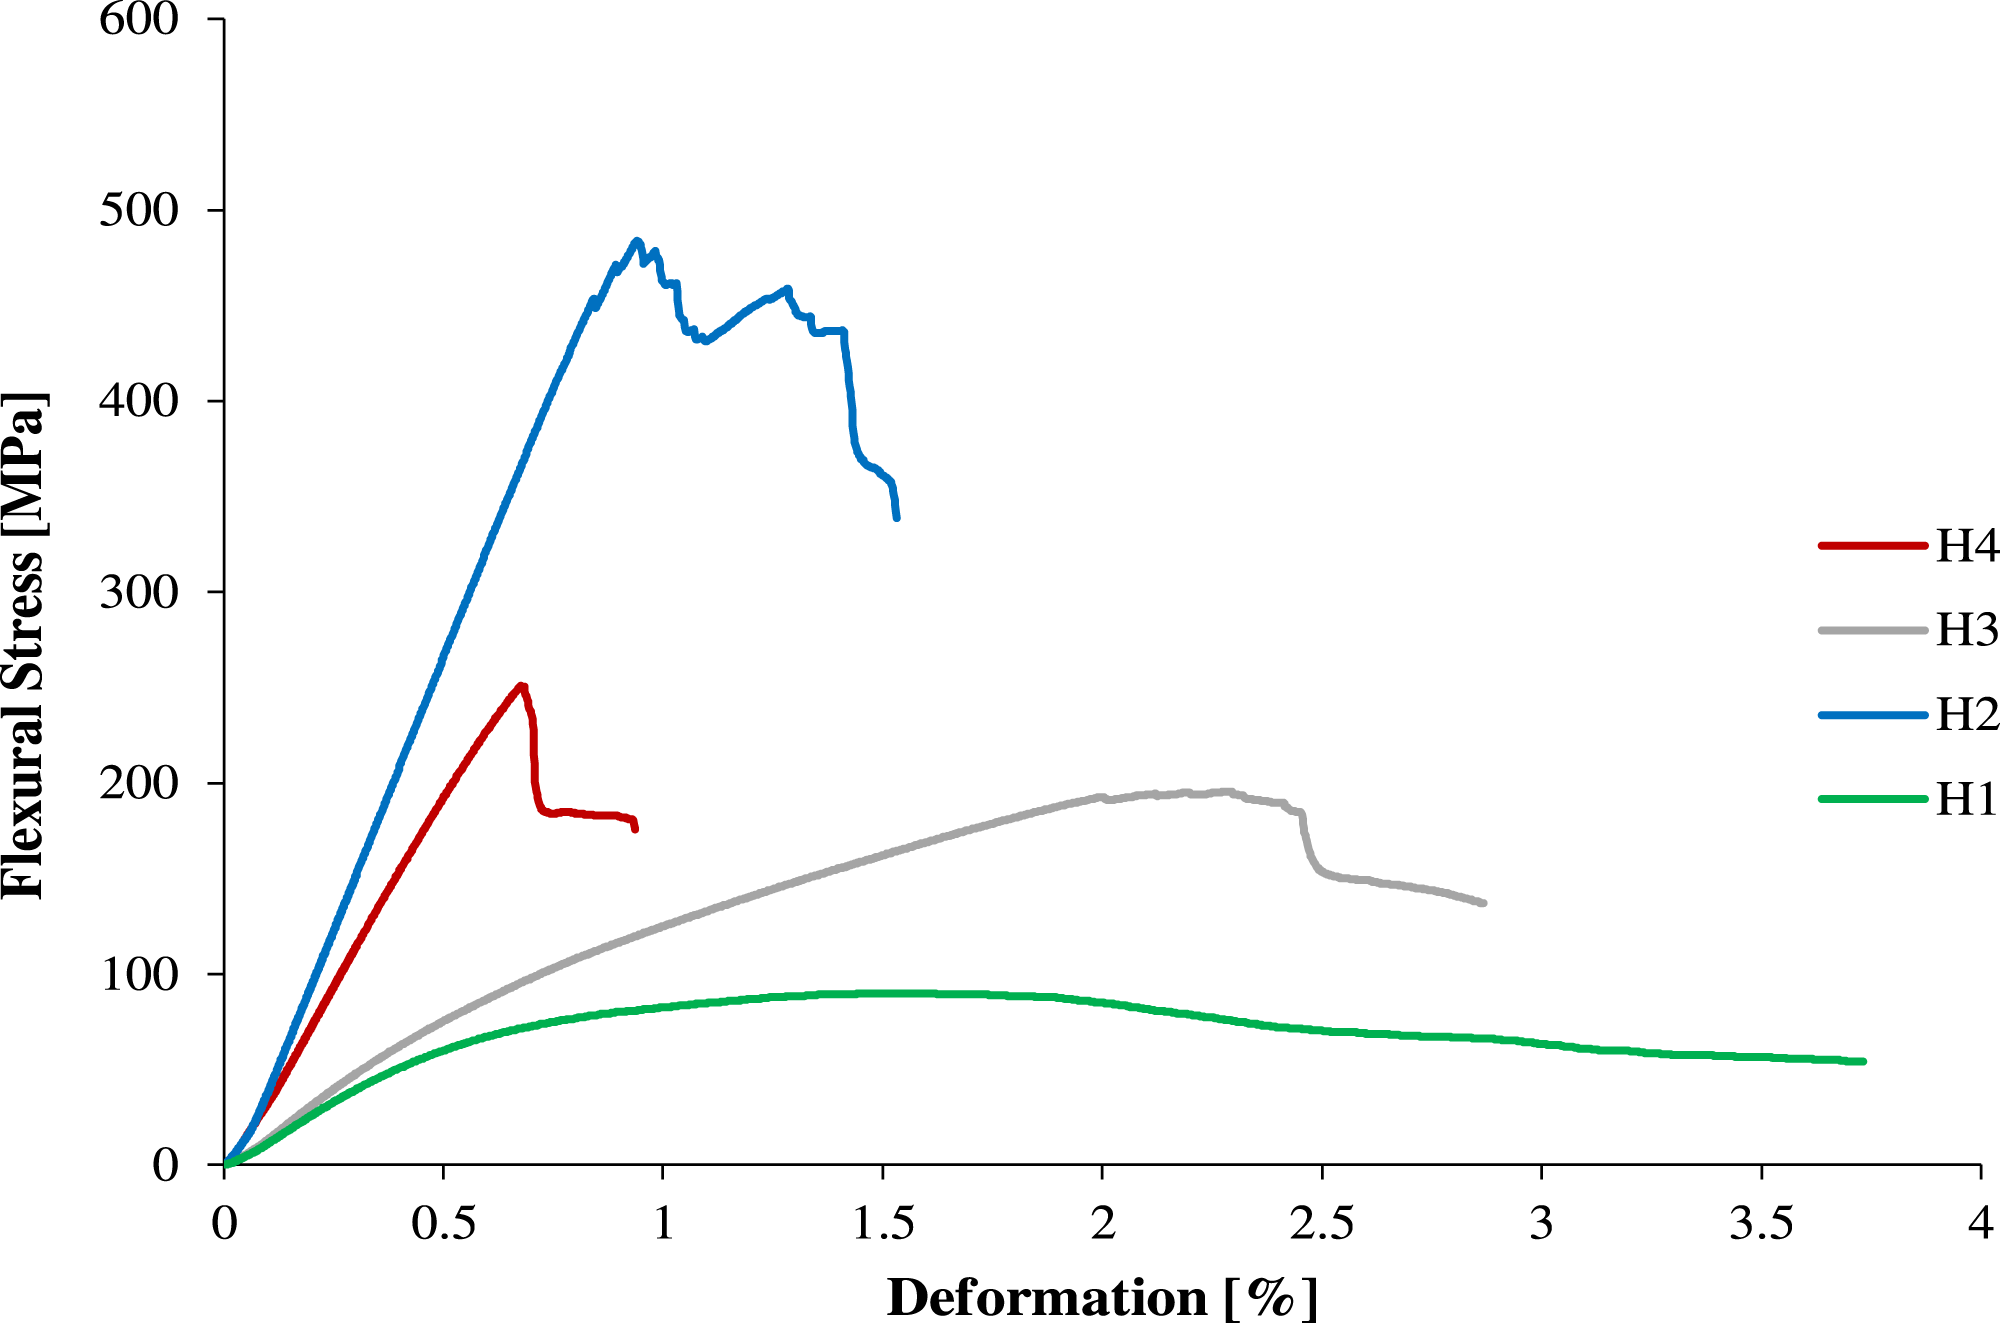
Flexural testing results of hybrid composites.

Impact testing (Charpy)
Force versus displacement, force versus test time, and work versus displacement curves of H1, H2, H3, and H4 composites are presented in Figures 11(a)–(c), respectively. Since percentages of ZnO and ZrP particles were same in all hybrid composites, so the maximum force and work done values depend upon the type of reinforcement in the composites. Figure 11(a) showed that hybrid composite H3 exhibited the uppermost value of maximum force followed by H2, H4, and H1, respectively. Carbon fiber has higher stiffness as compared to the glass fiber. A similar increasing or decreasing of maximum force versus time was observed in Figure 11(b). Figure 11(c) indicated the work done versus displacement behavior of hybrid composites during Charpy impact. The curves clearly showed the efficacy of glass and carbon reinforcements. Work done behavior was altered with the change of glass, carbon, and hybrid stacking of both reinforcements. H3 presented the greatest value of work done followed by H1, H4, and H2 samples, respectively. (a) Force versus displacement, (b) force versus test time, and (c) work versus displacement curves of hybrid composites.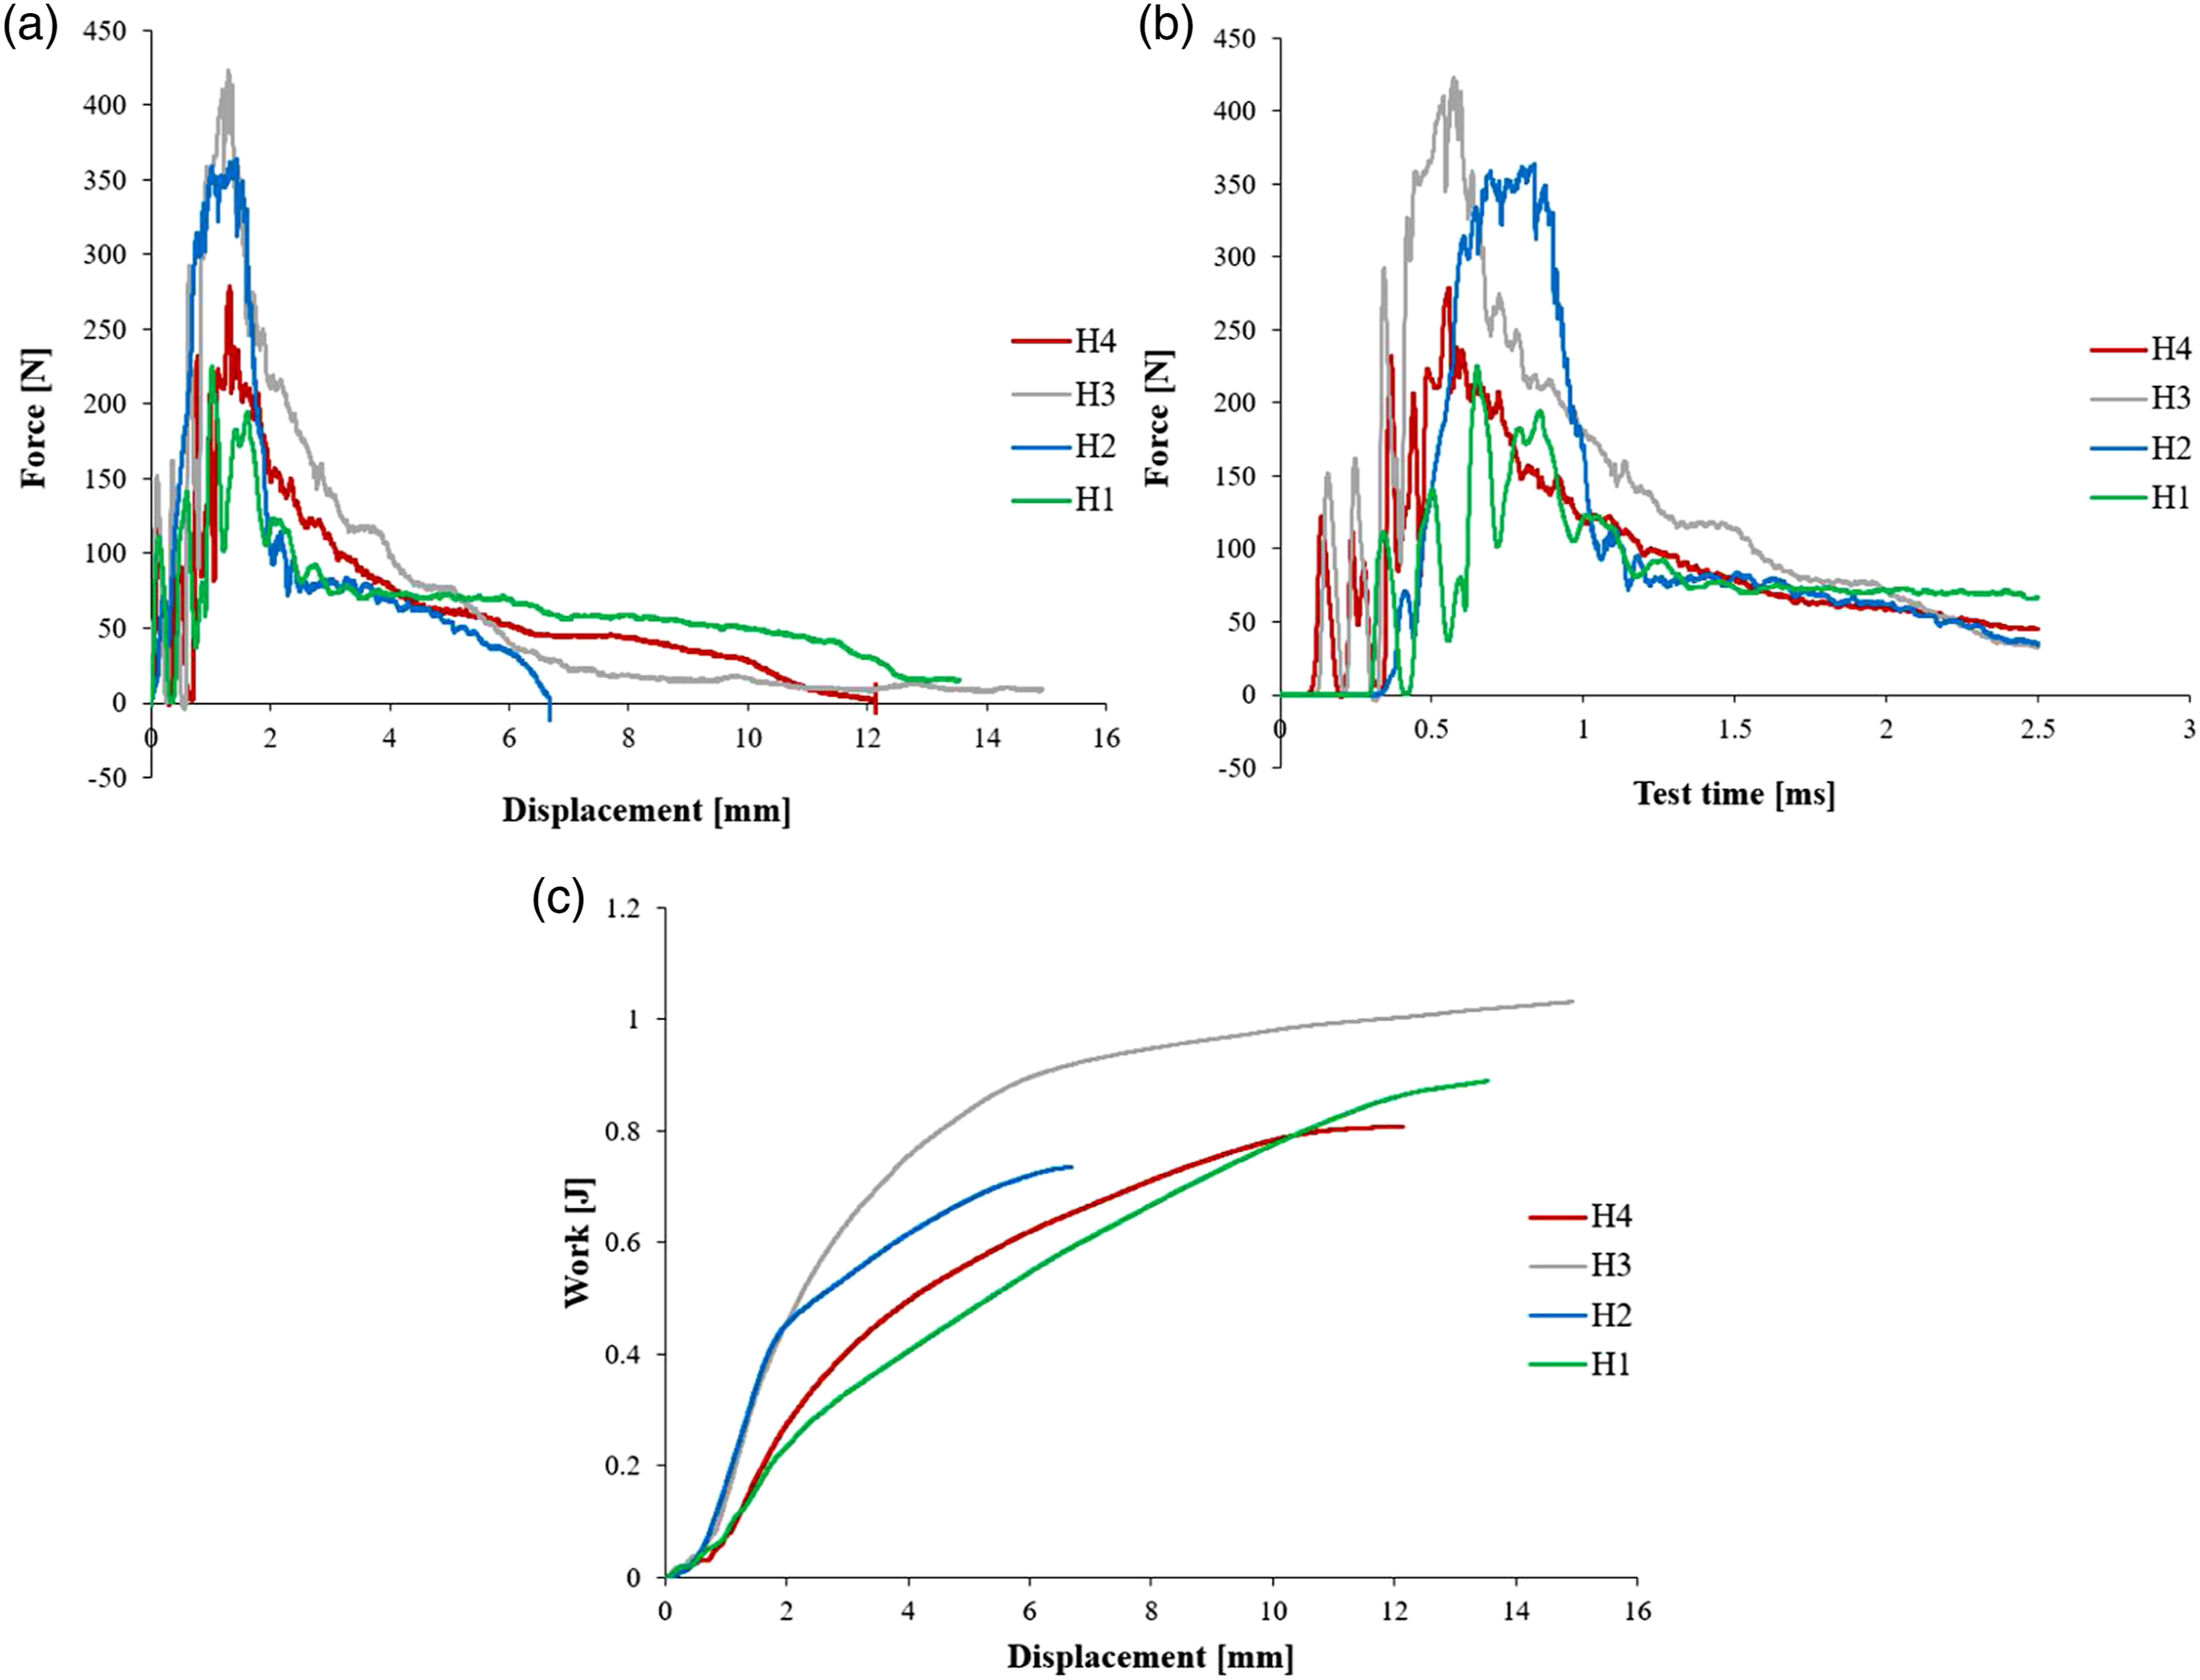
Charpy impact energy of hybrid composites.


Microscopic analysis of composites after Charpy impact test.
Short beam shear (SBS) testing
SBS stress of hybrid composite is shown in Figure 13. H2 composite showed the uppermost value of SBS stress followed by H4, H3, and H1, respectively. The rise in the SBS stress mainly depends upon the types of reinforcement and their stacking sequence. H2 composite had four layers of carbon reinforcements. Carbon is a strong manmade fiber due to its higher stiffness. It bears the initial load and maximum force on deformation and enhanced SBS properties of H2 hybrid composite. H4(CGGC) and H3(GCCG) hybrid samples displayed intermediate values of SBS stress due to the presence of two layers of carbon and two layers of glass reinforcements in different stacking pattern. H2(CCCC) composite demonstrated the greatest value of SBS stress and the least value was exhibited by H1(GGGG). Table 18 showed the maximum force and SBS strength values of composites. Similar increasing trend of maximum force and SBS strength was also observed. H2 sample revealed the greatest values of maximum force and SBS strength followed by H4, H3, and H1 samples, respectively. Short beam shear stress versus deformation curves of hybrid composites. SBS testing results of hybrid composites.

Antibacterial activity
Zone of inhibition of different hybrid composites.

Conclusions
In the 1st section, different percentages (5%, 10%, and 15%) of ZrP particles were mixed in epoxy resin and their corresponding woven glass/epoxy composites were fabricated. The composite containing 15% ZrP particles showed the highest horizontal and vertical flame retardancy, that is, lowest values of flame and afterglow durations, and mechanical (tensile, Charpy impact, flexural, and short beam shear) properties followed by 10% and 5% ZrP particle composites, respectively. The least values of flame retardancy and mechanical properties were observed in reference composite without ZrP particles.
In the 2nd section, different percentages (0.5%, 1%, and 1.5%) of ZnO particles were mixed in epoxy resin and woven glass/epoxy composites were made. The composite containing 1.5% ZnO particles showed the highest mechanical (tensile, Charpy impact, flexural, and short beam shear) properties followed by 1%, 0.5% ZnO particle-loaded composites, respectively. Antibacterial activity, that is, clear zone of inhibition, was same with three different percentages (0.5%, 1%, and 1.5%) of ZnO particles. The least values of mechanical properties were observed in the reference composite without ZnO particles with poor antibacterial activity. 1.5% ZnO particles concentration was selected from this section having the highest mechanical properties and better antibacterial activity.
In the 3rd section, glass(H1), carbon(H2), glass-carbon(H3), and carbon-glass(H4) hybrid composites were fabricated with epoxy resin containing optimized percentages of ZrP (15%) and ZnO (1.5%) particles. H2 composite showed the better mechanical properties as compared to the H4, H3, and H1 hybrid composite samples, due to presence of four layers of high modulus carbon reinforcement. All composite samples showed better antibacterial activity and samples containing four layers of carbon or having carbon on outer sides of composite showed better flame retardant properties.
Footnotes
Acknowledgements
The authores are thankful to the lab staff of National Center for Composite Materials at National Textile University, Faisalabad-Pakistan
Declaration of conflicting interests
The author(s) declared no potential conflicts of interest with respect to the research, authorship, and/or publication of this article.
Funding
The author(s) disclosed receipt of the following financial support for the research, authorship, and/or publication of this article: The authors are thankful to the Higher Education Commission of Pakistan for funding this research work under Technology Development Fund (TDF03-112).