
Abstract
The functional properties and applications of graphene coated textiles depend on the magnitude of graphene add-on which in turn is influenced by the type of substrate and the dipping conditions. In the present study, optimized GO (graphene oxide) dipping conditions are identified for the preparation of cost-effective and scalable rGO (reduced graphene oxide) coated cotton nonwoven for electroconductive and UV (ultraviolet) blocking applications. To understand the influence of GO dipping variables on rGO add-on and electrical resistivity of cotton, batch adsorption studies are carried out in loose fibre form to eliminate the structural influence of yarn or fabric. Batch adsorption studies suggest that GO concentration, pH of GO solution and sodium dithionite (reductant) concentration are the most influencing dipping variables and these dipping variables are optimized for cotton nonwoven fabric using Box–Behnken response surface design to achieve minimum surface resistivity. The rGO coated cotton nonwoven fabric shows excellent UV blocking properties (UV protection factor = 89.38) at the optimized GO dipping conditions. Physical properties of cotton nonwoven fabric such as GSM, thickness, stiffness, breaking strength and elongation are analysed at different dipping cycles. After the rGO coating, bending rigidity, bending modulus and breaking elongation of the cotton nonwoven fabric decrease, whereas the breaking strength increases. rGO coated cotton fabric exhibits excellent stability towards multiple washing and rubbing. The graphene coated cotton is characterised by FT-IR, XRD, Raman, TGA, FESEM and LEICA image analyser.
Keywords
Introduction
Electrically conductive textile (E-textile) have attracted great interest in recent years due to its vast applications in wearable electronic devices, health and activity monitoring devices, energy reservoir etc.[1]. Various conductive materials are used to impart electric conduction in insulating textile media such as metals, conjugated polymers and carbon-based conductive material (carbon nanotubes and graphene). Graphene-based electroconductive textiles are advantageous over other existing alternatives due to their strength, lightweight, uniform coating, flexibility, stability and process-ability [2,3].
UV protection finishes are applied to textile material in order to protect people and textile material from excessive UV radiation exposure. UV protection properties of textile material can be enhanced by designing fabric structures and coating with UV blockers. Use of graphene is also reported to enhance the UV protection properties of textiles. UV protection factor (UPF) of untreated cotton woven fabric was increased from 13.5 to 54.1 after five coatings of GO spray [4]. UV protection factor of cotton and linen woven fabrics considerably improved to 86.5 and 83.3 after the deposition of rGO and Ag nanoparticles [5]. The GO/polymeric N-halamine treated cotton fabric displayed UV protection factor of 97, which was raised to 187 after reduction with
The functional properties of rGO coated textile substrate depend on the level of rGO add-on. The level of rGO add-on is influenced by the fibre type, structural parameters of the substrate and also by the GO dipping variables such as GO concentration, pH of GO solution, dipping temperature, dipping time and reductant concentration [9]. Most of the earlier reported work selected arbitrary GO dipping conditions to prepare graphene enriched cotton. Limited information is available regarding the effect of GO dipping variables and fabric or yarn structure variables on electrical resistivity. Chatterjee and co-authors studied the effect of GO concentration and dipping cycles on the surface resistivity of cotton woven and knitted fabrics [10]. Shateri-Khalilabad and Yazdanshenas studied the influence of different types of reductants and reducing conditions on surface resistance of the cotton fabric and suggested sodium dithionite as a reductant [9]. However, the most influencing dipping variables and their optimum range are not reported for GO coating on cotton. Moreover, no attempt has been made to optimize the GO dipping variables with reference to electrical resistivity, cost and potential environmental damage.
Most of the researchers used woven and knitted forms of fabric structures for the development of graphene coated textiles to target electroconductive and UV blocking applications[11–14]. However, woven and knitted forms of fabric structures suffer from poor rGO add-on and require a large number of repetitive dipping to achieve a substantial amount of add-on for a particular functional application. Due to its highly porous structure, the nonwoven fabric could be a better alternative to achieve an adequate level of rGO add-on with less dipping cycles [15].
It is already reported that cotton is the most suitable fibre in terms of the rGO add-on and electrical resistivity out of the common textile fibres such as cotton, viscose, silk, wool, nylon, polyester and acrylic [16]. Therefore, cotton fibre is used to prepare needle-punched nonwoven fabric for electroconductive and UV protection applications. In this work, rGO enriched cotton is prepared by dipping method and sodium dithionite (Na2S2O4) is used as a reducing agent [9].
Based on the above observations, in this work, batch adsorption studies are carried out on cotton fibre to identify the most influencing GO dipping variables and their range on the basis of rGO add-on and volume resistivity. On the basis of the identified range of the most influencing GO dipping variables, optimized cotton nonwoven fabric is prepared by using the Box–Behnken response surface design for electroconductive and UV protection applications. The electrical, UV protection and physical properties of the prepared rGO coated cotton nonwoven fabric are analysed. The wash and rubbing fastness of the prepared samples are also analysed.
Experimental
Materials
Graphite powder (−325 mesh, 99%) is obtained from Alfa Aesar, England. Sulphuric acid (H2SO4, 98%), potassium permanganate (KMnO4), sodium dithionite (Na2S2O4), phosphoric acid (H3PO4), hydrochloric acid (HCl, 37%), hydrogen peroxide (H2O2, 30%) and ethanol (C2H5OH) are procured from S D Fine Chem Limited, India. All these chemicals are analytical grade and used as received. The J-34 cotton fibre (4.7 micronaire and 28 mM length) is used for both the batch adsorption study and the nonwoven fabric preparation. Needle-punched nonwoven fabric of 102.60 ± 4.28 g m−2 GSM, 150 punch cm−2 punch density and 13 mM depth of penetration is manufactured on DILO (Germany) needle punching machine by carding, cross lapping and mechanical bonding.
Methods
Preparation of graphene oxide
Graphene oxide is prepared by the improved hummers’ method [17]. In this method, 3.0 g graphite powder is added to a mixture of concentrated H2SO4:H3PO4 (360:40 mL). In this mixture, KMnO4 (18.0 g) is gradually added in 6 equal parts. The addition of KMnO4 raises reaction temperature up to 40°C and then reaction temperature is further raised to 50°C by external heating and stirred for 12 h. Then the reaction mixture is cooled to room temperature and poured onto ice (400 mL) along with 30% H2O2 (3 mL). After cooling the reaction bath to room temperature, the mixture is purified by filtration, multiple washing (5% HCl, ethanol and deionized water) and centrifugation, until the attainment of pH 7.
Batch adsorption study of GO on cotton fibre
Batch adsorption experiments are carried out on cotton fibre to identify the most influencing GO dipping variables (GO concentration, pH of GO solution, dipping temperature and dipping time) and their range on the basis of rGO add-on and volume resistivity. The influence of GO dipping variables is analysed by varying one dipping variable at a time while keeping the rest of the GO dipping variables constant (which are mentioned in the parenthesis).
The pH of GO solution is varied from 2 to 7 (0.6% GO concentration, 70°C and 10 min); GO concentration is varied from 0.2% to 1.4% (4 pH, 70°C and 10 min); dipping temperature is varied from 30°C to 70°C (4 pH, 1.2% GO and 10 min) and dipping time is varied from 2 min to 10 min (4 pH, 1.2% GO and 70°C).
For each experiment, 5 g of cotton fibre is dipped in 200 mL of GO aqueous solution having a particular condition as mentioned above and dried. The treated GO coated cotton fibres are subsequently reduced with 50 m
Due to inadequate GO reduction at the low concentrations of Na2S2O4, the volume resistivity of rGO coated cotton fibres was extremely high and could not be measured in the existing setup. Therefore, the effect of reductant concentration on cotton is studied on nonwoven fabric where surface resistivity can be measured. The concentration of Na2S2O4 is varied from 5 m
Each experiment is repeated three times and their mean values are reported. Standard deviation is plotted in the error bar. Statistical significance tests are conducted with two-sided Student’s t-distribution at 0.05 level of significance.
Optimization of GO dipping variables on cotton nonwoven fabric
Dipping variables and their levels.

Following empirical regression equation is used to describe the relationship between the dependent variable (surface resistivity) and independent variables (GO dipping variables) [18,19]
The β coefficient analysis is carried out to find the relative contribution of each independent variable in the regression equation, calculated from equation (2) [19]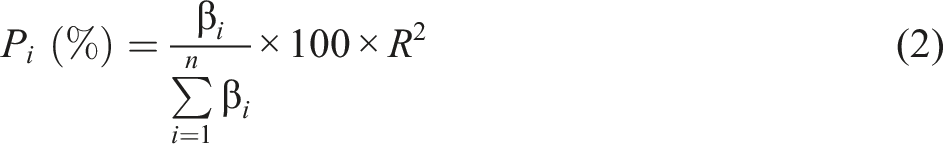
Characterisation and measurement
The surface micrographs of cotton fibre and GO coated cotton fibre are recorded with the FESEM (FEI Quanta 200 F). The surface micrographs of cotton nonwoven fabric and rGO coated cotton nonwoven fabric are recorded with Nova Nano FE-SEM 450 (FEI). The cross-sectional images of cotton nonwoven and rGO coated cotton nonwoven are captured with Leica MC 170 image analyser (Leica Microsystems). X-ray diffraction (XRD) patterns of GO, rGO, cotton and GO coated cotton are recorded using an Empyrean X-ray diffractometer (PANalytical B.V.) with Cu-Kα radiation (λ = 1.5406 Å). These spectra are recorded at 25°C with a step size of 0.017° (2θ). FTIR-ATR spectra of GO, rGO, cotton and rGOC are recorded on ALPHA-II spectrometer (Bruker) in the range of 4000–4600 cm−1. FTIR spectra are recorded with a diamond crystal at 64 scans and 2 cm−1 resolutions. Raman spectra of GO, rGO, cotton and rGOC are recorded with inVia Renishaw spectrometer (Renishaw PLC) with a 785 nm laser. Thermal stability of cotton and rGOC are analysed with a thermogravimetric analyser (STA 6000, PerkinElmer) under nitrogen atmosphere at a heating rate of 10°C min−1 with the temperature ranging from 30°C to 600°C.
The rGO add-on is calculated by subtracting oven-dried mass of cotton (wCotton) from the oven-dried mass of rGOC (wrGOC) and expressed as the percentage of initial oven-dried mass of cotton
For the measurement of electrical resistivity, two approaches are used: volume resistivity is measured for fibres during batch adsorption study and surface resistivity is measured for the nonwoven fabric. For the measurement of volume resistivity, 5 g of rGOC fibres are filled in a thick-walled PVC cylinder (inner diameter = 36 mM and length = 21 mM) equipped with two copper plungers, one fixed and other detachable for filling fibres. Both the plungers are compressed by a bulldog clip to maintain uniform pressure. The plungers are connected to a two-probe digital multimeter (MASTEC® MAS830L) to record the resistance (R). Volume resistivity (ρ) is calculated from equation (4)
The UV protection properties of cotton nonwoven fabric and rGOC fabric are determined by UV transmission spectra and UV protection factor. Transmittance spectra are recorded by UV spectrophotometer (UV–2600, Shimadzu) ranging from 280 nm to 400 nm. The UV protection factor is calculated as per the Australia/New Zealand standard AC/NZS 4399:1996 [8] from the following equation
The physical properties of cotton nonwoven are evaluated according to the ASTM test standards: ASTM D 6242 for GSM (mass per unit area); ASTM D 5736 for thickness; ASTM D 1388 for bending rigidity and bending modulus and ASTM D 5035 for tensile properties (cut strip test) [21].
During the analysis of electrical, UV protection and physical properties, each experiment is repeated three times, and their average values are reported with standard deviation.
Results and Discussion
Batch adsorption study of GO on cotton fibre
Effect of pH
Batch adsorption studies are carried out from pH 2 to pH 7 in order to identify the most influencing pH range of GO solution. Below pH 2, the carboxyl groups at the edges of GO nanosheets are strongly protonated and tend to aggregate [22] and above pH 7, hydroxyl complexes form in the GO structure which limits the restoration of the conductive graphene structure during the reduction process [23]. Hence, a pH range of 2–7 is used during the study. 0.01 N HCL solution is used to prepare GO solutions of different pH. The effect of pH of GO solution on rGO add-on and volume resistivity of cotton fibres is shown in Figure 1(a). The rGO add-on on cotton fibre decreases with increasing pH. The rGO add-on of 1.02% is achieved at pH 2 which continues to decrease till pH 7 where rGO add-on of 0.52% is achieved. Effect of GO dipping variables on rGO add-on and electrical resistivity of cotton.
This may be due to an increase in repulsion between the cotton and GO as well as a possible decrease in the GO surface functional groups with the increase in pH [24–26]. A reverse trend is observed in volume resistivity which increases from 690.22 kΩ cm to 1867.56 kΩ cm increasing pH from 2 to 7 due to the decrease in the rGO add-on. Based on the rGO add-on and volume resistivity, the pH range of 2–4 is considered as the most influencing range for GO treatment on cotton.
Effect of GO concentration
The effect of GO concentration on rGO add-on and volume resistivity of cotton fibre is shown in Figure 1(b). The adsorption of rGO on cotton fibre gradually increases with the increase in GO concentration from 0.2% to 0.6%, afterwards it rapidly increases up to 1.2% and then levels off. rGO add-on of 2.28% is achieved at 1.2% GO concentration. The volume resistivity of rGOC fibre follows a reverse trend of the rGO add-on. The volume resistivity of rGOC fibre decreases remarkably from 3252.36 kΩ cm to 107.65 kΩ cm as the concentration of the GO solution increases from 0.2% to 1.2%. On further increasing GO concentration no significant changes in rGO add-on and volume resistivity are observed. The most influencing range of GO concentration is considered from 0.6% to 1.2%.
Effect of dipping temperature
The rGO add-on is significantly decreased from 2.99% to 2.28% as dipping temperature is increased from 40°C to 70°C (Figure 1(c)). This might be due to the degradation or deoxygenation of GO active sites, which reduces the number of available surface-active GO sites for interaction with cotton. The volume resistivity of rGOC fibre decreases gradually from 62.33 kΩ cm to 53.23 kΩ cm as the dipping temperature increases from 30°C to 40°C. Further, increase in dipping temperature from 40°C to 50°C results in a twofold increase in volume resistivity of rGOC fibre. The optimum dipping temperature is selected as 40°C.
Effect of dipping time
At the initial phase (up to 4 min) the adsorption is rapid as all the active sites of cotton are free to interact with GO (Figure 1(d)). The adsorption progressively decreases with the lapse of time and reaches equilibrium. The volume resistivity of rGOC fibre significantly decreases from 187.58 kΩ cm to 119.56 kΩ cm as the dipping time increases from 2 min to 6 min. Here, the optimum dipping time is considered to be 6 min.
Effect of Na2S2O4 concentration
It can be observed from Figure 1(e) that the low concentration of Na2S2O4 (5 m
Optimization of GO dipping variables on cotton nonwoven fabric
ANOVA for response surface reduced quadratic model.

p-value (<0.05) indicates GO concentration (X1), pH of GO solution (X2) and Na2S2O4 concentration (X3) are significant variables. None of the interaction effects is significant at a 0.05 significance level. Regression equation is derived from these significant variables to predict the surface resistivity is represented in equation (6)
The predicted R2 of 0.85 is in reasonable agreement with the experimental R2 of 0.92. Therefore, this regression equation is used to navigate the design space.
Effect of GO concentration and pH
The response surface plot for surface resistivity of graphene coated cotton fabric for GO concentration ranging from 0.6% to 1.2% and pH ranging from two to four against Na2S2O4 concentration of 20 m Response surface plots showing the effects of the GO dipping variables on the surface resistivity of rGOC fabric: (a) GO concentration and pH, (b) GO concentration and Na2S2O4 concentration and (c) pH and Na2S2O4 concentration.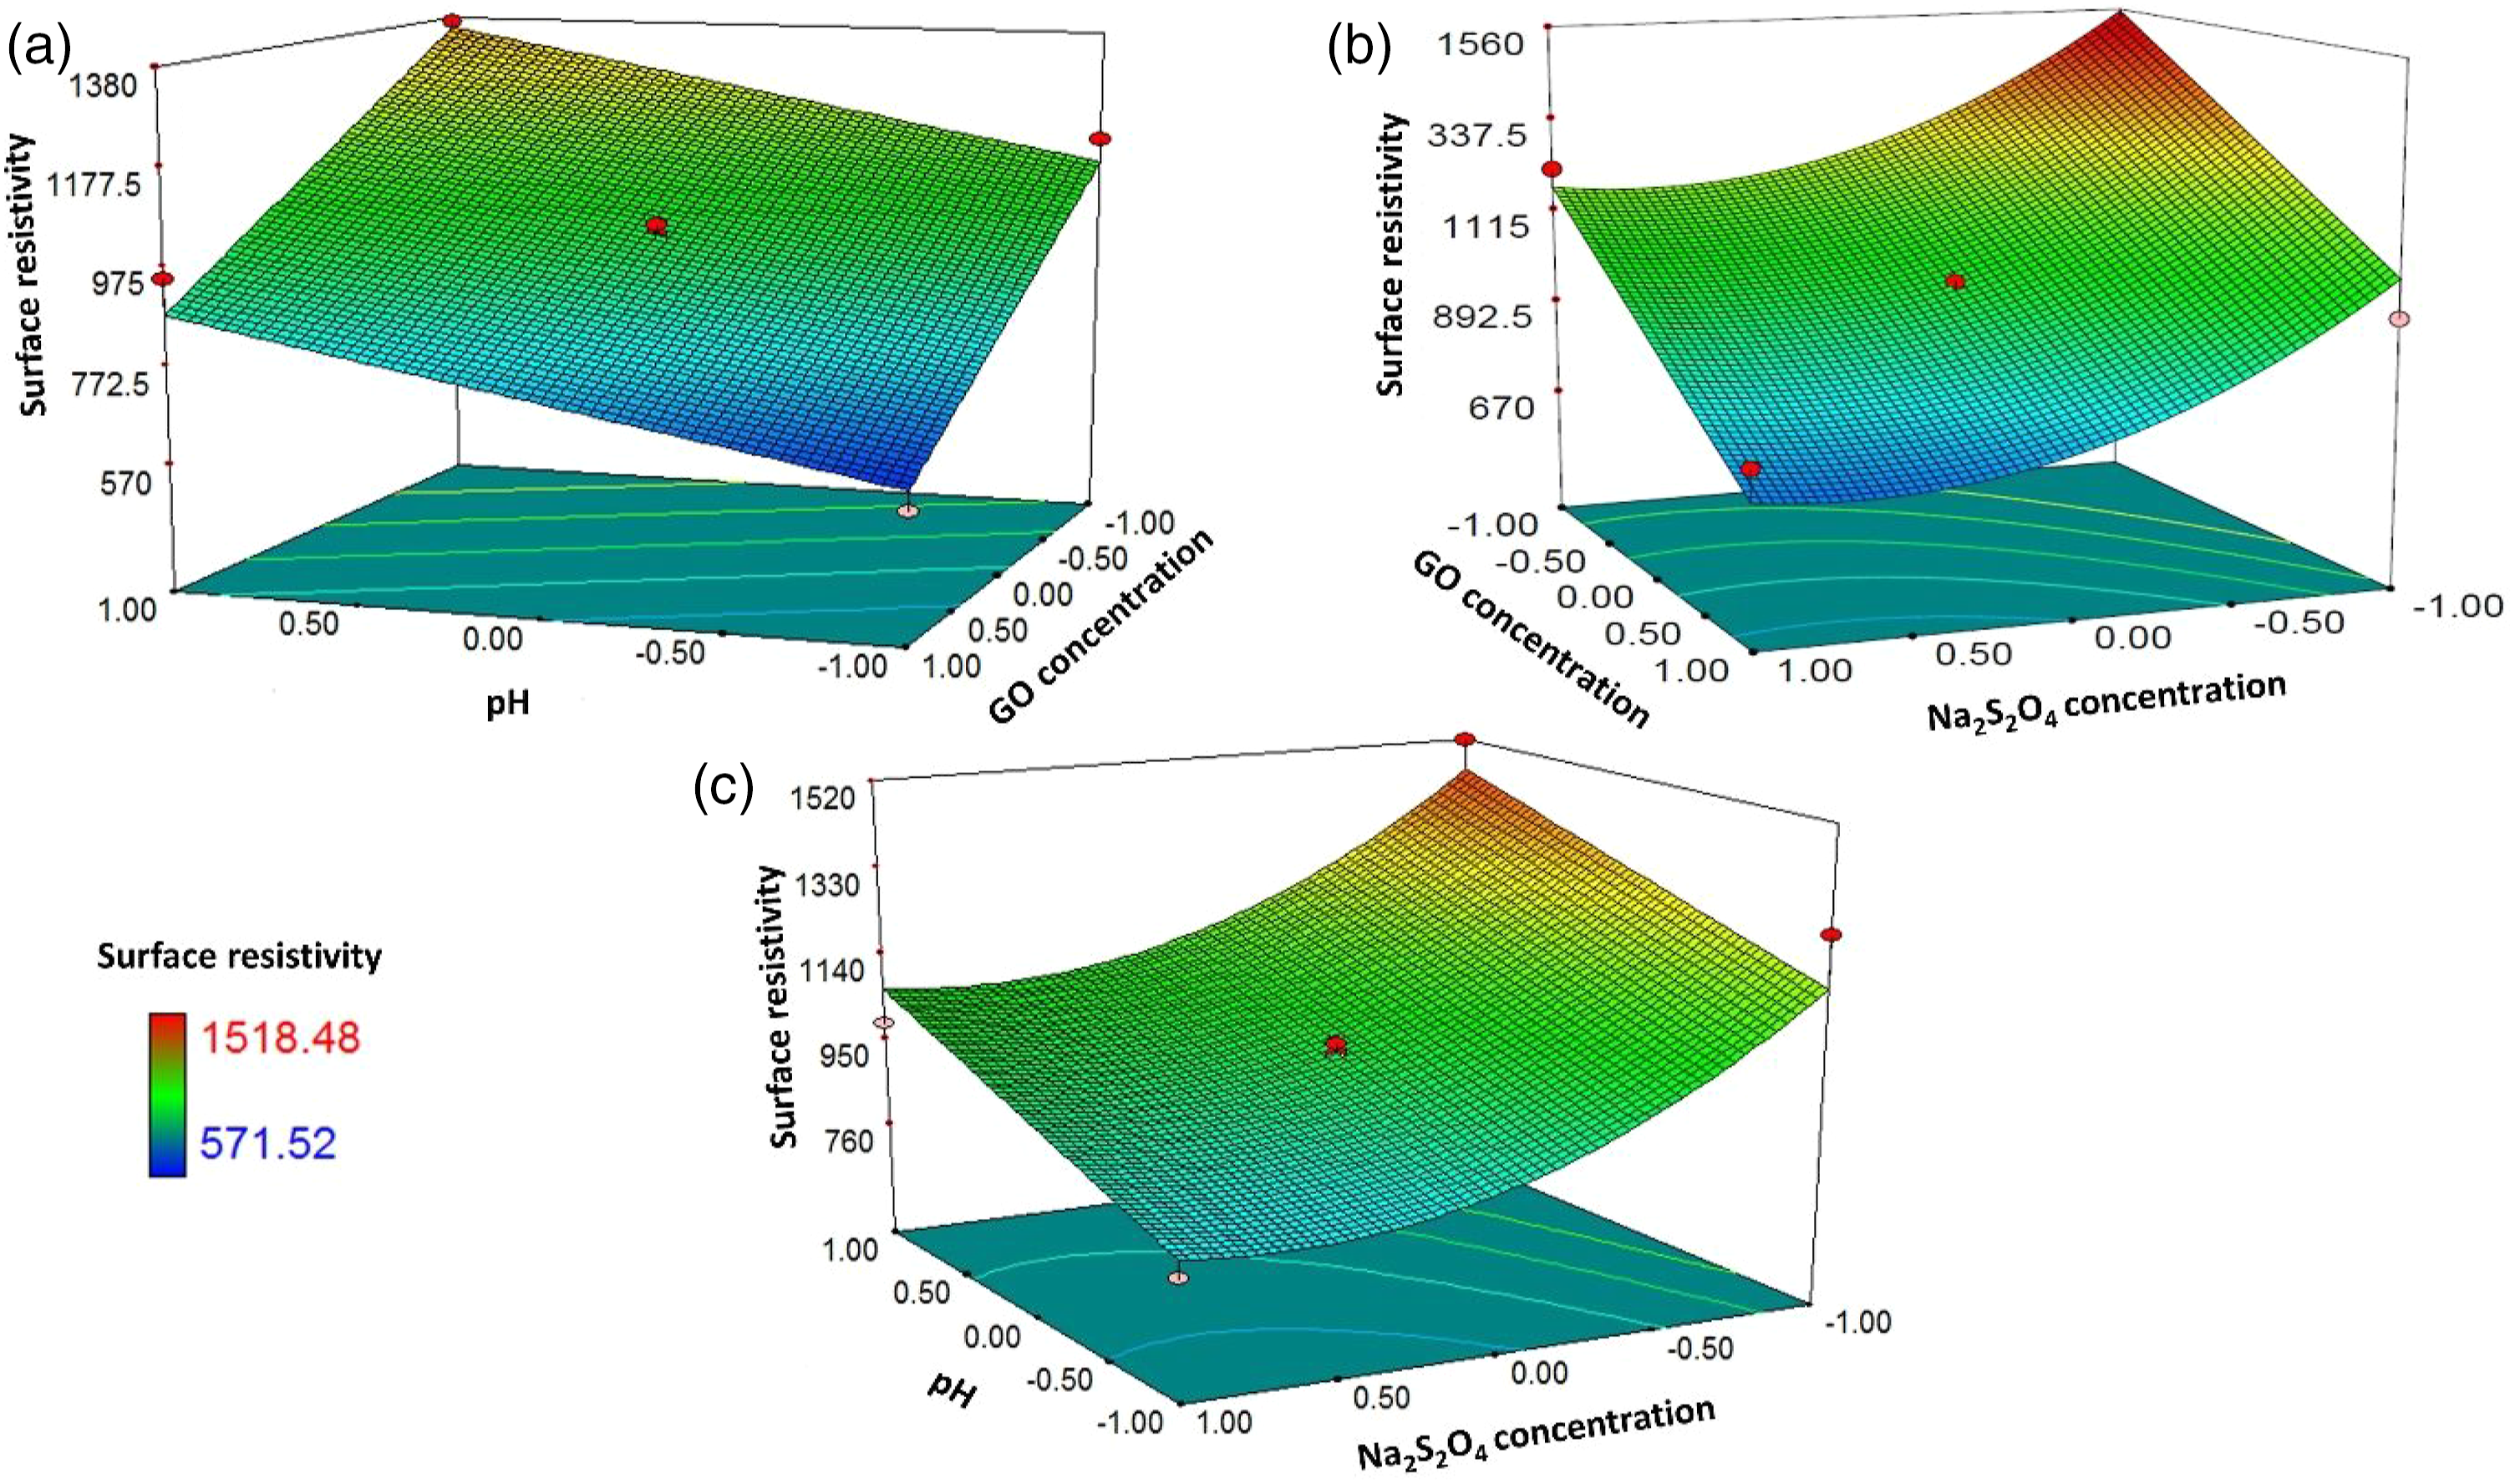
Effect of GO concentration and Na2S2O4 concentration
The response surface plot for surface resistivity of graphene coated cotton fabric for GO concentration ranging from 0.6% to 1.2% and the Na2S2O4 concentration ranging from 10 m
Effect of pH and Na2S2O4 concentration
The response surface plot for surface resistivity of graphene coated cotton fabric for pH ranging from 2 to 4 and the Na2S2O4 concentration ranging from 10 m
The relative contribution of these dipping variables is calculated from β coefficient analysis (equation (2)). The most influencing GO dipping variables are GO concentration with 39% contribution followed by Na2S2O4 concentration (31.15%), and pH of GO solution (21.66%).
The desirability function approach is used for the optimization of these dipping variables to obtain minimum surface resistivity with maximum desirability for rGOC fabric. The GO concentration is minimized from 0.9% to 1.2% to avoid the wastage of costly GO and the pH of GO solution is kept in range (2–4). Increasing Na2S2O4 concentration beyond 20 m
For the validation of model-predicted surface resistivity, cotton nonwoven fabric is coated with GO at these optimized dipping conditions with three replications. The experimental surface resistivity of 860.44 kΩ sq−1 is achieved which is in good agreement with the predicted surface resistivity (Error = 0.98%). The rGO add-on on cotton nonwoven fabric at these optimized dipping conditions is 5.31%.
To further reduce the surface resistivity, multiple dippings are given to cotton nonwoven fabric at these optimized dipping conditions with three repetitions. The surface resistivity of rGOC fabric drastically decreases from 860.44 kΩ sq−1 to 48.03 kΩ sq−1 at the second dipping cycle (Figure 3(a)). This is due to the massive increase in rGO add-on from 5.31% to 9.20%. On further advancing the number of dipping cycles, rGO add-on on rGOC fabric continues to rise progressively and the surface resistivity gradually decreases. The lowest surface resistivity of 7.39 kΩ sq−1 is achieved at 21.33% of rGO add-on after five dipping cycles. The rGO treated cotton fabrics at 1, 2, 3, 4 and 5 dipping cycles are coded as rGOC-1, rGOC-2, rGOC-3, rGOC-4 and rGOC-5, respectively. (a) Dipping cycle versus rGO add-on and surface resistivity of rGOC fabric; (b) UV protection properties of cotton fabric and rGOC-1.
UV blocking properties of cotton nonwoven fabric
UV transmittance spectrum of fabric samples is recorded with air as a reference, and UPF values are calculated from these spectra (Figure 3(b)). The UV-A and UV-B transmittance of untreated cotton nonwoven fabric are drastically reduced from 39.06% and 27.92%–2.84% and 0.742%, respectively, after the single dipping (rGOC-1). The UPF value of rGOC-1 fabric is remarkably increased to about 27-fold (UPF = 89.38) with respect to untreated cotton nonwoven fabric (UPF = 3.24). According to the Australia/New Zealand standard, AC/NZS 4399:1996, rGOC-1 fabric shows an excellent UPF rating (50+) [8]. It implies that even at 5.31% of rGO add-on on cotton nonwoven fabric can efficiently shield UV radiation.
After the second dipping (rGOC-2), the UV–A and UV–B transmittance of cotton fabric further reduced to 0.001% ± 0.002% and 0.003% ± 0.002% due to the substantial increase in rGO add-on from 5.31% to 9.20%. As a result, the UPF value of rGOC-2 fabric (UPF = 18,702.56 ± 805.79) is exceptionally improved which is far beyond the excellent range.
The achieved UPF value of 89.38 is the highest reported value so far for a graphene coated textile in a single dipping and without using any cross-linking or surface modifying agents. Furthermore, the obtained UPF value after two dippings is the highest till now.
In order to investigate the UV protection mechanism of rGO coated fabric, UV reflection and absorbance spectrum of rGOC-2 are recorded in the range of 280 nm to 400 nm with three repetitions. The UV absorption of rGOC-2 is very high (7.53 a.u. ± 0.080 a.u.), while the reflection is zero (0.0005% ± 0.000013%). The exceptional improvement in UV protection properties is due to presence of large number of rGO in the cotton nonwoven which helps to absorb the incident UV radiation.
Physical properties of cotton nonwoven fabric
Physical properties cotton nonwoven fabric.
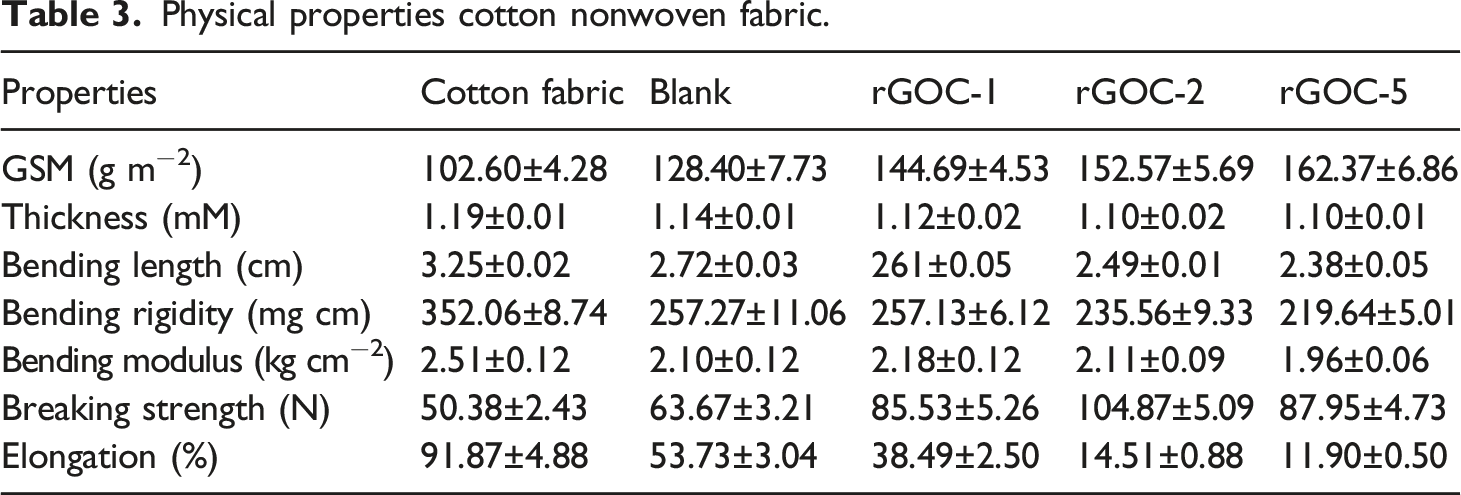
The breaking strength of cotton fabric significantly increases up to the second dipping because of the improved compactness. Further advancing the dipping cycles, the fabric strength decreases possibly due to the loss of fibre strength during the repetitive coating and reduction although the strength is still higher than untreated fabric. Fabric elongation decreases as the dipping cycle increases due to the increase in fabric compactness.
Wash and rubbing fastness of rGO coated cotton nonwoven
In order to evaluate the stability of rGO on cotton fabric, washing and rubbing stability tests are carried out for rGOC-2 sample according to the ISO 105-CO1 and ISO 105-X 12 standards with three repetitions. The rGO-2 exhibited exceptional stability towards washing and rubbing. After five washing cycles, the surface resistivity of rGOC-2 increases from 48.03 kΩ sq−1 ± 0.47 kΩ sq−1 to 49.7 kΩ sq−1 ± 1.09 kΩ sq−1. The surface resistivity increases from 48.03 kΩ sq−1 ± 0.47 kΩ sq−1 to 49.38 kΩ sq−1 ± 0.92 kΩ sq−1 after 10 rubbing cycles. The rise in surface resistivity due to washing and rubbing is insignificant at the significance level of 0.05. The increase in surface resistivity may be due to removal of loosely attached rGO from cotton nonwoven.
Characterization
All the characterisation of graphene coated cotton fabric is carried out after one dipping at the optimized dipping condition. FTIR spectra of cotton fabric, GO, rGO and rGOC fabric are shown in Figure 4(a). FTIR spectra of GO show two broad and intense peaks at 3291 cm−1 and 1637 cm−1 which correspond to the OH stretching of carboxylic acid due to the presence of absorbed water molecules and C=C stretching from unoxidized graphitic sp2 domains, respectively [27]. FTIR spectrum of GO confirms the presence of oxygen-containing functional groups on graphene. After the reduction of GO, both the vital peaks of GO almost disappear, while one new peak appears at 1543 cm−1 corresponding to the skeletal vibration of graphene [27,28]. These changes indicate the restoration of electroconductive sp2-hybridized graphene from the GO after chemical reduction. The FTIR spectrum of cotton fabric shows characteristic absorption peaks of cellulose: hydrogen-bonded OH stretching at 3265 cm−1, CH stretching at 2889 cm−1, OH bending due to scissoring vibration modes of absorbed water molecules at 1649 cm−1, CH2 bending at 1427 cm−1, CH bending at 1335 cm−1 and C–O stretching at 1021 cm−1 [28,29]. Noteworthy changes are observed in the FTIR spectrum of cotton fabric after rGO deposition. The absorption peaks of cotton fabric at 1649 cm−1 and 1335 cm−1 are redshifted to 1631 cm−1 and 1314 cm−1 in rGOC fabric spectrum. Compared to cotton fabric, one additional peak is observed in the rGOC fabric spectrum at 1543 cm−1 corresponding to the skeletal vibration of graphene [28]. All these changes suggest attachment of GO on cotton via intermolecular hydrogen bonding. Possible mode of interaction between GO and cotton is schematically shown in Figure 5. (a) FTIR spectra of GO, rGO, cotton and rGOC; (b) Raman spectra of GO, rGO, cotton and rGOC; (c) XRD pattern of GO, rGO, cotton and GOC and (d) TGA thermographs of cotton and rGOC. Possible mode of interaction between GO and cotton.

Initially, GO is deposited on cotton via strong hydrogen bonding between the carboxyl and hydroxyl functional groups of GO and the hydroxyl groups of cotton. In subsequent dippings, the GO particles available in solution are deposited on previously adsorbed rGO on cotton by π–π interactions and hydrophobic force, and/or by interaction with remaining active sites of cotton by hydrogen bonding.
Raman spectra of GO and rGO show characteristics D band at 1343 cm−1 and 1356 cm−1, and characteristics G band at 1598 cm−1 and 1591 cm−1, respectively (Figure 4(b)). The D band intensity of rGO is relatively lower than GO, which indicates defects in GO structure are reduced after reduction. The G band of GO is redshifted to 7 cm−1 and the intensity ratio of the D band to G band (
The XRD pattern of GO displays a sharp (001) reflection at 9.02°, which corresponds to an interlayer spacing of 9.94 Å due to the attachment of oxygen-containing functional groups on the basal planes and edges of the GO (Figure 4(c)). The XRD pattern of rGO shows a strong diffraction peak at 2θ = 26.5° which corresponds to an interlayer spacing of 3.36 Å. The interlayer spacing of rGO is significantly lower than that of GO due to the reduction of oxygen-containing functional groups on graphene. The XRD pattern of cotton fabric displays characteristics cellulose I peaks at 14.82°, 22.67° and 33.8° attributed to the planes of (110), (110) and (200), respectively [31]. The characteristic peak of GO is not visible in the GO coated cotton (GOC) diffractogram, implying that GO deposition on cotton does not influence the crystal structure of cotton.
The TGA thermographs of cotton fabric and rGOC fabric are shown in Figure 4(d). No significant difference in the thermal degradation behaviour is observed after 5.31% rGO add-on. However, the presence of rGO on cotton significantly influences the decomposition behaviour of cotton which is reflected in 26 weight % of char content compared to 12.6 weight % char content of untreated cotton. The 5.31% rGO add-on does not explain the 26 weight % of char content, and further investigation is necessary to explain the excess char content.
FESEM and optical photo-micrographs of untreated and treated cotton fibre and fabric are shown in Figure 6. It can be seen from Figure 6(a) that the morphology of untreated cotton fibre exhibits a smooth surface with some featured convolutions. After the GO deposition on cotton, a few wrinkled layers can be observed on cotton fibre surface (indicated by circles) which indicates a large amount of GO nanoparticles are uniformly deposited on the cotton fibre surface (Figure 6(b) and (c)). It can be seen from Figure 6(d) and (e), that GO nanoparticles are densely and uniformly deposited on the surface as well as in the pores of cotton nonwoven fabric after 5 dippings. The cross-sectional images of cotton nonwoven fabric before and after the GO deposition are shown in Figure 6(g) and (h). Figure 6(h), shows that a high amount of GO nanoparticles are deposited and captured in the porous structure of nonwoven fabric. FESEM images: (a) cotton fibre ×5000, (b) GOC fibre ×5000, (c) GOC fibre ×10,000, (d) cotton nonwoven fabric ×500, (e) rGOC fabric ×500 and (f) rGOC fabric ×50,000; cross-sectional images: (g) untreated cotton nonwoven ×12.5 and (h) rGOC fabric ×12.5.
Conclusion
This work provides a deeper understanding of the influence of GO dipping variables on the rGO add-on and electrical resistivity for cotton. Batch adsorption study suggests that the most influencing GO dipping variables are GO concentration, sodium dithionite concentration, and pH of GO solution for GO adsorption on cotton. The influencing range of these dipping variables for cotton is identified as follows: GO concentration 0.6%–0.9%, pH 2 to 4 and Na2S2O4 concentration 10 m
Supplemental Material
sj-pdf-1-jit-10.1177_15280837211059202 – Supplemental material for Graphene coated cotton nonwoven for electroconductive and UV protection applications
Supplemental material, sj-pdf-1-jit-10.1177_15280837211059202 for Graphene coated cotton nonwoven for electroconductive and UV protection applications by Vinit Kumar Jain and Arobindo Chatterjee in Journal of Industrial Textiles
Footnotes
Declaration of conflicting interests
The author(s) declared no potential conflicts of interest with respect to the research, authorship, and/or publication of this article.
Funding
The author(s) received no financial support for the research, authorship, and/or publication of this article.
Supplemental Material
Supplemental material for this article is available online.
References
Supplementary Material
Please find the following supplemental material available below.
For Open Access articles published under a Creative Commons License, all supplemental material carries the same license as the article it is associated with.
For non-Open Access articles published, all supplemental material carries a non-exclusive license, and permission requests for re-use of supplemental material or any part of supplemental material shall be sent directly to the copyright owner as specified in the copyright notice associated with the article.