
Abstract
In this study, Nylon 6 nanofiber were prepared by needle-less wire electrospinning technique. Since, the fiber diameter determines the porosity, filtration efficiency, and mechanical properties of electrospun nanofiber mat, Central Composite Design (CCD) and Response Surface Methodology have been employed to design the experiments and evaluate the interactive effects of the operating variables such as concentration of the polymeric solution, the distance between two electrodes, applied voltage, and relative humidity (RH%) on the diameter of the Nylon 6 nanofiber. With this connection, an objective of this study was to find out the most influential variables for the finest nanofiber diameter during the spinning with wire type electrode to make the highest possible effective face mask without the addition of any functional additives in it. The overall results show that the combined effect of 12% polymer concentration, 65% RH, 155 mm distance between two electrodes, and 40 kV applied positive voltage have the strongest surface response and are the most significant than the other interactive effects. The Pareto chart illustrates the order of significance affecting the Nylon 6 nanofiber diameter in the order of concentration of the polymeric solution, RH%, the distance between electrodes, and applied positive voltage. Further, bacterial filtration efficiency% of the control sample and five-layer facemask incorporated with optimized nanofiber membrane was found to be 87.4% and 97.5%, respectively, against Staphylococcus Aureus ATCC 6538 bacteria.
Introduction
Nanofiber are a thousand times smaller than human hair and have a unique position among the other nanomaterials because of their large surface area, high aspect ratio (length/diameter), and high porosity. These characteristics make it breathable [1]. Considering the advantages, nanofiber could be the best choice in a wide range of application areas viz. solid, liquid, and gas filtration [2,3], optical and chemical sensors, electrode materials, biological and engineering scaffolds, catalyst supports, and drug delivery systems. Specifically, considering the current Covid-19 pandemic situation, the nanofiber membrane-based facemask can be used effectively for bacterial and virus filtration [4,5]. So, to produce a nanofibrous membrane with fine pore size, electrospinning is well accepted and efficient method to manufacture micro to nano-sized continuous fibers from polymeric solutions [1]. Technologically, nanofiber can be manufactured by needle and needle-less electrospinning methods [6]. Needle-type electrospinning has a low production capacity and often ascertains the needle clogging that gives poor quality, and discontinuous nanofiber. These disadvantages of needle-type electrospinning could be beaten by needle-less technology with wire electrode-type electrospinning. Supplementary, continuous electrospinning of uniform diameter with bead free nanofiber is a tricky process as their diameter is influenced by several parameters viz. (a) Spinning solution parameters (molecular weight, viscosity, surface tension, solution conductivity, concentration, etc.); (b) Electrospinning parameters (flow rate, supply voltage, distance between electodes, etc.) and (c) Ambient parameters (temperature, air flow, and moisture) [7–9]. The relationship between these parameters and their effect on fiber diameter is very complex. The optimization of process parameters based on changing one parameter at a time and keeping others at a constant level is laborious, time-consuming, impractical, and often does not capture reliable results. Therefore, analyses of these parameters using conventional experimental methods are ineffective.[10]. Hence, Design of Experiment (DOE) is the remarkable approach for the design and optimization of experimental research.[11]. It is an efficacious statistical technique, used for optimizing the performance of the experimental research with known input variables. It plays an important role in maximizing the amount of information gained while minimizing the numeral experimental runs [12].
Central composite design (CCD) is one of the appropriate experimental design methods which provides high-quality predictions during the study of linear, quadratic, and interaction effects of parameters [13]. Further, based on the central composite experimental design, Response Surface Methodology (RSM) is an efficient technique to study the interaction effects in a multivariable system for attaining the optimum conditions [14]. RSM is a useful model to study the effect of multiple factors by varying them simultaneously by carrying out a limited number of experiments. It is based on a practical modeling method that involves the utilization of the polynomials in place of local approximations to the correct input or output relationship. With this context, RSM creates a map of the response from running a series of full factorial DOE’s and comes up with equations that describe how the factors affect the response. Hence, using RSM, an objective is to improve the optimized response (output variables) that is influenced by several independent variables (input variables) [15,16]. So, CCD and RSM could be applied to design experiments and to evaluate the interactive effects of the operating variables.
In the present study, CCD is used to work out the number of experimental runs and RSM is to investigate the interactions between the operational variables of nylon 6 electrospinning such as polymer concentration, positive voltage, the distance between two electrodes, and RH% at various levels. Thereupon, Nylon 6 polymer was chosen for the electrospinning of ultrathin fibers because it has good toughness, high abrasion resistance, easy process-ability, and spinnability [17]. In addition to that, Nylon 6 polymer also has good mechanical, thermal, and chemical properties [18]. Hence, the present study was planned to examine the most influential variables to achieve the finest nanofiber membrane with smaller pore size to make the effective bacterial filtration facemask.
Experimental section
Materials
The fiber grade Nylon 6 granules (Mn = 25,000 g/mol) were procured from the local supplier Mumbai (India). Acetic acid (CH3COOH; 99% purity) and formic acid (HCOOH; 90% purity) as the solvents were purchased from Merck Life Science Pvt. Ltd., Mumbai (India). Both chemicals were used as received without further purification. Polypropylene spun-bonded non-woven fabric was purchased from Techfab (India) Industries Ltd., Daman (India).
Preparation of electrospun Nylon 6 nanofiber
To prepare nanofiber, hot vacuum oven-dried and pre-weighted Nylon 6 granules were dissolved in a 2:1 (wt./wt.) ratio of acetic acid and formic acid in a conical flask. Initially, both solvents were mixed homogeneously by continuous magnetic stirring for 10 min. After this, the required amount of Nylon 6 granules was added slowly, and the stirring speed was increased gradually up to 500 r/min and kept stirred continuously for 2 h at 70°C for the complete dissolution of the polymer. After the preparation of the Nylon 6 polymer solution, the nanofiber was produced by using the needle-less wire electrospinning technique (NS 1W500U electrospinning machine, ELMARCO, Czech Republic). This electrospinning setup consists of two wire electrodes of opposite polarity, a carriage driven by pneumatic systems that apply polymer solution on the wire electrode surface. The negative electrode is stationary, and the positive electrode is moved during spinning at a selected speed of 5 mm/min. The spun-bonded non-woven polypropylene fabric is used as a substrate for nanofiber deposition.
Electrospinning parameters such as concentration of polymer (12, 15, and 18% wt./wt.), positive electrode voltage (30, 40, and 50 kV), the distance between the electrodes (130, 155, and 180 mm), and RH (35, 50, and 65%) were studied. Other electrospinning parameters such as negative voltage (15 kV), the temperature of the environment (25°C), spinning wire electrode speed (5 mm/min), carriage speed (150 mm/sec), orifice diameter (0.8 mm), airflow going through the electrospinning chamber (90 m3/h), substrate speed (300 mm/min), and deposition time (30 s) were kept constant for all the experiments.
Characterizations
Surface morphologies of the prepared electrospun nanofiber mats were observed under Scanning Electron Microscope (JEOL, JSM IT 200 LV, Japan). All samples were sputter-coated with gold before SEM analysis. SEM images were taken in a secondary electron mode at 10 kV accelerating voltage and ×15,000 magnifications. The nanofiber diameter of each sample was measured from the SEM micrographs by image J software (NIH, USA). An average value of 150 measurements from each sample from different positions is reported. In addition, the statistical software “Minitab 18” was used for the analysis of the experimental data.
A facemask was prepared with two cotton outer layers and other three non-woven layers including nanofiber membrane. For the outer layer, plain woven cotton fabric with an areal density of 100 g/m2 was used. A quantitative measure of bacterial filtration efficiency% of the prepared five-layer facemask including nanofiber membrane and a control sample without nanofiber membrane was evaluated against Staphylococcus Aureus ATCC 6538 bacteria as per ASTM F2101 standard method at SITRA, Coimbatore (India).
According to this standard, face mask samples are cut in a 10 × 10 cm size. Sterilized inoculum size of 5 × 10⁵ CFU/mL was prepared in Tryptic soya agar media and diluted by peptone water. Bacteria were allowed to grow at 37°C for 24 h, and later on, test samples are inoculated with the concerning organisms. During testing, the flow rate of aerosol was 28.5 L/min where the mean particle size of challenging aerosol was 3.0 ± 0.3 microns.
Results and discussion
Experimental design
Experimental plan for optimization of Nylon 6 electrospun nanofiber using Central Composite Design (CCD).

Scanning electron microscopy (SEM) analysis
The Nylon 6 nanofiber were manufactured as per 27 CCD experimental runs. The surface morphologies of the produced nanofiber are observed by SEM as shown in Figure 1. From the SEM micrographs, the surface of the produced nanofiber was found smooth without any bead formation. The diameters of nanofiber from each sample were measured and reported in Table 2. Fiber diameter data suggests that it is very dependent on the concentration of electrospinning solution and RH% than the applied positive voltage and distance between two electrodes. The minimum and maximum diameters of nanofiber were found approximately 70 nm, and 402 nm for experimental runs 21 and 5, respectively. SEM micrographs of Nylon 6 Nanofiber web for 27 experimental runs at ×15,000 magnifications (Scale: 1 μm). Screening of operational electrospinning variables affecting diameter of Nylon 6 electro-spun nanofiber through central composite design and regression model.

Nylon 6 nanofiber diameter at different sets of CCD experiments: Actual versus predicted by the linear regression model
The central composite design is a step to optimize the factors that have significant effects and response surface analysis. The experimental results of 27 CCD run corresponding to the combined effect of four components chosen for optimization of Nylon 6 nanofiber diameter in their specified ranges are measured by image J software (NIH, USA) from the captured SEM images, and reported in Table 2. In the given table, an experimental nanofiber diameter varied markedly with the conditions tested, in the range of 71–402 nm. The lowest nanofiber diameter was obtained when relative humidity was high with low polymer concentration (run 21; 65% RH, and 12 wt.% polymer concentrations). The nanofiber diameter of 402 nm was found at 18 wt.% polymer concentration and 35% RH (run 5). Furthermore, the experimental results suggest that these variables strongly affect the diameter of the nanofiber.
The predicted or theoretical Nylon 6 nanofiber diameters for all experiments were obtained (Table 2) by linear regression model that is in encoded units for two or more variables, specified by the following quadratic equation [12,19]
So, based on equation (1), the statistical model that is concerning to the predicted response Y (fiber diameter) is validated as [16]
Later on, regression analysis is performed on equation (2), and after removing insignificant terms the first-order polynomial equation was derived that representing fiber diameter as a function of the independent variables as given in equation (3)
The Nylon 6 nanofiber diameter for each run is predicted by using equation (3), and plotted against the actual fiber diameter as shown in Figure 2. The maximum experimental response for fiber diameter was ≈402 nm whereas the predicted value was ≈351 nm. Similarly, the minimum experimental response for fiber diameter was ≈71 nm and the predicted value is ≈72 nm that indicates a strong correlation between them. A similar graph shows a linear regression line with the positive and negative residuals above and below it, respectively, accompanying the coefficient of determination R2 value of 93.39%. (In general, the higher the R2 better the model fits your data. If this value is 100%, the actual and predicted values would be the same, and all the data points would fall on the same regression line). In this study, the R2 value close to 1 denotes a better correlation between the experimental and predicted responses. Additionally, it also signifies that experiments performed are reliable. Hence, the magnitude of the effects indicates the level of significance of the variable on fiber diameter. Therefore, statistically significant variables with positive effects were further investigated to find the optimal range of these variables [8,16]. The adequacy of the regression model was also scrutinized by using analysis of variance (ANOVA) and tabulated in Table 3. The analysis of variance of the quadratic regression model implied that the model is very significant as was noticeable from the Fisher’s F–test. This statistical analysis demonstrates that the model F-value of 15.32 is significant. The p-value denotes the significance of coefficients and it is also important in understanding the influence of mutual interactions between the variables. In this study, the p < 0.05 indicates model terms are significant [5,15]. Relation between the predicted and actual diameter of Nylon 6 electrospun nanofiber. Analysis of variance (ANOVA) for the Nylon 6 nanofiber diameter.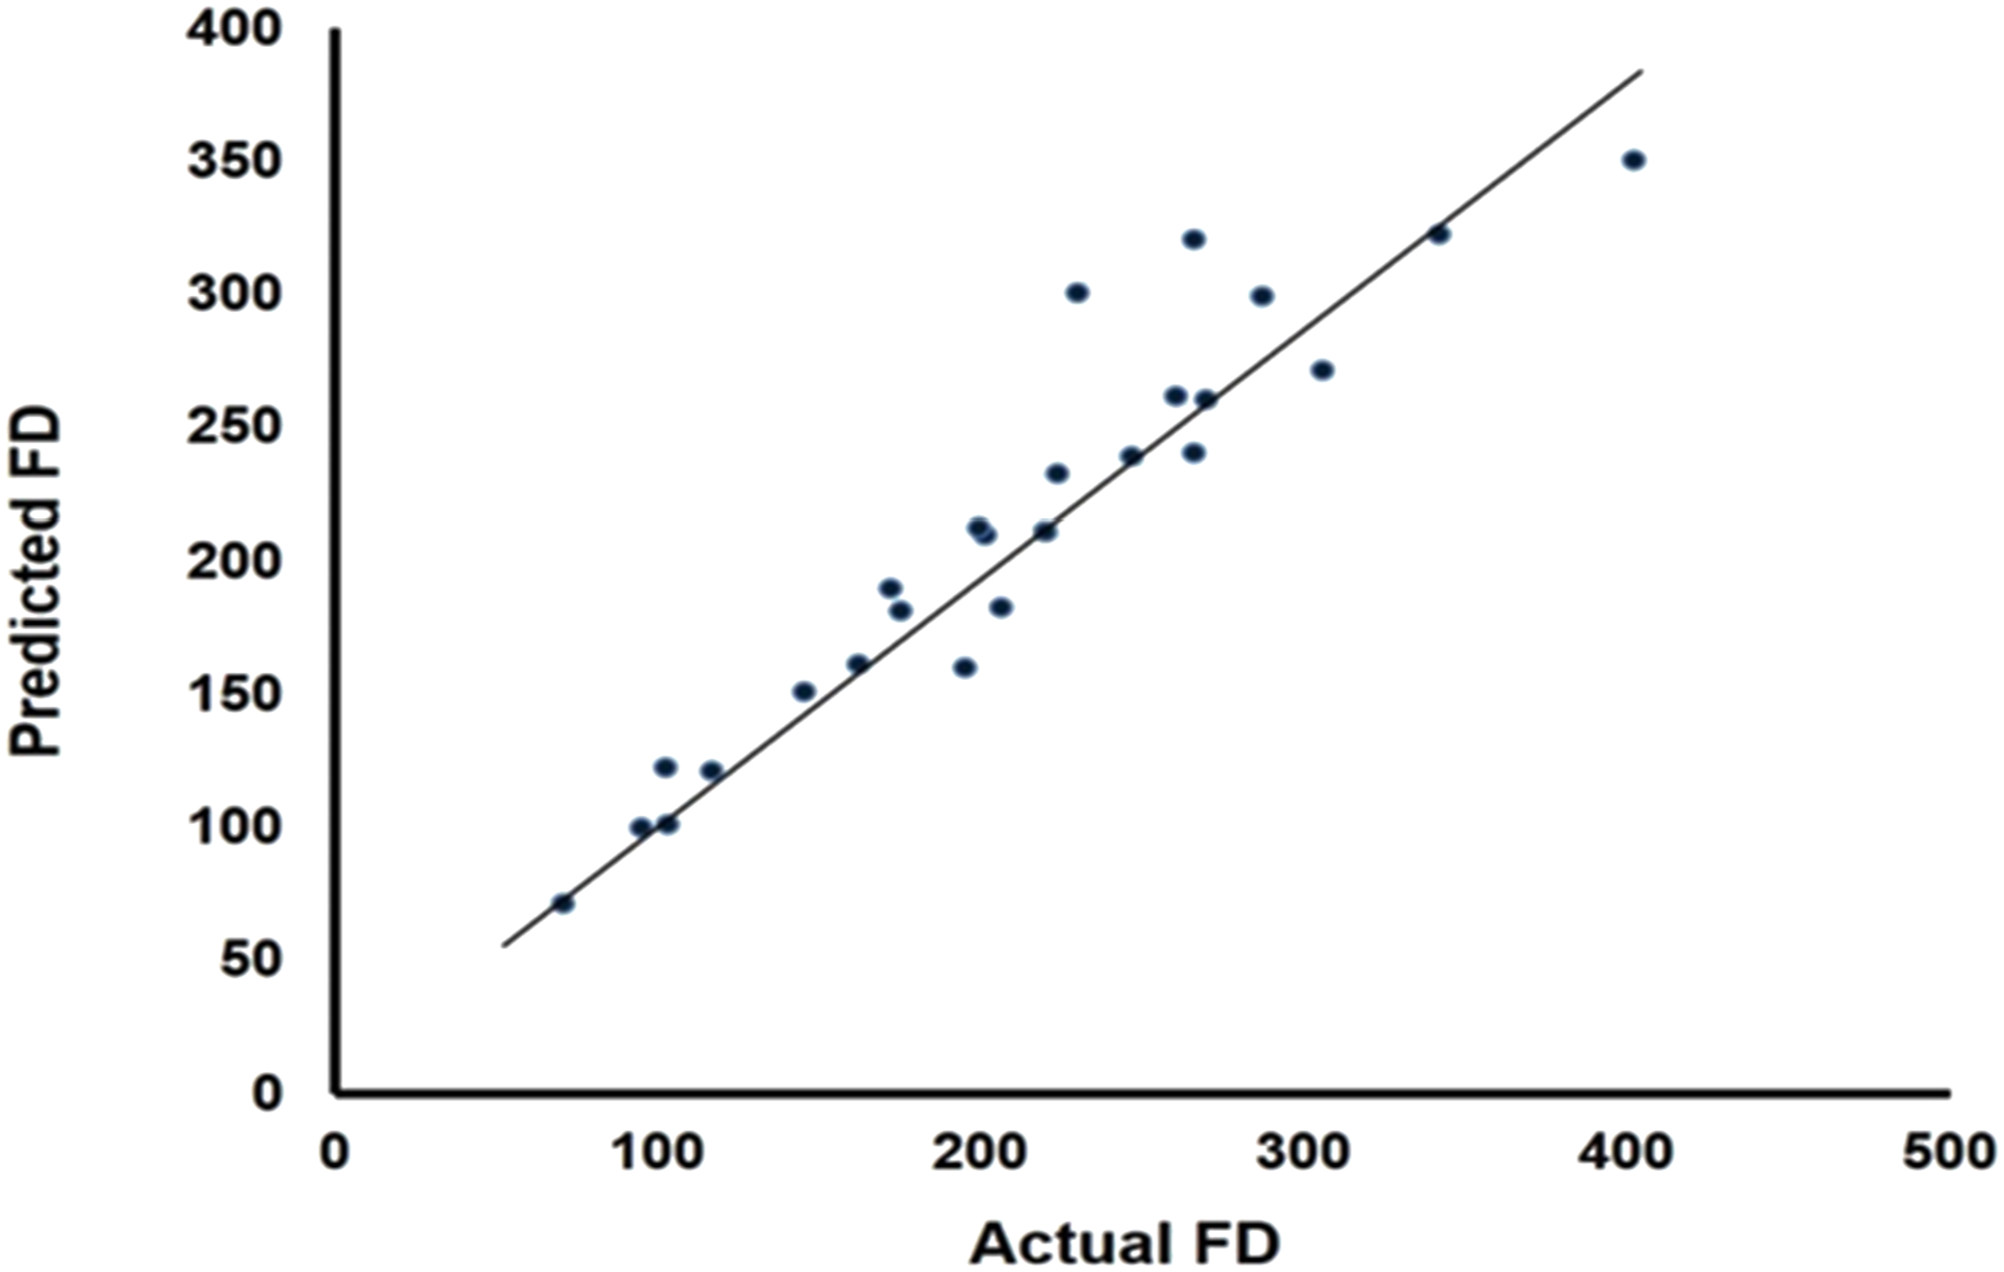

Evaluation of the optimum point by the surface response and contour plots for a facemask
Response surface plots are the 3D plots described by the regression model that are drawn to illustrate the effects of the independent variables and combined effects of each independent variable upon the response variable. The 2D display of the surface plots is called contour plots, and constant responses lines were drawn in the plane of the independent variable. These 2D plots are helpful in the visualization of response surface shape [9,15]. The interaction effects and optimum levels of the variables are determined by plotting the response surface contour plots (Figures 3 and 4) that showed the behavior of response (fiber diameter) for simultaneous change in two variables. From Figure 4, the plot of concentration versus RH%, and the plot of concentration versus voltage only show the region where the minimum fiber diameter can be obtained. Further, this region is narrower in the concentration versus RH% plot compared to the plot of concentration versus voltage. This behavior also resembles the surface plots in Figure 3. Hence, implying to the response and contour plot, any value can be chosen from that zone to get the finest fiber diameter. In our case, the optimum values of the tested variables for the finest fiber diameter are the concentration of the solution (12 wt.%), applied positive voltage (40 kV), the distance between electrodes (155 mm), and RH (65%). Scientifically, an increase in RH% results in a higher diameter of nanofiber because of a reduction of charge density in the polymer droplet which causes the formation of coarse fiber due to less stretching. On the other hand, high RH% also helps to reduce the evaporation rate of solvent that assists to produce finer fibers. However, in this study, we are getting high RH% to produce a fine fiber with a combination of 40 kV. The optimum applied voltage might be helping to maintain the required charge density despite its loss at higher RH%. Further, based on the molecular weight of the used Nylon 6 polymer, the optimum 12 wt% polymeric concentration is sufficient to maintain the required molecular chains entanglement density to get the maximum stretching and finest fiber diameter. The order of significance of the tested variables was analyzed by Pareto chart [16] which is shown in Figure 5. From the given Figure, it is found that effects of parameters with high significance level to low are the concentration of the polymeric solution, RH%, the distance between electrodes, and applied positive voltage. Three-dimensional response surface plots for Nylon 6 nanofiber diameter. Two-dimensional response contour plots of variables on Nylon 6 nanofiber diameter. Pareto chart of the standardized effects of operational variables at 95% confidence level.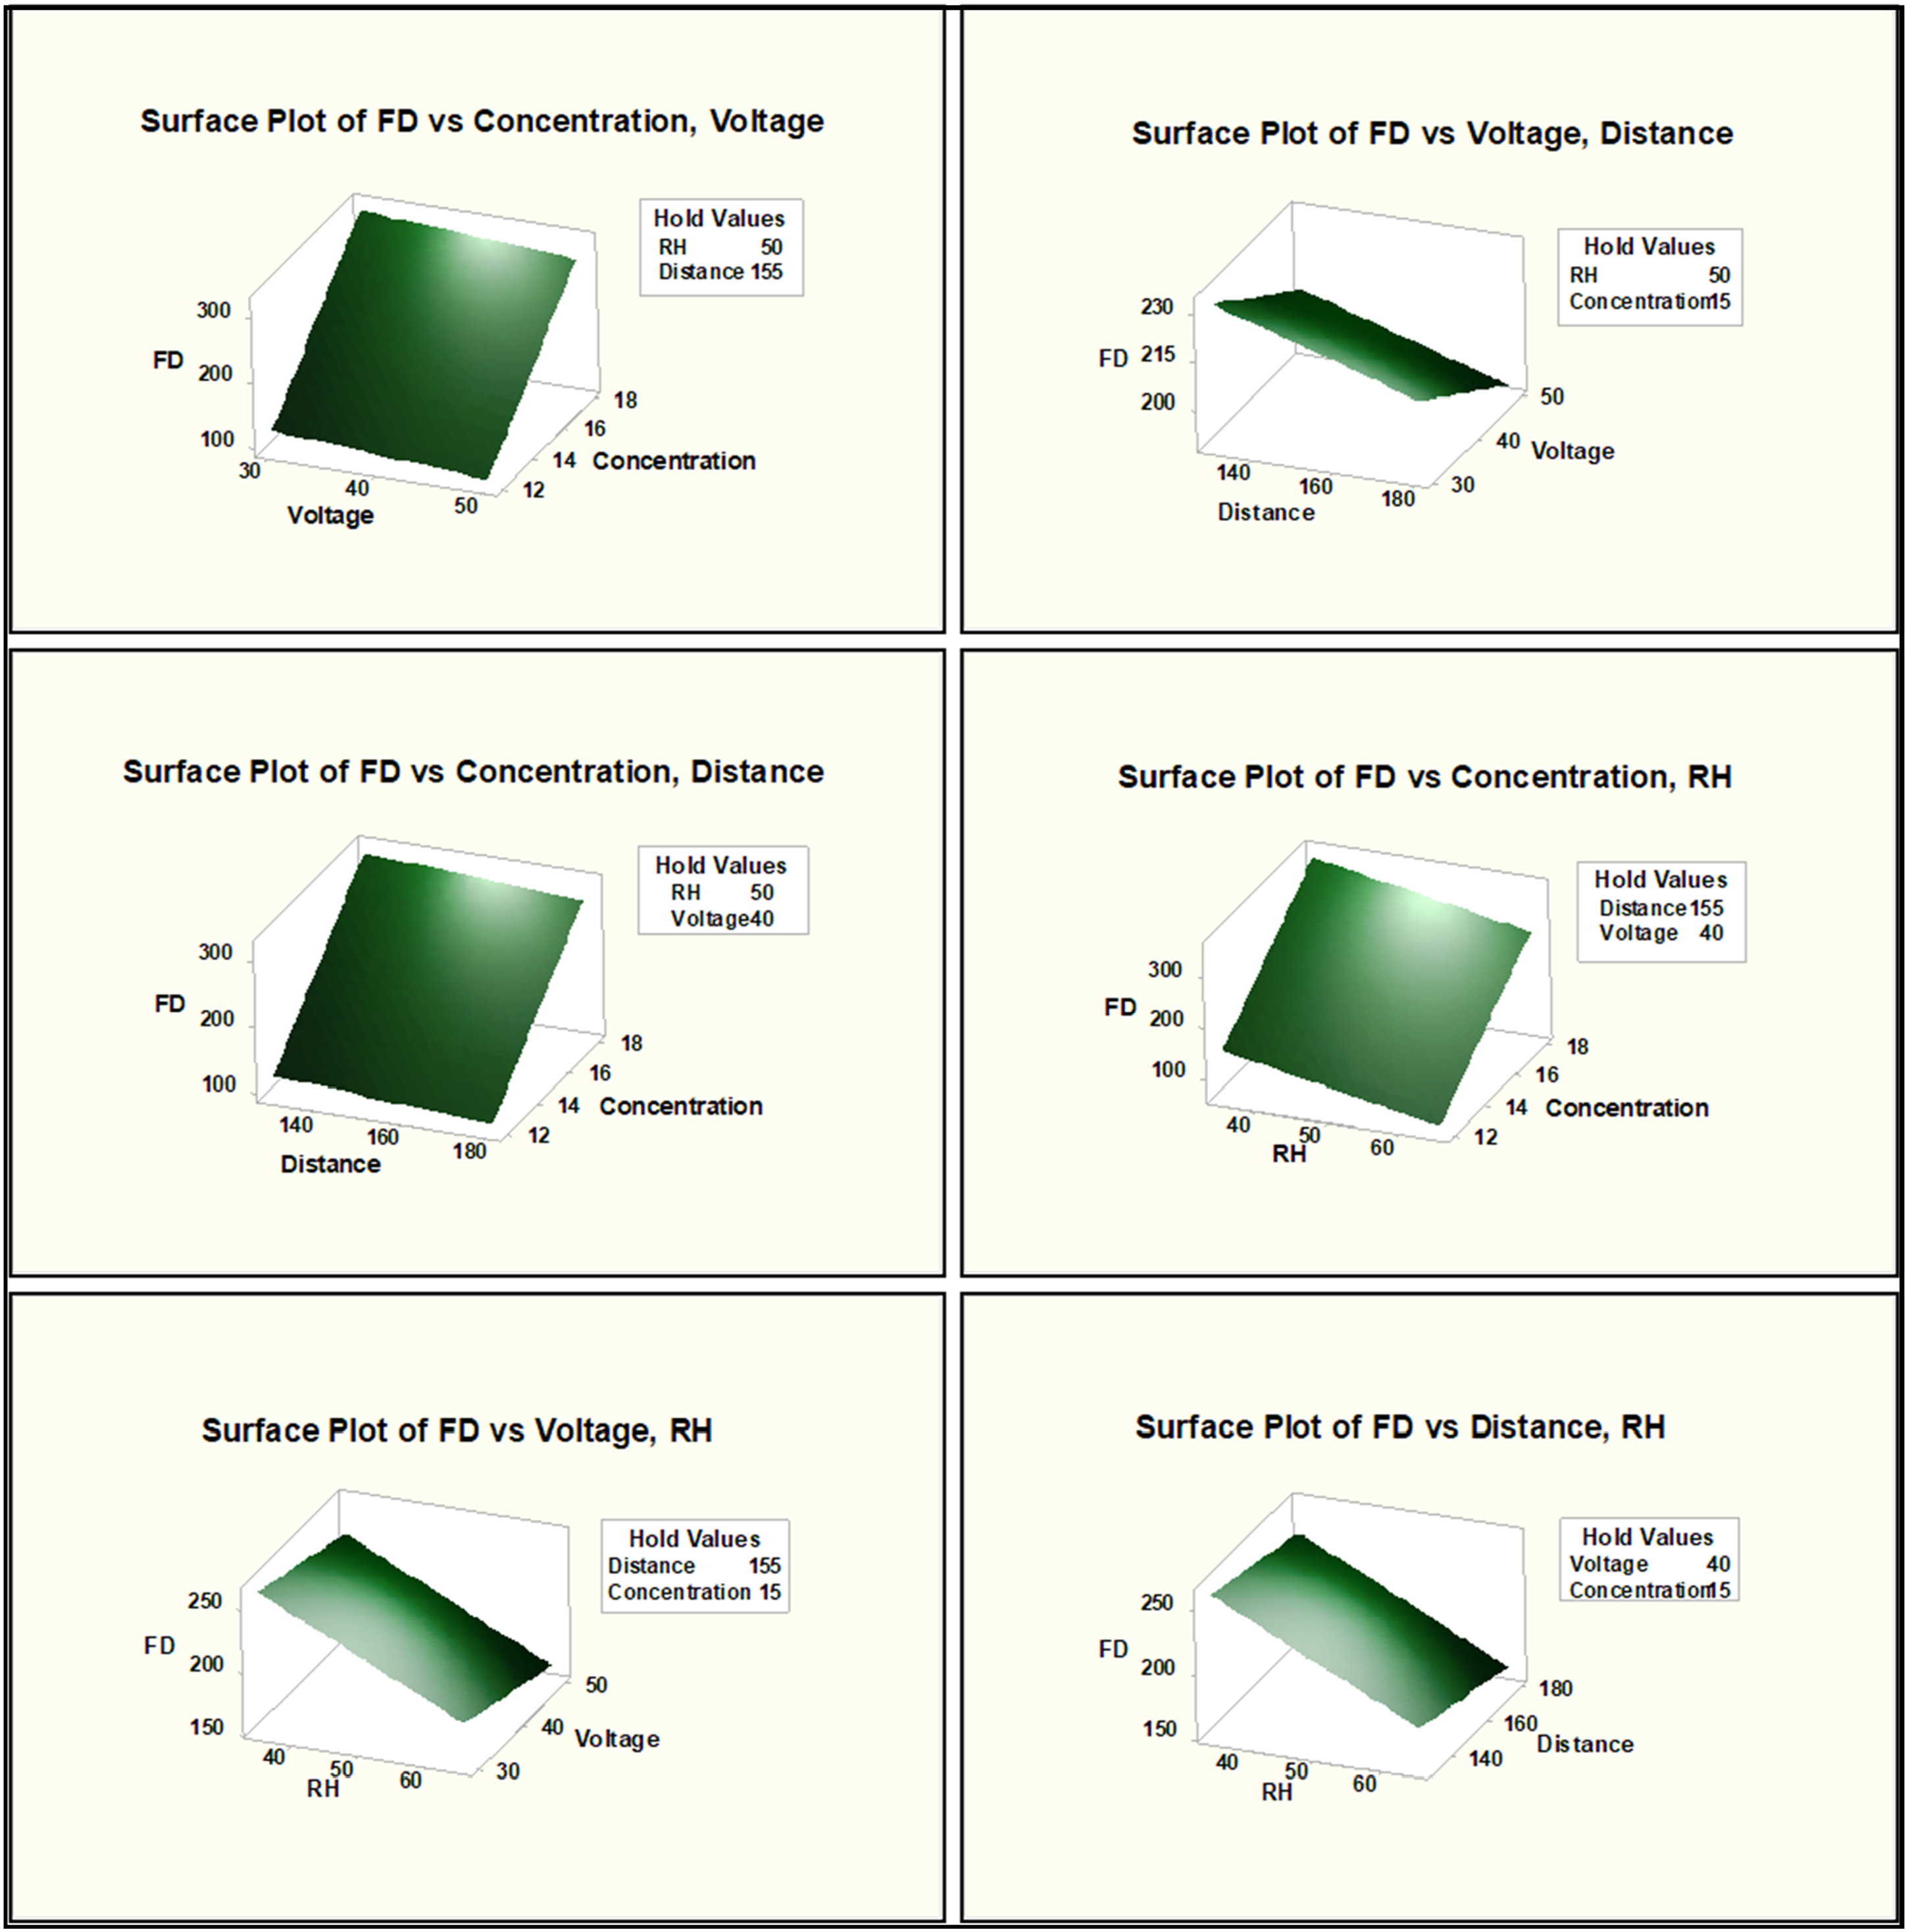


Finally, the bacterial filtration efficiency% of the developed five-layer facemask including optimized nanofiber membrane having a pore size of 0.6 ± 0.05 μm and without nanofiber membrane were evaluated against Staphylococcus Aureus ATCC 6538 bacteria as per the standard method, discussed in the previous section. The bacterial filtration efficiency% of the five-layer facemask including nanofiber membrane was found to be 97.5% compared to the 87.4% in the case of the control sample. Here, the bacterial filtration efficiency of the control sample resembles the value reported in the study conducted by Supratik Guha et al. In their study, they have reported the bacterial filtration efficiency% in the range of 80%–95% for the multiple layers and a specific combination of different fabrics against below and above 3 μm aerosol size [20]. However, our study revealed that the bacterial filtration efficiency significantly improves by incorporating a nanofiber membrane between the fabric layers.
Conclusions
In this paper, the central composite design and application of response surface methodology are used to optimize four operating variables such as concentration of the polymeric solution, applied positive voltage, the distance between two electrodes, and RH% to find the finest nanofiber diameter. All studied parameters showed a significant effect in a different order on the Nylon 6 nanofiber diameter. Fiber diameter was found to be increased with an increase in concentration and decreased with other parameters such as RH%, voltage, and distance. Based on the surface response and contour plots, the combined effect of the optimum set of values such as 12 wt% of polymer solution, 65% RH, 155 mm distance between two electrodes, and 40 kV are found to be most significant for obtaining the finest Nylon 6 nanofiber diameter than any other interactive effects. Pareto chart of the optimized conditions showed the effects of concentration of the polymeric solution, RH%, the distance between electrodes, and applied positive voltage in the decreasing order. The prepared facemask with nanofiber membrane has shown 97.5% bacterial filtration efficiency compared to 87.4% for a control sample against Staphylococcus Aureus ATCC 6538 bacteria.
Footnotes
Acknowledgments
The authors acknowledgethe Ministry of Textiles, Govt. of India for the financial support, and Dr. A.K. Mukhopadhyay former Director of BTRA, Mumbai for his valuable suggestions.
Declaration of conflicting interests
The author(s) declared no potential conflicts of interest with respect to the research, authorship, and/or publication of this article.
Funding
The author(s) disclosed receipt of the following financial support for the research, authorship, and/or publication of this article: This work was supported by the The Ministry of Textiles, Govt. of India.