
Abstract
In this article, the electrospinning process for Silica nanoparticles reinforced Nylon 6 nanofiber composite mats is investigated. More specifically, the effect of Nylon 6/Formic Acid concentration and silica weight fraction on the solution viscosity and the properties of the end product is studied. Rheological measurements were conducted to investigate the solutions’ viscosity, and scanning electron microscope was used to characterize the morphology and dimensions of the nanofibers. Energy dispersion X-ray was used to prove that silica nanoparticles are well distributed within the nanofibers. Finally, surface roughness and porosity of the mats were measured. It was found that when Nylon 6/Formic Acid concentration increased from 15 to 20 wt%, solution viscosity increased by 0.63 Pa·s, which leads to the increase in average fiber diameter from 103 to 160 nm. Also, when silica increased by 6%, highest viscosity increase was 0.1 Pa·s, while average fiber diameter increased for around 5 nm. In addition, protuberances or small silica beads are observed when silica weight fraction is increased above a critical value. The porosity remains unchanged while surface roughness increased by increasing silica weight fraction and decreasing Nylon 6 concentration. This study outlines the successful fabrication of bead-free Silica reinforced Nylon 6 nanofibers and their mats via electrospinning. Good control over processing parameters results in tailorability of size, morphology, and surface roughness of the end products.
Introduction
Due to the high surface-to-volume ratio and good physical properties of polymeric nanofibers, they are widely used in various applications such as micro-filtration, protective clothing, and optical sensor. 1 There are various techniques to produce polymeric fibers and nanofibers, including solution spinning, 2 drawing, 3 self-assembly, 4 and electrospinning. 5 Among them, electrospinning is regarded as the most versatile and tailorable technique because it offers the ability to produce ultrathin nanofibers with diameters ranging from tens of micrometers to several nanometers. 6
Polystyrene (PS), 7 Poly(vinyl alcohol) (PVA), 8 Polyvinylidene fluoride (PVDF), 9 and Polyamide 6 (PA6, also known as Nylon 6®)10–14 are some of the common examples of thermoplastic polymers used in electrospun fiber formation. Among these, Nylon 6 is an important polymer due to its biocompatible nature and good physical and mechanical properties. It is also one of the most commonly utilized polymers around the world. A number of researchers10–14 have demonstrated the ability of forming Nylon 6 nanofibers in the range of 100 to 300 nm diameter, and the electrospun Nylon 6 nanofiber mats are widely used in applications such as tissue engineering, 15 wound healing, 16 and filtration. 17
In electrospinning, fibers are often reinforced with nanoparticles to increase the mechanical properties or to tailor physical or chemical properties of the fibers and their mats. With the embedment of nanoparticles, the mechanical, physical, and chemical properties can be enhanced and specific applications can be targeted.18–22 In many applications such as filtration and tissue engineering, tunable wettability is an ideal property. However, the wettability of Nylon 6 nanofiber mats is not widely studied in the literature with the exception of few publications. Affandi et al. 23 categorized electrospun Nylon 6 nanofiber mats as a hydrophilic material since it exhibited contact angle of 42° ± 2°. However, Abdal-Hay et al. 24 found that Nylon 6 nanofiber mats is hydrophobic, as it shows a contact angle of 132° ± 3°. The results are completely different in those two literatures.
Silicon dioxide (Silica) nanoparticles have been widely used in electrospun composite nanofibers due to its biocompatibility, filtration ability, and tunable size.25–29 Although Nylon 6/Silica composites have been successfully synthesized for the application of solid phase micro-extraction, 30 there are only limited papers that studied the Nylon 6/Silica composite nanofibers. Islam et al. 31 fabricated polyvinyl acetate coated Nylon 6/Silica nanocomposite membrane for oil–water separation, but they did not discuss the effect of parameters on the morphology of the nanocomposites. Shi et al. 32 fabricated Nylon 6/Silica nanocomposites using 2,2,2-tri-fluoroethanol (TFE) as the solvent; however, the electrospinning parameters were not even presented. Ali Aghakhani et al. 33 synthesized silica nanoparticles by themselves and embedded the nanoparticles into Nylon 6 nanofibers. But the diameter of the synthesized silica nanoparticles is three times larger than that of the Nylon 6 nanofibers, so silica nanoparticles are not well distributed in the fibers and only bead-on-string morphology was created. None of them investigated the Nylon 6 concentration and silica weight fraction on the morphology of the nanocomposites.
Consequently, the present study investigates the fabrication and characterization of Silica reinforced Nylon 6 nanocomposites. In particular, the effect of Silica to Nylon 6 ratio (silica weight fraction) is investigated to obtain smooth, non-beaded nanofibers. Morphology of the fibers and their mats were characterized macroscopically and microscopically. The work in this article offers a guidance for fabrication of Nylon 6/Silica nanocomposites, and it is a preparation of making fibrous nanocomposites with tunable wettability, which will be presented in another paper.
Methodology
Raw material
PA6 was obtained from Sigma-Aldrich Canada Co., Oakville, ON, Canada (product #181110). The molecular weight of the Nylon 6 was 10,000 g·mol–1 and the bulk density was 1.084 g·mL–1. Formic acid with a purity of 88% was obtained from Fisher Scientific, Ottawa, ON, Canada (product #A118P-500). Silicon dioxide (Silica) nanoparticles were obtained from Sigma-Aldrich Canada Co. (product #637238). The average density of silica nanoparticles was 2.4 g·mL–1. All materials were used as obtained without further treatment.
Solution preparation
Formic acid was added into the container with premeasured amount of Nylon 6 and silica nanoparticles. After that, the container was sealed with Teflon tape to avoid the evaporation of formic acid. The prepared solutions were stirred with a magnetic stir bar under room temperature for 24 h until all the Nylon 6 pellets were dissolved. Finally, the solutions were sonicated for 1 h to ensure full dispersion of silica nanoparticles. Solution with four levels of silica weight fraction (including 0%) and solution with three levels of Nylon 6 concentration were prepared in the present work, as shown in Table 1.
Solution recipes and codings.
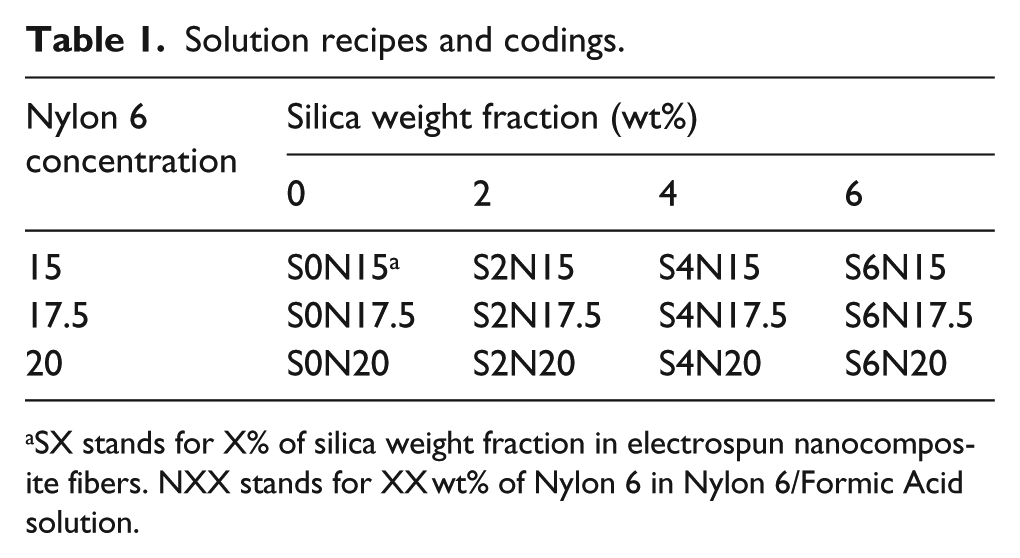
SX stands for X% of silica weight fraction in electrospun nanocomposite fibers. NXX stands for XX wt% of Nylon 6 in Nylon 6/Formic Acid solution.
Viscosity measurement
The viscosity of the solutions was measured with Rheometer (RheolabQC, Anton Paar, Austria) coupled to refrigerated/heating circulator (F12, Julabo GmbH, Austria). The measurement system was a double-cylinder measuring cup (DG42, Anton Paar). Before the measurement, the solutions were sonicated for 5 min to ensure full dispersion; 20 mL of the sample solution was poured into the measuring cup and the measuring system was sealed with parafilm to avoid the effect of formic acid evaporation. For each measurement, shear rate was set to increase gradually from 20 to 100 s–1 and the corresponding dynamic viscosity was plotted against shear rate.
Electrospinning process
Before the electrospinning process, the solution was sonicated for another 5 min to ensure full dispersion. Then the prepared solutions were filled into 10 mL syringes with eccentric tips (305482, BD Canada, Mississauga, ON, Canada) and placed on a syringe pump (Legato 101, GENEQ, Inc., Montreal, QC, Canada). Needles (305178 BD Canada) were blunted with a rotationary cutting tool and connected to the syringe. The collector of the electrospun nanofiber mats was a flat square metal plate with side length of 15 cm covered with aluminum foil. The tip-to-collector distance was fixed at 10 cm and the pumping rate was fixed at 2 µL min–1. The electrospinning voltage was controlled by a high voltage supply (model ES30P-5W/DDPM, Gamma High Voltage Research, Inc., Ormond Beach, FL, USA) and set to 24 kV for all the electrospinning process. The positive electrode was clamped on the needle and the negative one was clamped on the collector. Each sample was electrospun for 30 min to ensure that the thickness of the mat after peeling off from the aluminum foil would be in the range of 15 to 20 µm. All the tests and characterizations were done at the central region of the collected area.
Field emission scanning electron microscope characterization
The nanostructures of the fibrous nanocomposite mats were analyzed with a field emission scanning electron microscope (Zeiss Sigma FESEM, ZEISS, Germany) featured with GEMINI column with energy dispersion X-ray (EDX). All nanocomposite samples were coated with carbon with a thickness of 6 nm by Leica ACE600 Carbon/Metal coater. EDX is used to proof the existence of silica nanoparticles.
For fiber diameter measurement, three samples for each solution recipe were made in random order. On each sample, five locations near the center of the collected area were chosen. The magnification rate was set to be 20,000. Fiber diameters were measured with ImageJ software and 100 measurements were randomly chosen for each sample, that is, each location will take 20 measurements. Statistical analysis of variance (ANOVA) was used to determine whether average fiber diameters varied by different Nylon 6 concentrations, as well as by the addition of silica nanoparticles. The null hypothesis was that there is no difference and the significance level α was set to be 0.01.
Porosity measurement
The samples for porosity measurement were made for 1 h to gain measurable thickness. The porosity of the mat was determined by equation (1) 34

where

where
Therefore, with the help of equation (2), the density of each silica weight fraction is calculated and listed in Table 2.
Density,

Surface roughness measurement
Surface roughness was measured by a profilometer (Zygo Optical Profilometer, CT, USA). Three replicates for each solution recipe were taken for surface roughness measurement, and on each replicate, five points were randomly picked and measured. The magnification rate for object lens was 50, and the magnification rate for eye lens was 2. The field of view was 0.72 mm × 0.54 mm. The root mean square (RMS) of the assessed profile was used as the description of the measured surface roughness. The 15 measurements of one recipe were averaged as the final value of the roughness.
Results and discussion
Solution characterization
Viscosity is one of the key parameters that needs to be controlled for successful electrospinning. If the viscosity is too high or too low, the fibers will have defects or the electrospinning process will not occur. 10 Figure 1 shows the viscosity versus shear rate data for Nylon 6—Silica/Formic Acid solutions. In this figure, the legend SXNYY represents the solution with YY wt% of Nylon 6 concentration and X% of silica weight fraction, which is the same as the coding for the solutions in the “Methodology” section of the article. As can be seen in Figure 1, the viscosity remains constant when shear rate increased gradually from 20 to 100 s–1. When Nylon 6 concentration increases, viscosity of the non-silica solutions rises steeply from ~0.35 to ~1 Pa·s. Comparing solutions with the same Nylon 6 concentration, the viscosity increases slightly by around 0.06 Pa·s when silica weight fraction increased from 0% to 6%. The reason accounting for this phenomenon is that viscosity is a measure of the internal resistance of a flowing liquid. 8 In the solutions studied here, the internal resistance is caused by the entanglement of Nylon 6 molecular chain and the inertias of the dispersed silica nanoparticles. Therefore, when Nylon 6 concentration is increased, there is more entanglement of Nylon 6 polymer chain; thus, the viscosity is higher. Also, when the amount of silica is increased, their inertias provide a small amount of extra resistance, which results in the slight increase in the viscosity.

Viscosity of the solutions.
Pure Nylon 6 nanofiber
In electrospun nanofibers, usually three types of morphologies can be achieved, namely, bead, bead-on-string, and smooth fibers. 35 Among these, super-thin, long, and smooth nanofibers are preferred in most applications. In Figure 2, the scanning electron microscopic (SEM) images of fibers obtained with different Nylon 6 concentrations are shown. Solution codings in Table 1 is used here to denote which solution recipe is used to fabricate the nanofibers shown in the SEM images. As can be seen in Figure 2, smooth, long, super-thin nanofibers are randomly distributed on the collector to form a non-woven porous mat.

SEM images of the pure Nylon 6 nanofibers: (a) SON15, (b) SON17.5, and (c) SON20.
The averaged fiber diameter with 95% confidence interval of pure Nylon 6 nanofibers is shown in Figure 3. When Nylon 6 concentration increased from 15 to 20 wt%, the average fiber diameter increased from 103 to 160 nm, while 95% confidence interval remains unchanged. Single-factor ANOVA with α = 0.01 was used to determine whether average fiber diameter varies by increasing Nylon 6 concentrations. The p-value of the test is less than 0.00001, which means that Nylon 6 concentration has a significant effect on average fiber diameter. The increasing trend of average fiber diameter results agrees with the viscosity measurements presented above, as higher viscosity will have more resistance on the elongation of the polymer material during electrospinning process. 10

Average fiber diameter with 95% confidence interval of pure Nylon 6 nanofibers.
An interesting structure that exists in Figure 2 is the ultrathin spider-net like structure that is randomly distributed between the normal nanofibers. This structure is seen particularly in Figure 2(c). The cause of this structure was investigated before, 31 and it was concluded that under high voltage, the amide groups of Nylon 6 are partially ionized in some regions of the solution. 31 In those partially ionized and degraded regions, the entanglement of the polymer chains is reduced, and thus, the viscosity is reduced. During the electrospinning process, those low viscosity regions form a surface with solvent-rich parts and Nylon-rich parts, and thus, phase separation occurs. 14 That is why in Figure 2, the spider-nets are covering and adhering to the fibers. Ding et al. 36 studied the bonding between spider-nets and nanofibers; they found that lower humidity can strengthen the bonding. In the present study, the relative humidity during electrospinning was very low (3%–5%). Therefore, the results agree with Ding’s work. 36 Kuo et al. 17 claimed that the precursors of ultrathin spider-net structures were those of ribbon-like fibers. They are stretched under large electrostatic forces, and phase separation occurs before they hit the collector. However, among all the figures that presented in this article, none of them can prove that those spider-nets were ribbon-like fibers during the start of the process. Kuo et al. 17 also mentioned that 60 days old solutions can have more spider-net structures during electrospinning process. However, in the present study, all the electrospinning processes were done within 7 days after the solution preparation. Therefore, no differences were found among the samples.
Nylon 6/Silica nanocomposite fibers
Figure 4 shows the fiber morphology and bead structure of the Nylon 6 nanofibers when 2%, 4%, and 6% of silica nanoparticles were reinforced. Similar to Figure 2, the solution codings are labeled below each SEM image. As can be seen in Figure 4, when silica weight fraction is increased up to 6%, smooth, long, super-thin nanofibers are still randomly distributed to form non-woven mats.

SEM images of the silica reinforced Nylon 6 nanocomposite fibers: (a) S2N15, (b) S2N17.5, (c) S2N20, (d) S4N15, (e) S4N17.5, (f) S4N20, (g) S6N15, (h) S6N17.5, and (i) S6N20.
However, under the limited imaging resolution, it is difficult to determine whether the nanoparticles are embedded on the fiber surface or within the fibers. EDX point analysis was used to prove the existence of silica nanoparticles along the fibers, as is shown in Figure 5(b), (d), and (e). The yellow solid spectrums are the spectrums taken from pure Nylon 6 nanofiber, which are used as references. As can be seen in Figure 5, the silicon (Si) peak exists in all the nonzero silica weight fraction samples, which means that the silica nanoparticles are well distributed in the nanofibers.

EDX point analysis spectrum of the mats electrospun by different Nylon 6/Formic Acid concentration: (a) N15 bead comparison, (b) N15 fiber comparison, (c) N17.5 bead comparison, (d) N17.5 fiber comparison, and (e) N20 comparison.
Summarized fiber diameter with 95% confidence interval of the nanocomposite mats is shown in Figure 6. Single-factor ANOVA with α = 0.01 is also used to determine whether the increasing silica weight fraction would affect the average fiber diameter of the Nylon 6/Silica nanocomposite fibers. The p-value of increasing silica weight fraction on average fiber diameter is 0.000014, 0.04078, and 0.12447 for 15, 17.5 and 20 wt% of Nylon 6 concentrations, respectively. It means that for 17.5 and 20 wt% of Nylon 6 concentrations, the increasing silica weight fraction up to 6% does not have a significant effect on the fiber diameter. But for 15 wt% Nylon 6 concentration, the same proportion of silica nanoparticles made a statistical difference on the average fiber diameter. More specifically, the average fiber diameter remains unchanged at 2% and 4% silica weight fraction but increases to 109 nm when 6% of silica is added. A possible explanation is that there might be a threshold value of silica weight fraction for each Nylon 6 concentration. When silica weight fraction is less than this threshold value, the entanglement of the Nylon 6 polymer chain is not affected by the silica dispersion, and the increasing viscosity is only due to the inertias of the silica nanoparticles. When the silica weight fraction exceeds the threshold values, the silica nanoparticle dispersion starts to affect the entanglement of the polymer chain, and thus, the fiber diameter is increased. Another quick test was done using S20N20 solution, which means that 20% of silica nanoparticles were added into the solution of 20 wt% Nylon 6/Formic Acid. It was found that the average fiber diameter increased to 187 nm as expected. Unfortunately, in S20N20, the fiber surface becomes rough, and the aggregation of silica nanoparticles is severe. The internal mechanism of this threshold value is worth to be studied in the future.

Average fiber diameter with 95% confidence interval of the silica reinforced Nylon 6 nanofibers.
Similar to the non-reinforced cases, spider-net structures can be observed when silica nanoparticles are added (Figure 4). The size, density, morphology, and covering area of the spider-net structures are still random with no relationship to the silica addition. As is illustrated before, the spider-net structure is due to the ionization and degradation of Nylon 6 polymer chain. The silica nanoparticles are insoluble in formic acid and they are also non-conductive. Hence, the ionization of Nylon 6 has not been influenced during the electrospinning process.
Another interesting phenomenon is the bead formation when silica nanoparticles are added. As is indicated by the orange arrows in Figure 4, the silica beads were formed randomly in the entire nanocomposite mats. They are penetrated by the nanofibers, but the fiber diameter and morphology were not affected. The size and density of the beads have an upward trend with the increasing silica weight fraction. In 15 and 17.5 wt% Nylon 6 concentration, small beads start to occur when silica weight fraction was only 2%, as is shown in Figure 4(a) and (b).
EDX point analysis was also done on those beads, as is illustrated in Figure 5(a) and (c), in which the solid yellow spectrums are still pure Nylon 6 nanofibers. From the figures, silicon (Si) peak height rises steeply with the increasing silica weight fraction. For the samples with 20 wt% Nylon 6 concentration, no significant difference was discovered when silica weight fraction increased up to 4%, and only some protuberances appear on the fibers with 6% silica weight fraction, as is shown by the arrows in Figure 4(i). With the help of EDX point analysis in Figure 5(e) and EDX map analysis in Figure 7, it can be proved that the silica nanoparticles were distributed in the fibers but did not form beads in the mats made by 20 wt% Nylon 6 concentration.

EDX map analysis spectrum of the mats electrospun by 20 wt% Nylon 6/Formic Acid with different silica weight fraction: (a) S2N20, (b) S4N20, and (c) S6N20.
From the above-mentioned results, it can be concluded that fibers made from lower Nylon 6 concentration are easy to be changed by silica addition. When Nylon 6 concentration is 15 wt%, 2% of silica is enough to create beads. But when Nylon 6 concentration is increased to 20 wt%, only protuberances were occurred until 6% of silica nanoparticles are added. In other words, when silica nanoparticles are added into the solutions to produce Nylon 6/Silica nanocomposites, there is a critical capacity that the Nylon 6 nanofibers could accommodate them. The critical capacity value is positively correlated to the average fiber diameter of the nanofibers. When the amount of silica exceeds this critical value, beads and protuberances start to occur. From the results in this article, the critical value for 20 wt% Nylon 6 concentration is more than 4% but less than 6%. For 15 and 17.5 wt% Nylon 6 concentration, the critical value is less than 2% of silica weight fraction. Future work can be done to determine this critical value and investigate its internal mechanism.
Porosity
Porosity is the measurement of proportion of voids in a certain material and it is one of the most important parameters for applications such as tissue engineering 15 and filtration. 17 As can be seen in Figure 8, the porosity of the electrospun mats remains at around 83% for all the solutions, and the standard deviations of the porosity measurement are small and consistent. It means the electrospun mats are highly porous and the porosity value is not affected either by Nylon 6 concentration or by silica weight fraction. Although higher Nylon 6 concentration will deposit more mass of fibers on the collector, the volume of the mats is also increased due to the increasing spreading area. The reason for the rise of spreading area might be that solutions with higher Nylon 6 concentration have more charges so that the solution will experience more electric force in the electric field. As a result, the density of the mats is not affected, and thus, the porosity remains unchanged. As for the silica addition, Ding et al. 26 discovered that the addition of nanoparticles will create more nano-cracks within the fibers. However, in this case, when silica weight fraction is lower than 6%, the volume of created cracks was too small comparing with the space between the nanofibers. Therefore, the porosity was also not affected by the silica addition.

Porosity of the electrospun mats.
Surface roughness
Surface roughness is a quantification of the deviation of a real surface from an ideal flat surface. Other than material chemical structure, surface roughness is the most important parameter to determine the wettability of a material. As can be seen in Figure 9, surface roughness increases with the increasing of silica weight fraction, regardless of the Nylon 6 concentration. The reason is that the addition of silica nanoparticles introduced more complexity and variation of the nanofibers such as beads and protuberances.

Surface roughness of electrospun mats.
Another interesting phenomenon in Figure 9 is that the mats’ surface roughness of 17.5 and 20 wt% Nylon 6 concentration is close but the surface roughness of 15 wt% is significantly higher than both. There might be two reasons accounting for this phenomenon. First, lower Nylon 6 concentration gives thinner fibers. As is illustrated in Figure 10, when a second layer of fibers is deposited onto the first layer, thinner fibers may tend to bend more; thus, the mat’s surface deviates more from the flat surface. However, this is not the main reason since the fiber diameter is in the range of 100 to 250 nm. Hence, the change of mats’ surface roughness caused by the change of fiber diameter is limited. The second reason is that some portions with flat or semi-flat fibers were discovered from time to time in the samples made from 15 wt% of Nylon 6 concentration and these portions introduced heterogeneity of the surface. In these portions, there used to be smooth fibers but when unevaporated solvent was flying to them, the fibers were flattened by the solvent. This is considered as the main reason of the significantly high surface roughness of the mats made from 15 wt% of Nylon 6 solutions.

Schematic representation explaining the potential change in mats’ surface roughness with respect to fiber diameter: (a) thicker fibers and (b) thinner fibers.
Conclusion
In this article, electrospun mats of Nylon 6/Silica nanocomposite fibers were successfully fabricated. The microscopic and macroscopic characterization were done on the electrospun samples. It was discovered that when silica nanoparticles were not added into the solutions, all three Nylon 6 concentrations could produce smooth nanofibers and the fiber diameter increased from 103 ± 11 to 160 ± 15 nm. The effect of silica addition on the average fiber diameter of the mats was also investigated. For 17.5 and 20 wt% of Nylon 6 concentrations, the average fiber diameter was not affected when silica nanoparticles were increased up to 6%. However, for 15 wt% Nylon 6 concentration, the average fiber diameter remains unchanged when 2% and 4% of silica nanoparticles were added, but it increased to 109 ± 9 nm when 6% of silica nanoparticles were added. Bead formation was also investigated in this article. With the addition of silica nanoparticles, 15 and 17.5 wt% started to form some aggregated silica beads at 2% silica weight fraction. However, 20 wt% Nylon 6 concentration did not show any beads until 6% of silica nanoparticles were added. Surface roughness and porosity were also characterized and controlled. The surface roughness increased with the increase in silica weight fraction while decreased with the rise in Nylon 6 concentration. These two parameters are essential to the tunable wettability of electrospun fibrous Nylon 6/Silica nanocomposites, which will be discussed in another paper.
Footnotes
Declaration of conflicting interests
The author(s) declared no potential conflicts of interest with respect to the research, authorship, and/or publication of this article.
Funding
The author(s) disclosed receipt of the following financial support for the research, authorship, and/or publication of this article: The authors would like to thank Discovery Grants of Natural Sciences and Engineering Research Council (NSERC) of Canada for funding.