
Abstract
During an operation, the turnout gear for firefighters must meet two important requirements: thermal protection and comfort. As comfort and protection are inherently incompatible, it is impossible to satisfy both. As part of this study, the outer layer of multilayered turnout suits was analyzed under the influence of various factors such as intensity of heat flux, pick density, and air space between the fabric and the sensor. Choosing Nomex IIIA was based on its inherent properties that are conductive to thermal protection. To simulate the environment encountered during firefighting, benchtop experiments were designed. A system equation for the prediction of the protection time (t-protection) was developed based on a three-factor and three-level Box–Behnken model. The predicted values of t-protection obtained for all the experimental blocks in the design space were subjected to ANOVA analysis which showed that the system equation, as well as the coefficients of linear interactive and square terms, is significant, so the system equation can be efficiently used for predicting t-protection. The validity of the system equation was verified by using the same experimental blocks and estimating t-protection using the Stoll criteria. The accuracy of the system equation was checked by comparing t-protection and t*-protection which revealed a linear relationship with a high correlation coefficient (R2 = 0.975). To analyze the effects of the independent variables on protection time, 3D surface response curves were created. The nature of the surfaces was critically analyzed by developing regression equations for the contours and the diagonals.
Introduction
There are three types of fires that define the thermal environment prevailing in the active workplace: routine, hazardous, and emergency.1,2 The intensity of heat and the mode of its propagation determines the risk of burn injuries.3–5 Burns and heat exhaustion are two primary threats in high-risk zones, and secondary effects resulting from the fire pose additional health risks. 6 Given these factors, a high level of preparedness is solicited to meet all challenges. To modernize the existing firefighting technologies, road maps based on current knowledge must be explored.7,8 Flame retardant, eco-friendly biopolymer, 9 and other green technologies should be explored for commercial applications.10–12
Turnout suits worn by the firefighters are multilayer ensembles of functional fabrics comprising the outer fabric (shell fabric), a middle layer (moisture barrier), and an inner fabric (thermal liner)
13
(vide Figure 1). The outer shell fabric gives protection from thermal injuries, trauma, and toxic fumes
14
and therefore must possess high heat resistance, improved thermal release rate, and robust mechanical properties.
15
The middle, inner, and fourth layers (face fabric) serve other functions7,16 and additional layers are used as undergarments.
13
Depending on the function of layers, various types of woven and non-woven fabrics are used in multilayer ensembles.17,18 Several synthetic fibers are known that can satisfy the stringent standards mentioned above. As a substitute for conventional outer shell fabrics, Shalev
19
identified a few natural fibers modified with FR chemicals. The aramid fibers, such as Kevlar® and Nomex®, possess unique characteristics that differentiate them from other FR fibers.
20
Their advantage is in the high LOI numbers (28–31) which directly relate resistance to burning and thermal insulation.
21
These numbers are used to estimate their thermal resistance (see Figure 2). Schematic diagram of various layers of Fire Protective Clothing. Limiting oxygen index (LOI) values of different categories of fibers
21


Fire accidents present two fundamental challenges: first, skin burn injuries caused by intense heat and second, metabolic heat stress. These have mutually opposite characteristics because efforts to address the former issue usually result in physiological discomfort.
22
Major technological breakthroughs have been achieved to address the basic challenges. The advanced technologies include introduction of liquid crystal polymers (Zylon®), aluminized surface for improved heat blocking efficiency, foamed silicone (GoreTex®),
It emerges from the above discussions that the major thrust of thermal distress and mechanical stresses is absorbed by the outer shell fabric. To combat this in real time, the shell fabric must possess high heat resistance and robust mechanical construction. The fraction of incident heat that penetrates through to the skin depends on a number of factors, including the intensity of the incident heat, the thread count of the fabric, and the air gap between the fabric and the skin. A number of researchers have proposed mathematical models to predict t-protection under different conditions of heat exposure. 17
In consideration of the facts stated above, the project was aimed to study the effects of factors like pick density of shell fabric, air gap (distance from the fabric and copper calorimeter), and the intensity of cumulative heat flux on the thermal performance of Nomex III fabric. An empirical relationship was established among these factors.
Experimental
Materials
The outer shell fabric used was derived from Nomex IIIA yarns (2-ply, 40 Ne count, produced in a ring spinning system) and directly procured from the manufacturer (Arvind Ltd. advance materials division, Gujarat). The fabric with plain-weave construction was woven on a handloom of weaver service center, Bharat Nagar, New Delhi. The weaving set was kept constant at 42 ends per inch (EPI) and three levels of 40, 46, and 52 picks per inch (PPI) to afford three categories of fabrics.
Methods
The physical properties of the Nomex IIIA fabric were evaluated according to the following test standards: ASTM D3776-09 (areal density),
26
ASTM D3775-12 (thread count),
27
ASTM D737-96 (air permeability),
28
and ASTM D1777-96 (fabric thickness).
29
The cover factor measured according to equation (1) describes the percentage area of the fabric covered by the yarn

C2 = weft cover factor = picks per inch/(weft count (Ne) ^1/2).
Radiant TPP tester
The thermal protection was evaluated with an indigenously developed test instrument, fabricated in conformity to the principles prescribed by the standard ASTM F 1939 (2008).
30
The TPP tester comprised a heating block, a sample holder, and a movable copper calorimeter, all housed in an open platform (see Figure 3). A series of quartz lamps mounted on a block of G10/FR4 glass-epoxy resin composite served as the source of radiant heat. The input terminal of the quartz lamps was connected to a regulated power supply to maintain the intensity of the radiative heat flux (Q) at the desired level. A thin film of RTD was coated on the backside of the calorimeter with the sensor to produce an electrical signal proportional to the incident heat flux. The output signal was fed to the attached computer via a data acquisition system (ADAM 4015 processer) and analyzed (Design Expert® software version 11) to calculate the cumulative heat sensed by the RTD sensor at any instant. The heat flux (in kW/m2), produced by the lamps, was calculated by using equation (2) Schematic diagram showing the various components of radiant protective performance Tester.

c = specific heat of copper (J/kg.K),
ΔT = final temp.-initial temp. (Kelvin),
A= area of the copper calorimeter (m2), and
Δt = final time-initial time (sec.).
The above relationship was based on the assumption that the absorptivity of the black paint coated on the copper calorimeter is 0.90. 31
The sample holder was loaded with the test specimen and placed between the heating lamps and the calorimeter. The air gap, “d” between the fabric and the copper calorimeter was adjusted by positioning the platform at the desired distance. Stoll criteria curve was obtained by running the tester without a sample and the corresponding cumulative heat was plotted as a function of time, using equation (3). The curve was used as a reference curve to estimate t-protection in subsequent experiments

Evaluation of protection time for fire-protective clothing
The protection time against radiant heat was evaluated by following the test method ISO 6942.
32
The copper calorimeter measured the rise in temperature on the unexposed surface of a given test specimen. The value of protection time corresponding to the point of intersection between two curves (shown in Figure 4) furnished the value of t-protection. It tells about the second-degree burn time of the clothing. Higher second-degree burn time indicates better fire retardancy and better protection from heat. The time-lapse between exposure of the fire-protective clothing to cumulative heat and injury on the opposite side was estimated. The term t*-protection referred to the experimentally determined value of t-protection. Stoll criteria curve (─── blue) and experimental plot (─── red) using cumulative heat as a function of time.
Design of experiment
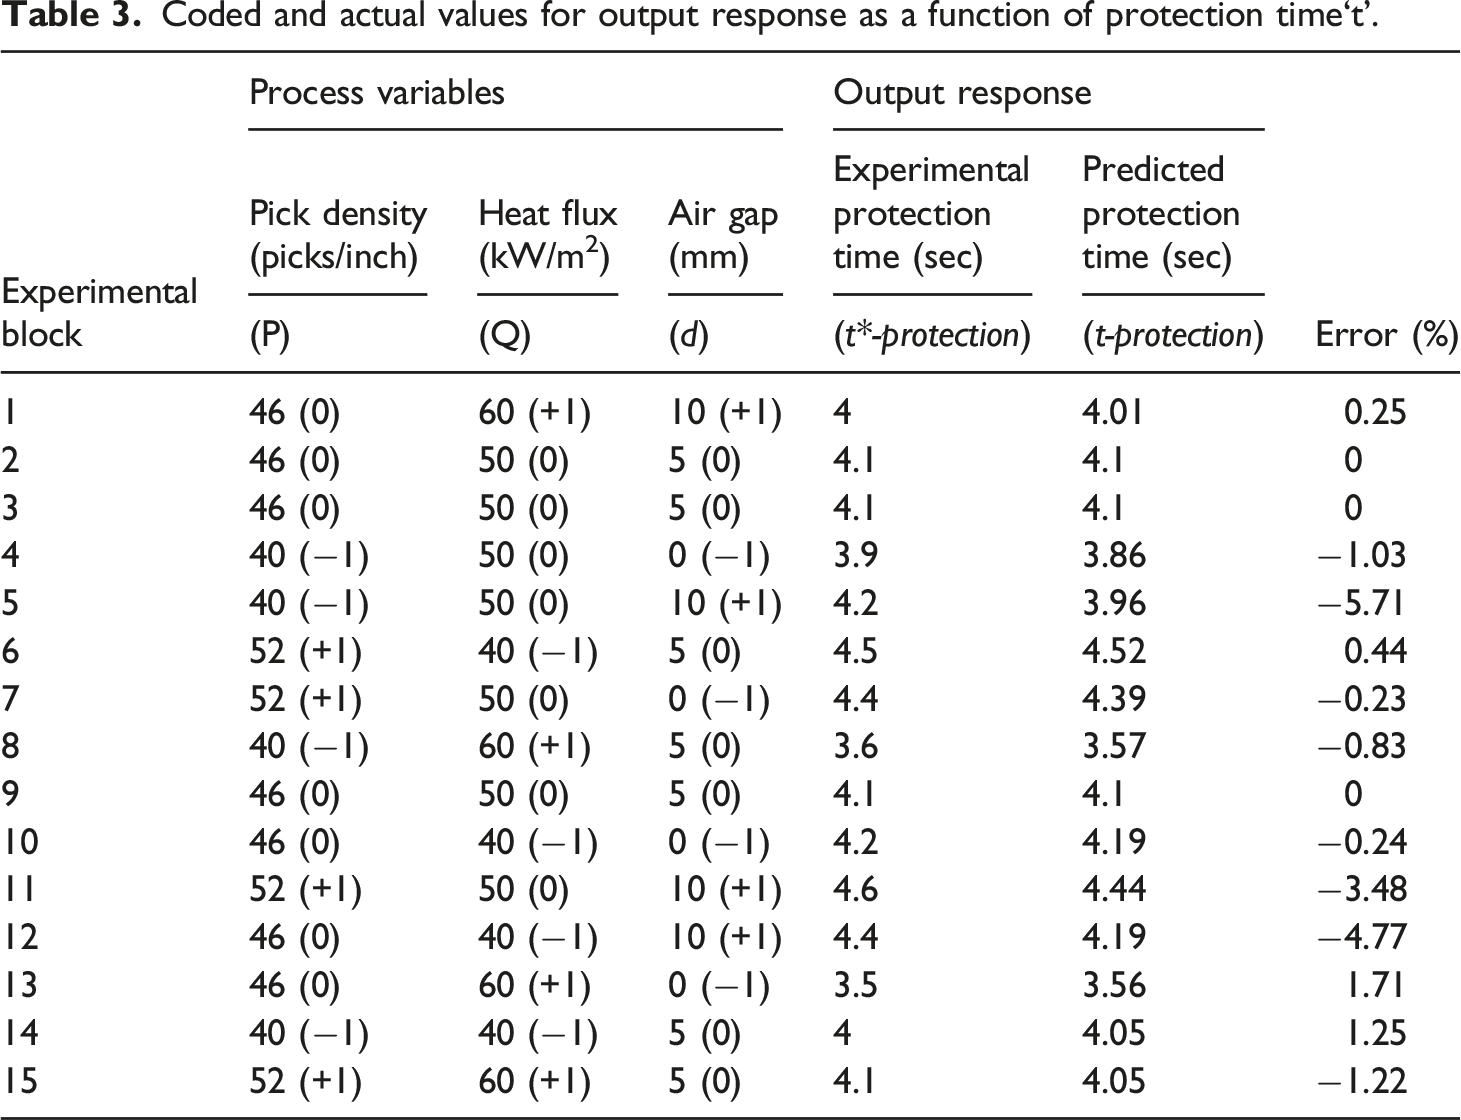
Box–Behnken design of experiment (BBD) was employed for the interpretation of the experimental data. The independent variables (or factors) selected for the experiments comprised (a) cumulative heat (Q) reaching the RTD sensor from the unexposed surface of the fabric, (b) the air gap “d” between the fabric and the sensor, and (c) the pick density (P) of the outer shell fabric at three levels for each factor. The cubical design space was populated by placing the twelve data levels at the middle of the edges of the cube, and one at the center (vide Figure 5). The selected three-level data points were assigned values: Q = 40, 50, and 60 kW/m2; d = 0, 5, and 10 mm; and P = 40, 46 and 52 picks per inch. Location of points corresponding to process variables in the design space of a three-factor Box-Behnken design.
35

Results and discussions
Selection of fabric for outer shell
The fire protection efficiency of TPC strongly depends on the intensity of heat flux incident on the outer surface of the shell fabric and the fraction of heat transported through the turnout suit to the skin. It was recognized that choosing the right fabric for the shell fabric was extremely important and care was taken to choose the right fabric. Eventually, it was decided to rely upon Nomex® IIIA, a fabric manufactured by blending Nomex®, Kevlar®, and anti-static fiber in a ratio of 95:3:2. This is because the fabric, due to its internal structural arrangement at the molecular level, provides outstanding thermal properties such as flame resistance, thermal protective performance, low specific heat, and low thermal conductivity. Apart from meeting these basic requirements as a material for turnout suits, this material also has highly desirable mechanical properties, including high durability, abrasion and tear resistance, tensile strength, elongation, and breathability. 33
Evaluation of physical properties of the outer shell fabric
Physical properties of fabrics.

Box–Behnken model
The rationale behind using the BBD model is to develop a mathematical equation. The equation allows a system to be optimized by requiring few experiments. Theoretically, a three-factor and three-level design should require 15 experimental blocks, including 3 combinations that overlap at the center, reducing the number of blocks to thirteen, 12 located on the middle of the edges and one in the center of the design space. In contrast, the central composite design (CCD) and the full factorial technique require 20 and 27 experiments, respectively. 34 Three-factor, three-level designs include linear, interaction, and square terms, resulting in a quadratic surface. There are several advantages of the BBD model—it can be used to interpret quadratic models, build sequential designs, identify lack of fit, and use blocks. It has been shown to be more efficient than three-level full factorial design or central composite design. Further, the prediction of the mathematical model and the interaction effect between the input parameters can help in obtaining more accurate results when compared to the results of a univariate study. The univariate analysis fails when the interaction effect is large since it does not consider the interaction effect.35,36
To qualify for a BBD model, there must be three factors and at least three levels coded as −1, 0, and +1 for each factor (see Figure 5). The data levels for each factor should be evenly spaced with the upper value above and the lower below the middle value so that each fits in a quadratic surface. In this way, a reasonable ratio of experimental points to the number of coefficients is maintained between 1.5 and 2.6. The missing data at the corners provide an opportunity to avoid experimental blocks at the extremes of the factors.
Based on the various advantages of the BBD model, this was deemed the most appropriate statistical tool for the present study. Each factor was evaluated at three different levels of high (+1), medium (−0), and low (−1) for output responses. By applying the BBD model, the second-degree polynomial can be expressed as
Customizing model
Box–Behnken design space with three process parameters at three levels.


Coded and actual values for output response as a function of protection time‘t’.
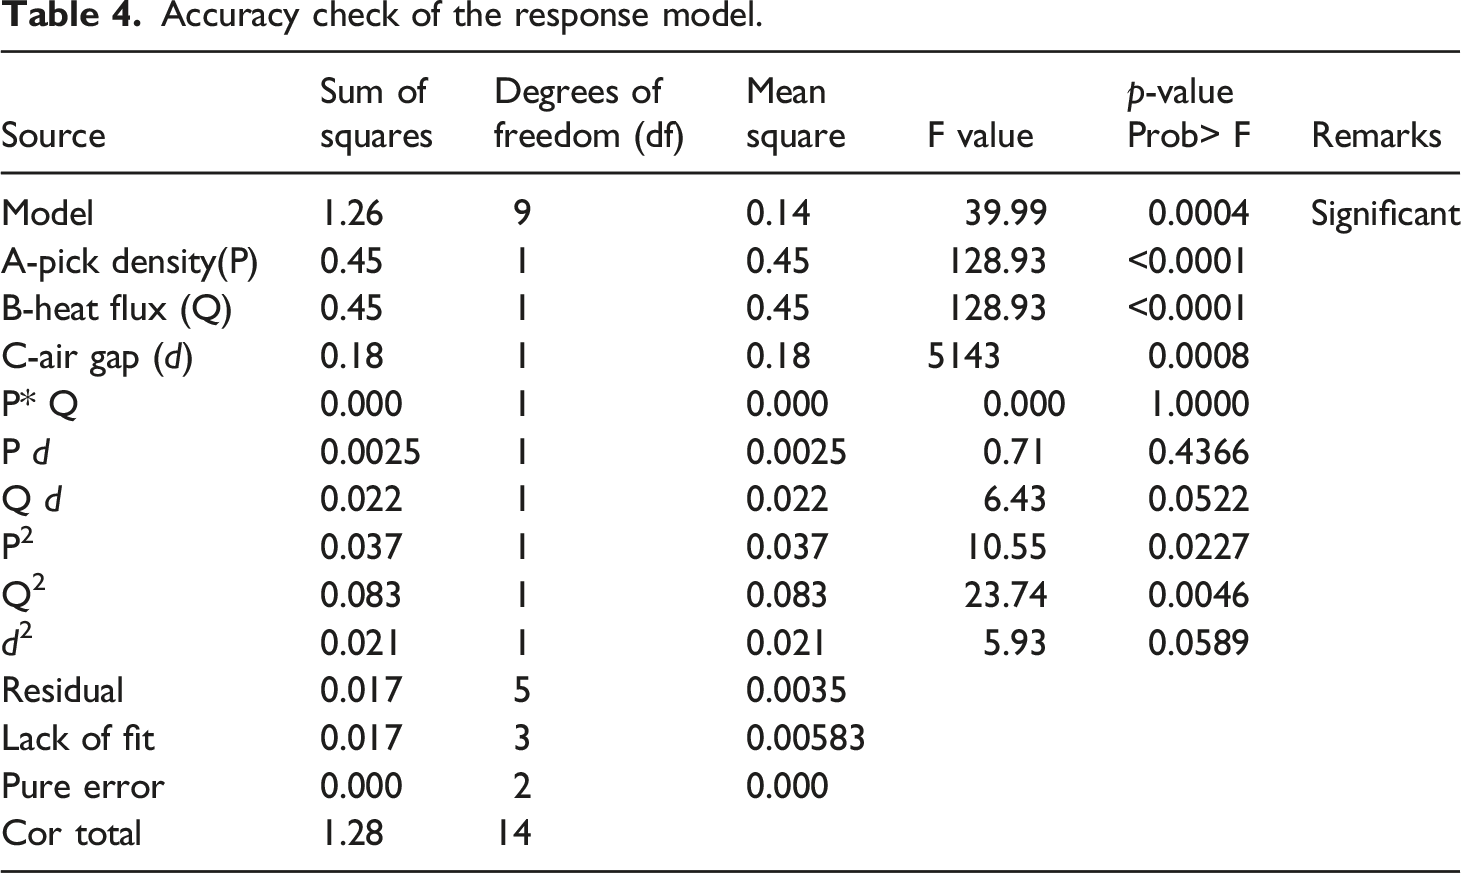
ANOVA analysis
Accuracy check of the response model.

Predicted protection time versus Actual protection time.
Two-factor response
Data reduction technique
The BBD model consists of three independent variables F1, F2, and F3 and a dependent variable (or response) t-protection. Since the model can address only two factors simultaneously. The three factors were analyzed sequentially with two factors (F1 and F2) analyzed first, while the third factor (F3) held at zero levels. 3D surfaces for the factors F1 and F2 at F3 (0), F2 and F3 at F1 (0), and F3 and F1 at F2 (0) were derived similarly (Figures 7–9). Due to a square term in the system equation, the 3D surfaces obtained were quadratic (or parabolic) surfaces that were truncated at their contours. Four corners were formed by the convergence of two contours. In the region enclosed by surfaces, the corner points c1 refers to F1 (−1), F2 (−1), and the rest, c2 to c4, are named in the clockwise direction. As a part of the methodology, a multi-parametric analysis was conducted by entering the levels of the two factors in appropriate sub-equation and determining the t-protection response. Analysis of PQ surface; (a) The output response t-protection for factors P and Q; Key:c1 = 4.03, c2 = 4.54, c3 = 4.56, c4 = 4.06, cX = 4.09; slopes (m), Analysis of Pd surface; (a)The output response t-protection for factors P and d; Key:c1 = 3.90, c2 = 4.45, c3 = 4.45, c4 = 3.99, cX = 4.10; slopes (m), Analysis of Qd surface; (a)The output response t-protection for factors Q and d; Key:c1 = 4.24, c2 = 3.61, c3 = 3.81, c4 = 4.13, cX = 4.09; slopes (m), 


The computed values of t-protection under different experimental conditions.

Notes: * The numbers in () indicate efficiency with respect to t- ref , ‘+’ signs indicate improvement, and ‘-’ signs deterioration in protection times. The numbers in [ ] show changes in efficiency between the pairs of isometric points.
Sub equations for the PQ surface at d = −1, 0, and 1 levels.

Values of constants (k), and coefficients of linear and square terms of equations (10–12).

Values of constants (k), and coefficients of linear and square terms of equations (13–15).

The efficiency (η) was calculated by the following equation (6)
Analysis of PQ surface
The following Table 6 shows three sub-equations (7-9) of PQ surfaces for low, medium, and high levels of d, as well as constants, coefficients of linear terms, and square terms of the factors P and Q. The PQ surface was created by using the middle value of d (vide Figure 7).
Based on three levels of air gap d, the table-5 illustrates the efficiency at the corners of the PQ surface. Observed data for block EB-A, EB1 indicated marginal improvement in t-protection, resulting in a 6% increase in overall efficiency over the span d (−1) to d (+1). There is a much greater gain for the pair of isothermal points (EB1, EB2 or EB3, EB4) at each level of d, showing that pick density greatly influences protection times (∼10.3–13.3%).
To understand the effect of varying the two factors simultaneously on protection time, a 3D surface was created for P and Q (Figure 7(a)). Using the responses at corner points c1-c4, the middle points of each contour, the intersections of diagonals (cX), and the locus of the lines were analyzed by forming regression equations for each line enclosed within the surface. Contours and diagonals all were found to obey second-degree polynomials, implying they are either convex or concave lines, passing through maximum or minimum, respectively (Figure 7(b)). The slopes of the
The observations shed light on the PQ surface, which can be visualized as a quadrangular surface c1c2c3c4. Corners c2 with the highest and c4 with the lowest protection illustrate that increased pick density at a given intensity of heat flux increases protection time. The t-protection is highly suppressed at corner c4 because of high Q and low P. The t-protection at corner c4 is greatly suppressed due to high Q and low P. Although Q at a high level has ill effects, high pick density just compensates for the loss at c3 when compared to c1.
The effect of the air gap on each combination of parameters at the corner is illustrated graphically in Figure 7(c) for block-A design space. All the protection times are longer with greater distance or pick density with the best protection time being EB2. Efficacy decreases in the order EB2 > EB1 > EB4 > EB 3.
Analysis of P-d surface
Table 7 shows three sub-equations (10-12) of Pd-surface for low, medium, and high levels of Q, as well as constants, coefficients of linear terms, and square terms of the factors P and d. 3D surface for P-d was created by using the middle value of Q (vide Figure 8).
The table above (Table 5) summarizes the protection times for Pd-surface at low, mid, and high levels of Q. There is a negative correlation between t-protection and Q along EB5-EB8, which severely reduces efficiency (η) between - 6.8% and −15.3% along each row. A pair of isometric points, however, exhibit positive η for both pick density and air gap indicating that both factors enhance η.
As shown in Figure 8(a), a 3D surface is obtained by plotting the responses of pick density and air gap at the middle (0) level (50 kW/m2) of heat flux. The resulting surface is partially quadratic surface because the opposite contours
Figure 8(a) shows how air gaps d and pick density P are positively correlated with t-protection, which improves as the level of these variables rises. By increasing P means thread counts per unit length and cover-factors increase but air permeability decreases (refer to Table 3), and less heat is allowed to pass through. The pick density partially offsets the negative impact of Q when the air gap is shorter, consequently, increasing the thermal insulation capacity.
The effect on t-protection affected by three levels of Q at the corner of each experimental block is illustrated graphically for the design space described in block EB-B in Figure 8(c). The trend lines show that the efficacy decreases in the order EB8> EB7> EB6> EB 5.
Analysis of Q-d surface
Table 8 shows three sub-equations (13-15) for the Q-d-surface at low, medium, and high levels of P, along with the values of constants, coefficients of linear terms, and square terms of the factors Q and d. 3D surface for Q-d was created by using the middle value of P (vide Figure 9).
The data presented in Table 5 for Q-d surface in block EB-C show that the level of P has a profound influence on the efficiency η, which ranges between ∼10-16% across a row for an increase in the levels of P from (−1) to (+1). This trend holds good for isometric pairs of combinations such as EB9, EB10 and EB11, EB12. The improvement of η, in this case, lies in the range of 2.2 to 14.5%.
Figure 9(a) illustrates the nature of 3D Surface obtained by using the responses of Q and d with P held at the middle level (p = 46 PPI). The Q-d-surface depicts the interrelationships between d, -Q and protection time. Q and d are inversely correlated with t-protection; higher Q reduces protection time, and longer air gaps improve it. On the surface, all contours and diagonals follow second-degree polynomials, except for contour
The responses at the corner of each experimental block are affected by three levels of P as illustrated graphically for the design space described in block EB-C in Figure 8(c). The trend lines show that the efficacy decreases in the order EB10 > EB9> EB12> EB 11.
Conclusion
The performance of a shell fabric constructed from Nomex IIIA yarns was evaluated using heat flux Q, pick density P, and air gap d between the fabric and sensor as independent variables and t-protection as a response. The experimental design was based on the Box–Behnken model. To forecast t-protection values, a system equation containing linear, interactive, and square terms was developed. ANOVA analysis was used to test the significance of the overall model and the coefficients of linear, interaction, and square terms. All are revealing a high level of significance and suggesting that the model is useful for predicting t-protection. The predicted and experimental values (obtained with the Stoll criteria curve) of the t-protection were linearly related with a high correlation coefficient (R2 = 0.975). In the experimental block Q (+1), P (−1), and d (−1), the t-protection was lowest (3.4 sec) and peaked at 4.71 sec when block Q (−1), P (+1), and d (+1) was used. Those two extremes form the boundaries of all t-protection values. Nearly 40% of the improvement was attributed to increases in t-protection values from lowest to highest. A 3D surface was created to understand the effect of the factors on protection time. The system equation was simplified to accommodate the responses at the corners. To understand the nature of the surface explicitly, regression equations for contours and the diagonals were developed. 2D graphs were drawn for responses at each corner of the surfaces using three levels of the third factor.
Footnotes
Declaration of conflicting interests
The author(s) declared no potential conflicts of interest with respect to the research, authorship, and/or publication of this article.
Funding
The author(s) received no financial support for the research, authorship, and/or publication of this article.