
Abstract
In this work, flexible thermoelectric fabrics, polyester/yarn fabrics coated with polyaniline/carbon nanotube (PANI/CNT) nanocomposite, were fabricated by sequential processing: (I) polyaniline/carbon nanotube nanocomposites preparation by a one-step in-situ polymerization and (II) dip coating of a mixture solution of CNT-doped PANI on a polyester/yarn fabric. Nanocomposites were synthesized with various CNT content (0.5, 2.5, 5, and 10 wt%) and characterized using different methods. The Seebeck coefficient and electrical conductivity measurements were used to determine their thermoelectric properties. The results revealed significant improvement in both electrical conductivity and the Seebeck coefficient with the addition of CNT. The electrical conductivity increased from 0.011 to 0.1345 S/cm with the increment of CNT from 0.5 to 10 wt%. The highest Seebeck coefficient of 11.4 μV/K was observed for the sample containing 5 wt% CNT at 338 K where the maximum power factor of 1.598×10⁻³ μWm−1K−2 was obtained for the fabric coated with nanocomposite containing 10 wt% CNT.
Introduction
Thermoelectric materials could be used to convert waste heat to electrical energy and vice versa; this process can provide ample benefits for producing a clean energy source without using any fossil fuel.1,2 This alternative energy source could potentially satisfy the high demand for manufacturing electronic devices which are wireless, portable, embedded, implantable, and self-powered. By using a flexible thermoelectric, better contact between the thermoelectric and surfaces brings about less thermal interface resistance, which would increase the temperature differential across the thermoelectric.
In order to estimate the materials thermoelectric energy conversion efficiency, the following dimensionless equation is used3,4


Manufacturing nanocomposites is a simple and promising method to optimize the conflicting thermoelectric parameters in order to enhance the transport features in thermoelectric materials by applying multi-improved phonon-scattering models.20-25 The Seebeck coefficient has been enhanced in many nanocomposites due to the energy-filtering effect, but at the cost of significant drop in their electrical conductivity due to excessive high-energy barriers. Therefore, optimizing energy barriers should be seriously considered in manufacturing nanocomposites. In this study, with this goal in mind, carbon nanotubes (CNT) were incorporated in polyaniline (PANI/CNT)–forming nanocomposites, and highly flexible polyester coated with these nanocomposites have been prepared to obtain optimal energy barriers and achieve high electrical conductivity as well as the Seebeck coefficient (Figure 1). Schematic of polyaniline/carbon nanotube–coated fabrics in the preparation process.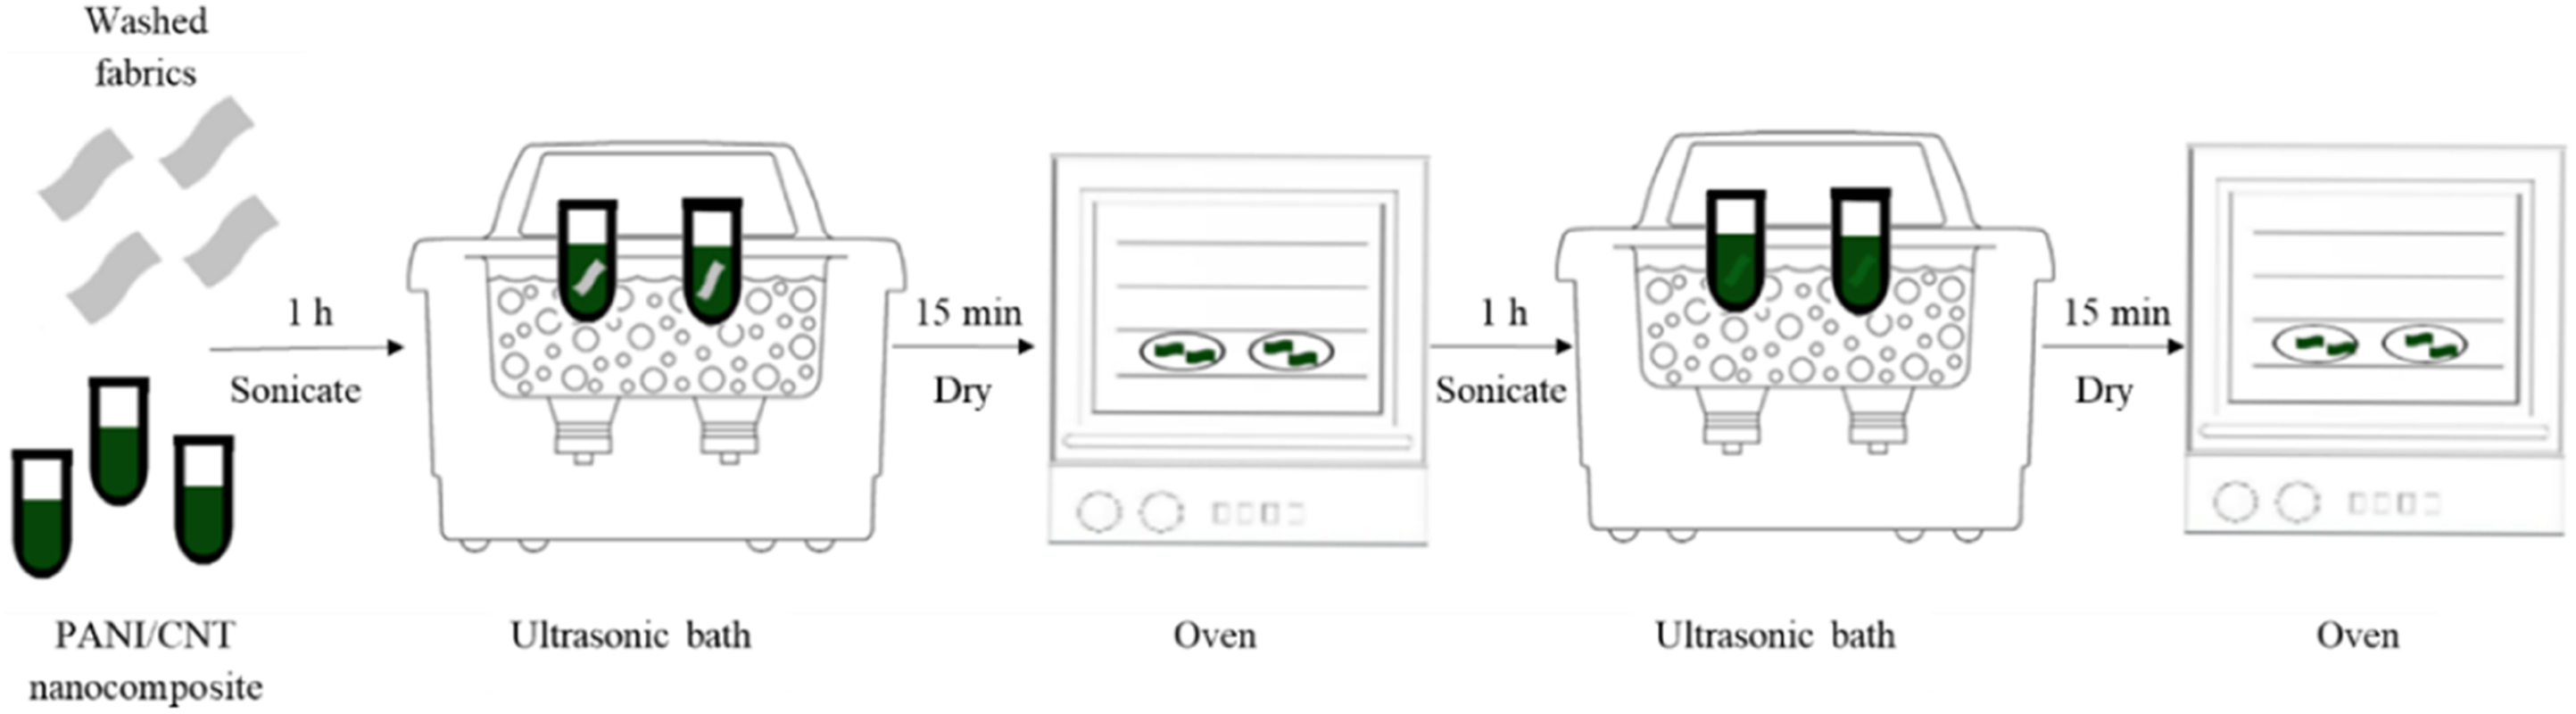
Experimental
Materials
Materials used for synthesizing the nanocomposite-coated fabric.
Synthesis of PANI/CNT nanocomposites
Polymerization
A precipitation in-situ polymerization method was adopted for synthesizing PANI/CNT nanocomposites containing various wt% of CNT (0.0, 0.5, 1.5, 2.5, 5, and 10). At first, CNT was dispersed and stirred in 1
Fabrication of PANI/CNT coated fabrics
For removing the contaminant of the fabric, the fabric was washed by acetone and deionized water. Before washing and drying the as-received fabric with deionized water, it was cut into 10 mm × 20 mm pieces. The pieces were dipped into PANI/CNT nanocomposite solution and sonicated for 1 h for complete infiltration of the nanocomposite into the fabrics’ openings. For drying the nanocomposite/fabric pieces, they were heated at 60–70°C for 15 min. The dipping and drying process was performed twice to make sure that the fabrics’ openings were completely infiltrated and filled with the nanocomposite.
Characterization
The surface texture of the nanocomposite/fabric pieces was examined using S-4800 II (HITACHI) field-emission scanning electron microscope (FE-SEM). To investigate the functional group attachment of the synthesized PANI and nanocomposites, Fourier transform infrared (FTIR) spectra were documented in the range of 4000−400 cm−1 wavenumber. To study the interaction at the nanocomposite/fabric interface, attenuated total reflection (ATR) analysis was applied. The thermoelectric properties of the nanocomposite/fabrics were characterized by an automatic apparatus detailed in Refs. 26 and 27, and their electrical conductivity (0.25 mm thickness) was measured using a Keithley 6487 picoammeter under a constant voltage of 1 V in order to avoid strong electric current within the samples. By brushing silver paint on both ends of the samples, contact resistance was minimized.
Results and Discussion
Figure 2 shows the FTIR spectrum of the synthesized nanocomposite and pure PANI in the region 400–4000 cm−1. The presence of CNT was confirmed by the FTIR data. When CNTs were added to PANI, the peaks were shifted from 615 to 802 cm−1, 1570 to 1562 cm−1, and 1400 to 1461 cm−1. The FTIR spectrum of nanocomposite showed strong absorption bands at 156218,28-31 and 158532,33 cm−1 assigned to C=C, showing, respectively, the deformation of benzoid and quinoid ring vibrations. The band at 1461 cm−1 was related to C-C stretching vibrations due to the benzoid ring.34,35 These peaks illustrate PANI and PANI-CNT nanocomposite as the emeraldine salt form. The peak at 802 cm−1 is attributed to the out-of-plane bending of N-H.29,36 The peak at 1292 cm−1 corresponds to the C-N stretching vibration.37,38 The C-H stretching is reflected in the 2927 cm−1 peak.38,39 The one at 3400 cm−1 illustrates the stretching of N-H band of the aromatic ring in PANI/CNT.29,40,41 The C-H bond and N-H bond can be seen from a spectrum of PANI/CNT nanocomposite film, showing CNT is existent in the nanocomposite film. Fourier transform infrared spectra of pure PANI and nanocomposite/fabrics: (a) 0.5 wt% CNT, (b) 2.5 wt% CNT, (c) 0 wt% CNT, (d) 10 wt% CNT, and (e) 5 wt% CNT. Note: PANI: polyaniline; CNT: carbon nanotube.
To examine the existence of nanocomposite on the fabric surface, attenuated total reflection (ATR) spectrum was used for the sample with the best power factor (PANI/10wt%CNT). As shown in Figure 3, several spectrum peaks prove the existence of PANI/CNT on the fabric including 1096 cm−1 (C-O-C),
42
1451 cm−1 (C-H),
43
1558 cm−1 (C=C),
44
1722 cm−1 (C=O),
42
2893 cm−1 (C-H),
44
and 3171 cm−1 (O-H).
42
Attenuated total reflection spectrum of fabric coated with PANI/10wt%CNT nanocomposite. Note: PANI: polyaniline; CNT: carbon nanotube.
Figure 4 shows the FE-SEM images of the nanocomposite/fabrics. They maintained their outstanding flexibility; capable of being easily rolled, bent, twisted, and tailored into any preferred shape. It is important to note that the CNT distribution improved as their percentage increased. The higher magnification images clearly showed that the composites’ features are in the nano-scale. Field-emission scanning electron microscope images of (a) 0.5 wt% CNT and 50 μm, (b) 2.5 wt% CNT and 50 μm, (c) 5 wt% CNT and 50 μm, (d) 10 wt% CNT and 50 μm, and (e) 0.5 wt% CNT and 500 nm, (f) 2.5 wt% CNT and 500 nm, (g) 5 wt% CNT and 500 nm, and (h) 10 wt% CNT and 500 nm of PANI/CNT-coated fabric. Note: PANI: polyaniline; CNT: carbon nanotube.
Thermoelectric properties
Electrical conductivity
The electrical conductivity of nanocomposite/fabrics as measured using the 4-in-line probe method is presented in Figure 5. The 0.5-wt% CNT sample is the least conducting of all; nearly 13 times less conducting than the 10-wt% CNT sample. The enhancement in the electrical conductivity after the incorporation of CNT is attributed to the synergistic effects of PANI and CNT. The electrical conductivity of PANI/CNT nanocomposites are actually higher than those of the nanocomposite/fabrics which are certainly due to the nonelectrical conductivity nature of the neat fabrics. It can be seen in Figure 5, as the CNT content increased from 0.5 to 10 wt%, electrical conductivity increases sharply which is more significant in concentration between 1.5 to 2.5%. The energy barrier at the CNT/PANI interface is one of the reasons for enhanced electrical conductivity, which obstructs the low-energy carriers but favorably permits high-energy carriers to pass through.45–49 Another reason for this phenomenon is probably because the percolation process is slow in the low-CNT samples and that it speeds up with higher CNT.
47
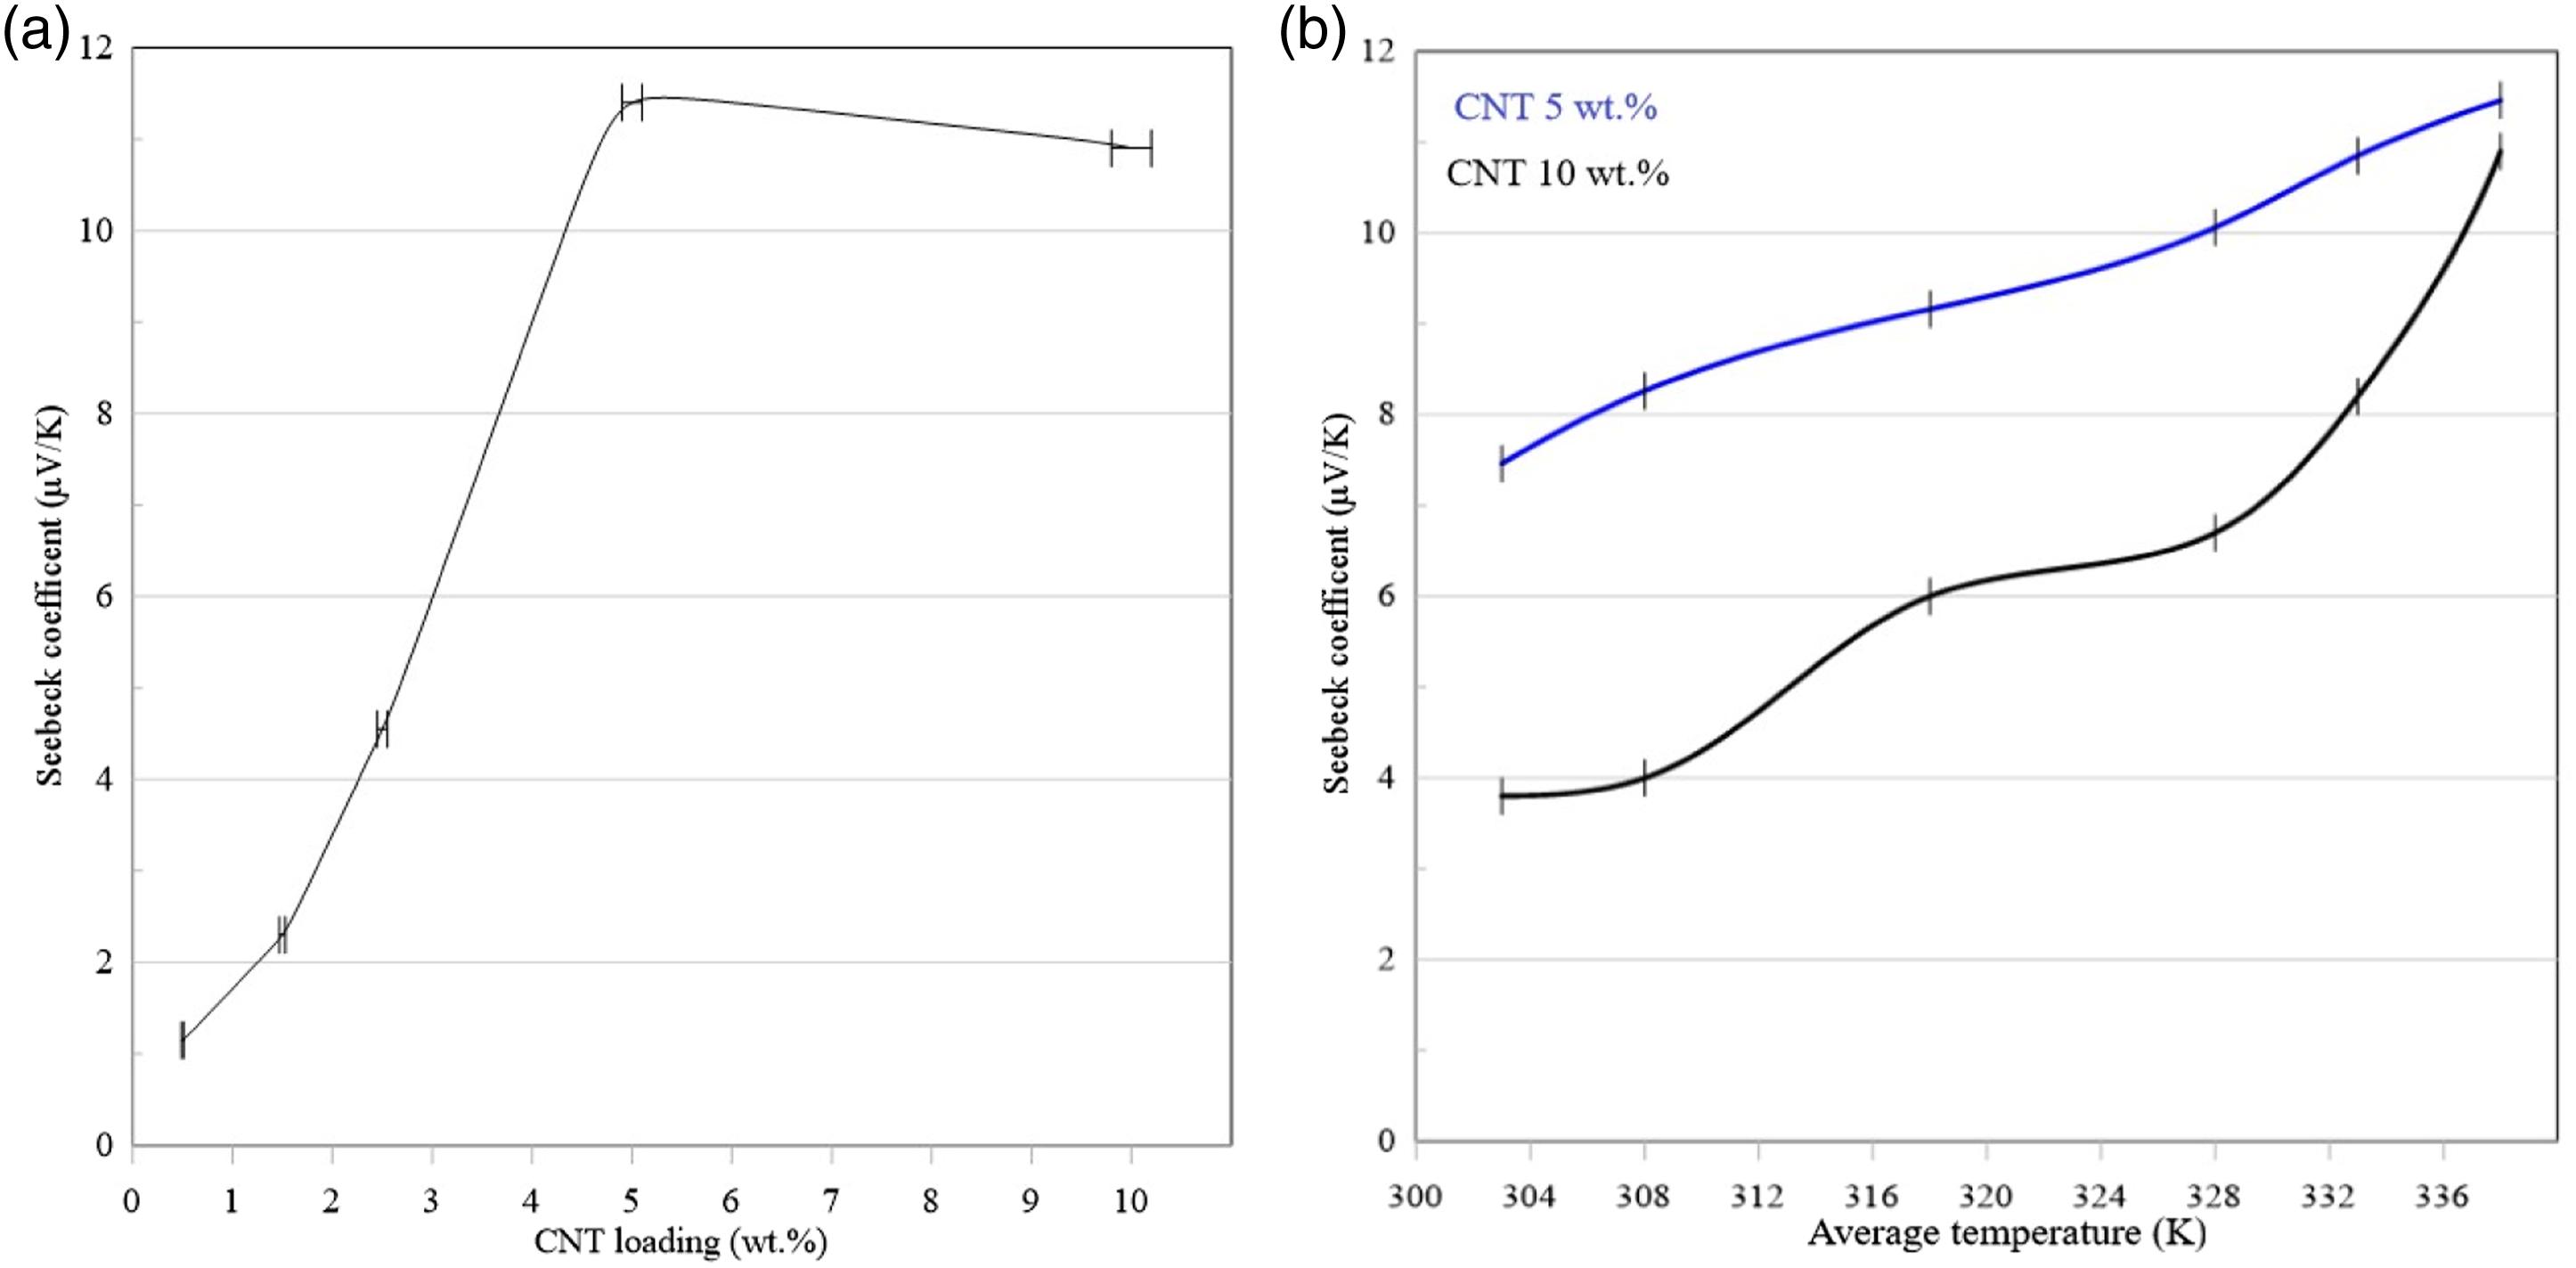
It should be mentioned that the type of error bars in Figures 5–7 is an average value which means it displays the average Y value for each X and vice versa. Electrical conductivity of nanocomposite/fabrics at room temperature (300 K) and the error bars are average values. Seebeck coefficient (a) as a function of wt% CNT at a constant temperature of 338 K and (b) as a function of temperature for the 5 and 10 wt% CNT samples, and the error bars are average value. Note: carbon nanotube. Power factor of PANI/CNT-coated fabric at average temperature (338 K), and the error bars are average values. Note: PANI: polyaniline; CNT: carbon nanotube.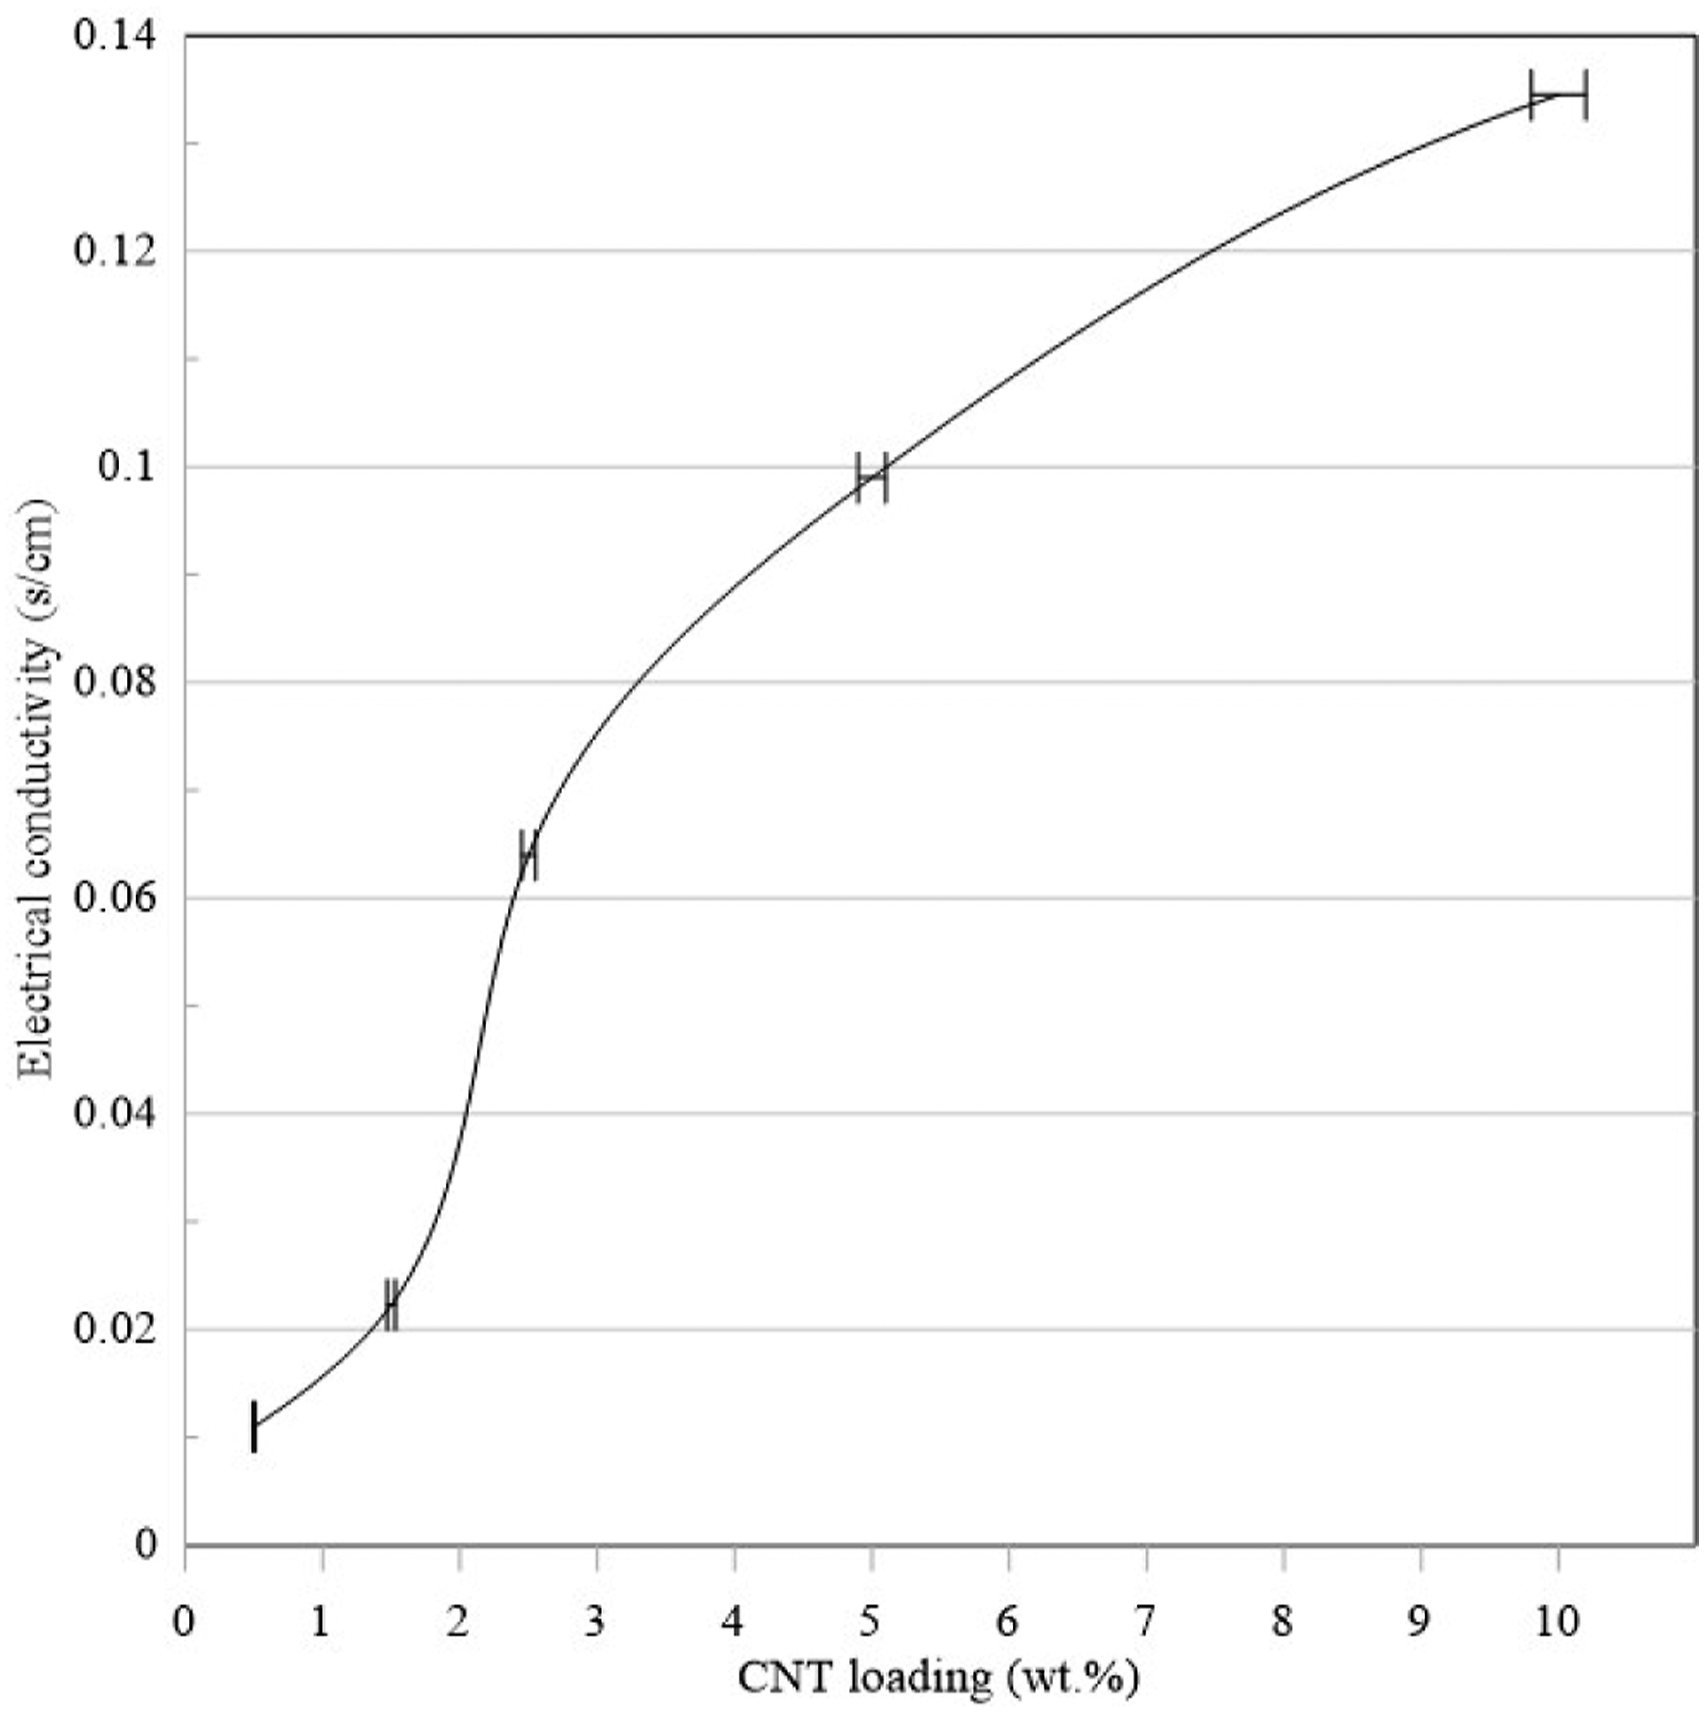

Seebeck coefficient and power factor
The thermoelectric parameters of the synthesized samples were studied to find out the effect of CNT addition. The Seebeck coefficient of the nanocomposite/fabrics measured at 303, 308, 318, 328, 333, and 338 K is shown in Figure 6. It sharply rose from 1.15 μVK−1 (0 wt% CNT) to 11.40 μVK−1 (5 wt% CNT) and then slightly reduced to 10.90 μVK−1 (10 wt% CNT). The rise in the Seebeck coefficient is mainly attributed to the addition of CNT to PANI. The energy barrier brings about the drop of carrier concentration and participates in enhancing the Seebeck coefficient.48,49 The Seebeck coefficient and conductivity for a p-type semiconductor can be expressed by the following equations49-51
Conclusions
PANI/CNT nanocomposites were prepared efficiently by in-situ polymerization of aniline monomer in the presence of CNT. Fourier transform infrared results revealed the well-ordered chain structure in PANI and PANI/CNT nanocomposites. Field-emission scanning electron microscope images revealed well-dispersed morphology of nanocomposite on the fabric surfaces. The obtained results showed that thermoelectric properties of the coated fabrics increase with increment in concentration of CNT in PANI/CNT nanocomposites. In addition, presented results depicted that the fabric sample coated with PANI containing 10 wt% of CNT has the maximum value of the specific power factor where its Seebeck coefficient is less than that of the fabric sample coated with PANI containing 5 wt% of CNT.
Footnotes
Declaration of conflicting interests
The author(s) declared no potential conflicts of interest with respect to the research, authorship, and/or publication of this article.
Funding
The author(s) received no financial support for the research, authorship, and/or publication of this article.