
Abstract
Smart textile products developed by evaluating the human body’s data through sensors have become widespread in recent years. The majority of these products include textile-based information and communication technologies that integrate electronic components into clothing. People use seats, chairs, armchairs, etc., to sit constantly in vehicles, work or at home. The use of these items varies according to the requirements and purposes. In this study, an electro-textile-based upholstery fabric design was carried out to be used in sitting furniture. Electronic components containing capacitive sensors were placed in the designed fabric structure to make it usable in different areas where upholstery fabrics are used. In addition, the sensor connection circuit was developed to receive data from the fabric surface. The data taken from the fabric surface were made meaningful using the calibration and normalization algorithm. The 3D pressing map of the reaction on the fabric surface for different sitting positions was drawn. Electromagnetic field and vibration tests were carried out to examine the response behaviour in different environments where the fabric can be used. According to the findings, it was observed that the pressing areas formed on the surface were displayed in a significant way over the 3D pressing map, and the system was not affected by the electromagnetic field and vibrations. Besides, the fabric was applied on the various surfaces to test calibration and threshold algorithm. Obtained results and circumstances showed that the designed calibration and threshold algorithm were successful to obtained significant results. As a result of the study, upholstery electro fabric with a response time of 0.01 seconds in data collection was developed, which can be used in different environments such as home, workplace and vehicle. It can be used over furniture and in wet and dry conditions and is not affected by the electromagnetic field and vibration in the environment.
Introduction
Technical textiles, which are defined as textile materials and products produced for their technical performance and functional properties rather than their aesthetic and decorative features, are materials that are specifically designed, used in any product or process, or alone to fulfil a specific feature. 1 Smart textile products are one of the areas with the highest added value and advanced technology among technical textiles. Smart textile technology is a field covered in many fields such as medical textiles, protective and military-technical textiles and transportation technical textiles. However, it is considered in a separate category in terms of its functions and structures. 2 Smart textiles have emerged as a result of interdisciplinary studies such as material science, design, electronics and computer engineering and medicine, along with developments in textile technology and synthetic fibres. 3
For many years, researchers’ biggest challenge in wearable electronics applications has been related to how to connect computer hardware to clothing. In the 1980s, Steve Mann pioneered this field by adding various technology products and electronic devices to clothing. 4 Later, methods such as gluing electronic components directly on the fabric and passing them through the fabric over the wiring structure followed this technology. 5 Today, there are smart textiles with functional designs that can actively detect and react to stimuli such as pressure and heat. 6 The development of the diversity of these textiles is directly linked to the creation of textile materials with suitable electrical conductivity. 7 These functional structures where electronic components and textile materials are brought together are called electronic-textiles, in short, e-textiles. E-textiles need the energy to fulfil the functions expected from them, and this energy is usually provided by batteries integrated into the clothing. These batteries work by applying a certain voltage to the conductive yarns and passing a current through them. E-textile structures can be obtained by using conductive fibres, polymers, wires and yarns, as well as they can be produced with special finishing processes. 8 Conductive fibres can be produced from electrically conductive metals such as ferrous alloys, nickel, stainless steel, titanium, aluminium and copper. E-textile products developed by evaluating the data received from the human body through sensors have become widespread in recent years. 9 A majority of these products include textile-based information and communication technologies that integrate electronic components into clothing. 10 In order to use wearable textile products, it is essential to collect the data suitable for the intended use of the product with the sensors placed on these products to interpret and model these data. For this purpose, software that can work on mobile devices, computers and some applications and smart televisions has been developed.
When the studies on wearable technology applications were examined, it was seen that research studies were carried out on biomechanical analysis, biomedical data collection and creating a human–computer interface. Besides, it was understood that these studies mostly focused on examining electrical conductivity, electromagnetic and electrostatic shielding properties. Paradiso et al. used conductive and piezoresistive materials in the form of fibres and yarns as electrode elements by integrating them into a garment. 11 Huang et al. produced yarn-based sensors using piezo-resistant fibres, elastic and standard polyester fibres in their study. 12 Zhou et al. developed a single-layer, soft, smart textile product for health care and monitoring of versatile physiological parameters during sleep. 13 Leal-Junior et al. presented a multi-parameter and semi-distributed smart textile-based on embedded, stretchable, polymer optical fibre (POF) sensors. 14 Jeong et al. presented the experimental results for monitoring respiratory rate using a piezoresistive fabric sensor in various moving environments. 15 Curone et al. developed the smart clothing with commercial portable sensors and devices for emergency personnel. 16 Coyle et al. developed the textile sensors to measure physiological parameters and chemical composition of body fluids. 17 Shyr et al. designed a wearable motion detection device consisting of a textile strain sensor that uses elastic conductive fabric to monitor the bending angle of elbow and knee movements. 18 Wang et al. utilized the conductive composite yarn as an effective strain-sensing material for tracking movements of human limbs. 19 Wang et al. designed and developed the smart rehabilitation garment, which was a wearable system designed to support posture correction. 20 Grancarić et al. focused on the definition of conductive polymers, their conductivity mechanisms and various approaches to produce electrically conductive textiles for smart textile needs. 21 Chow et al. presented the intelligent fitness socks that use textile pressure sensors, which are attached to a communication wristband via a conductive yarn. 22 In the literature, wearable technologies were applied in a limited area. Thermophysiological comfort parameters were ignored, could not be applied to every piece of clothing and had a portable battery problem. In addition, it was seen that there were deficiencies in wearable technologies for daily use and in applications used by healthy individuals.
People use seats, chairs, armchairs, etc., to sit constantly at work, in vehicles and at home. The use of these items varies according to the requirements and purposes. Some studies were carried out to develop smart textile products for the act of sitting that is an important behaviour in human–computer interaction.23–29. In the literature, mostly electro-textile studies are applied to clothing. Smart textile studies applied to seating materials are very few. In current electro-textile studies applied to seating materials, it is seen that instead of developing electro-fabric, ready-made electronic sensors are applied on seating furniture.
When the studies conducted so far were examined, it was seen that there is a need to develop a smart textile product integrated with the fabric. The fabric design within this study’s scope was applied to a more stable measurement surface, unlike the dynamic measurement areas on clothing in the studies in the literature. As distinct from the studies in the literature, an electronic seat was developed that can instantly examine sitting behaviours, communicate with mobile devices and is suitable for personal use and health sector use when necessary. In addition, electronic applications were applied to the traditional upholstery fabric production technique, which normally has low added value, and a unique technical textile application with high added value was realized. In the previous study 30 that guided this study, copper wire-based fabrics with different density and different weave type properties were produced. By measuring the thermophysiological comfort properties of fabrics produced from copper wire-based hybrid yarns, it was tried to select the most suitable fabric type that can be used in electro-textile applications. Thus, fabric options that can be applied to electro-textile products were examined and shed light on this study. In this study, upholstery electro-fabric was developed to be used in sitting furniture. In order to develop an upholstery electro fabric for use in sitting furniture, electronic components containing capacitive sensors were placed on the fabric structure, the reactions of the electro-fabric during use were examined, and electromagnetic field tests were carried out to examine the reaction behaviour in different environments where the fabric can be used.
Materials and methods
Manufacturing of hybrid conductive yarns and electro-fabric
In the study performed to obtain an electro-textile surface,
30
nine different woven fabrics were structurally produced with three different weave types: plain, 2/1 twill and sateen, at three different density levels: tight, medium and loose. Ne 10/1 (59 tex) open-end yarns with 25% polyester/75% cotton content were used as warp yarns in woven fabrics. Three-ply hybrid yarns with 120 turns per meter in the S direction were produced from two twists of the Ne 12/1 (49 tex) 25% polyester/75% cotton open-end yarns, and one twist of 0.30-micron copper wire was used in the weft yarns. The copper wire used in the weft yarn was covered with a varnish that gave the weft yarn its insulation feature. The physical and performance properties of these electro-fabrics were measured, and the results were presented in detail.
30
Sateen and plain fabric structures, the prominent fabric types resulting from thermophysiological comfort, thermal camera, and microscope examinations applied in the mentioned study, were selected for this study. In addition, tight fabric structures were chosen since they contained more sensor networks due to their more conductive yarn content per unit area. Thus, in the system to be used in the test experiments, a tight level plain and sateen combination fabric set was determined. These determined fabrics were prepared for this study as a double set. It was decided to use sateen electro-fabric on the surface that will touch the person, taking into account the hand and covering factors, and to use the plain electro-fabric on the lower surface as it can provide an infrastructure for electrical conduction with a grid shape. The electro-fabric types used on the upper and lower surface of the fabric set are shown in Figure 1. In addition, the structural properties of the fabric layers are given in Table 1. Sateen weave–plain weave electro-fabric combination. The physical and structural properties of the woven fabrics used in layers. Note: Coefficient of variance (CV%) values in parentheses.

The microscopic images of the produced plain and sateen electro-fabrics were obtained with an Olympus BX53 microscope with an Olympus LC30 camera and are presented in Figure 2, respectively. The hybrid conductive yarns incorporated into the fabric structure appear in the figure. Microscope images of the electro-fabrics.
Creating sensor infrastructure
The system’s general operating architecture and the drawing of the electro-fabric sensor structure are given in Figure 3. The electro-fabric sensor structure and system operating architecture.
To create the sensor system within the scope of this architecture, firstly, each fabric surface was burned 1 cm distance from the edge to inside by a precisely adjusted laser cutter. While the yarn is burned, copper wires were not damaged. Thus, varnished copper wires added to the hybrid yarn structure at the fabric production process were exposed, and the connection ends were prepared without damaging the fabrics by using the laser cutting system, as shown in Figure 4. Precise separation of the conductive wires from the fabric by laser cutting.
The wires uncovered on the fabric edge are given in Figure 5(a). The varnish on the wires was cleaned with a grinding machine. Flexible copper sheets were cut as in Figure 5(b) and soldered to exposed copper wires. A cable end coming from flat cables was soldered to this structure. Thus, a sensor node was created. In this way, 12 sensor nodes were prepared for a single surface. The sensors were designed as 12 channels in each fabric and 24 pieces on two fabric surfaces. The ends coming from the flat cable were combined with the insulation-displacement contact (IDC) female connector in Figure 5(c) and made to be connected to the sensor circuit. Creating the sensor structure. (a) Emerging of copper wires after laser cutting. (b) Soldering of copper wires and flexible copper sheet. (c) End product of a surface.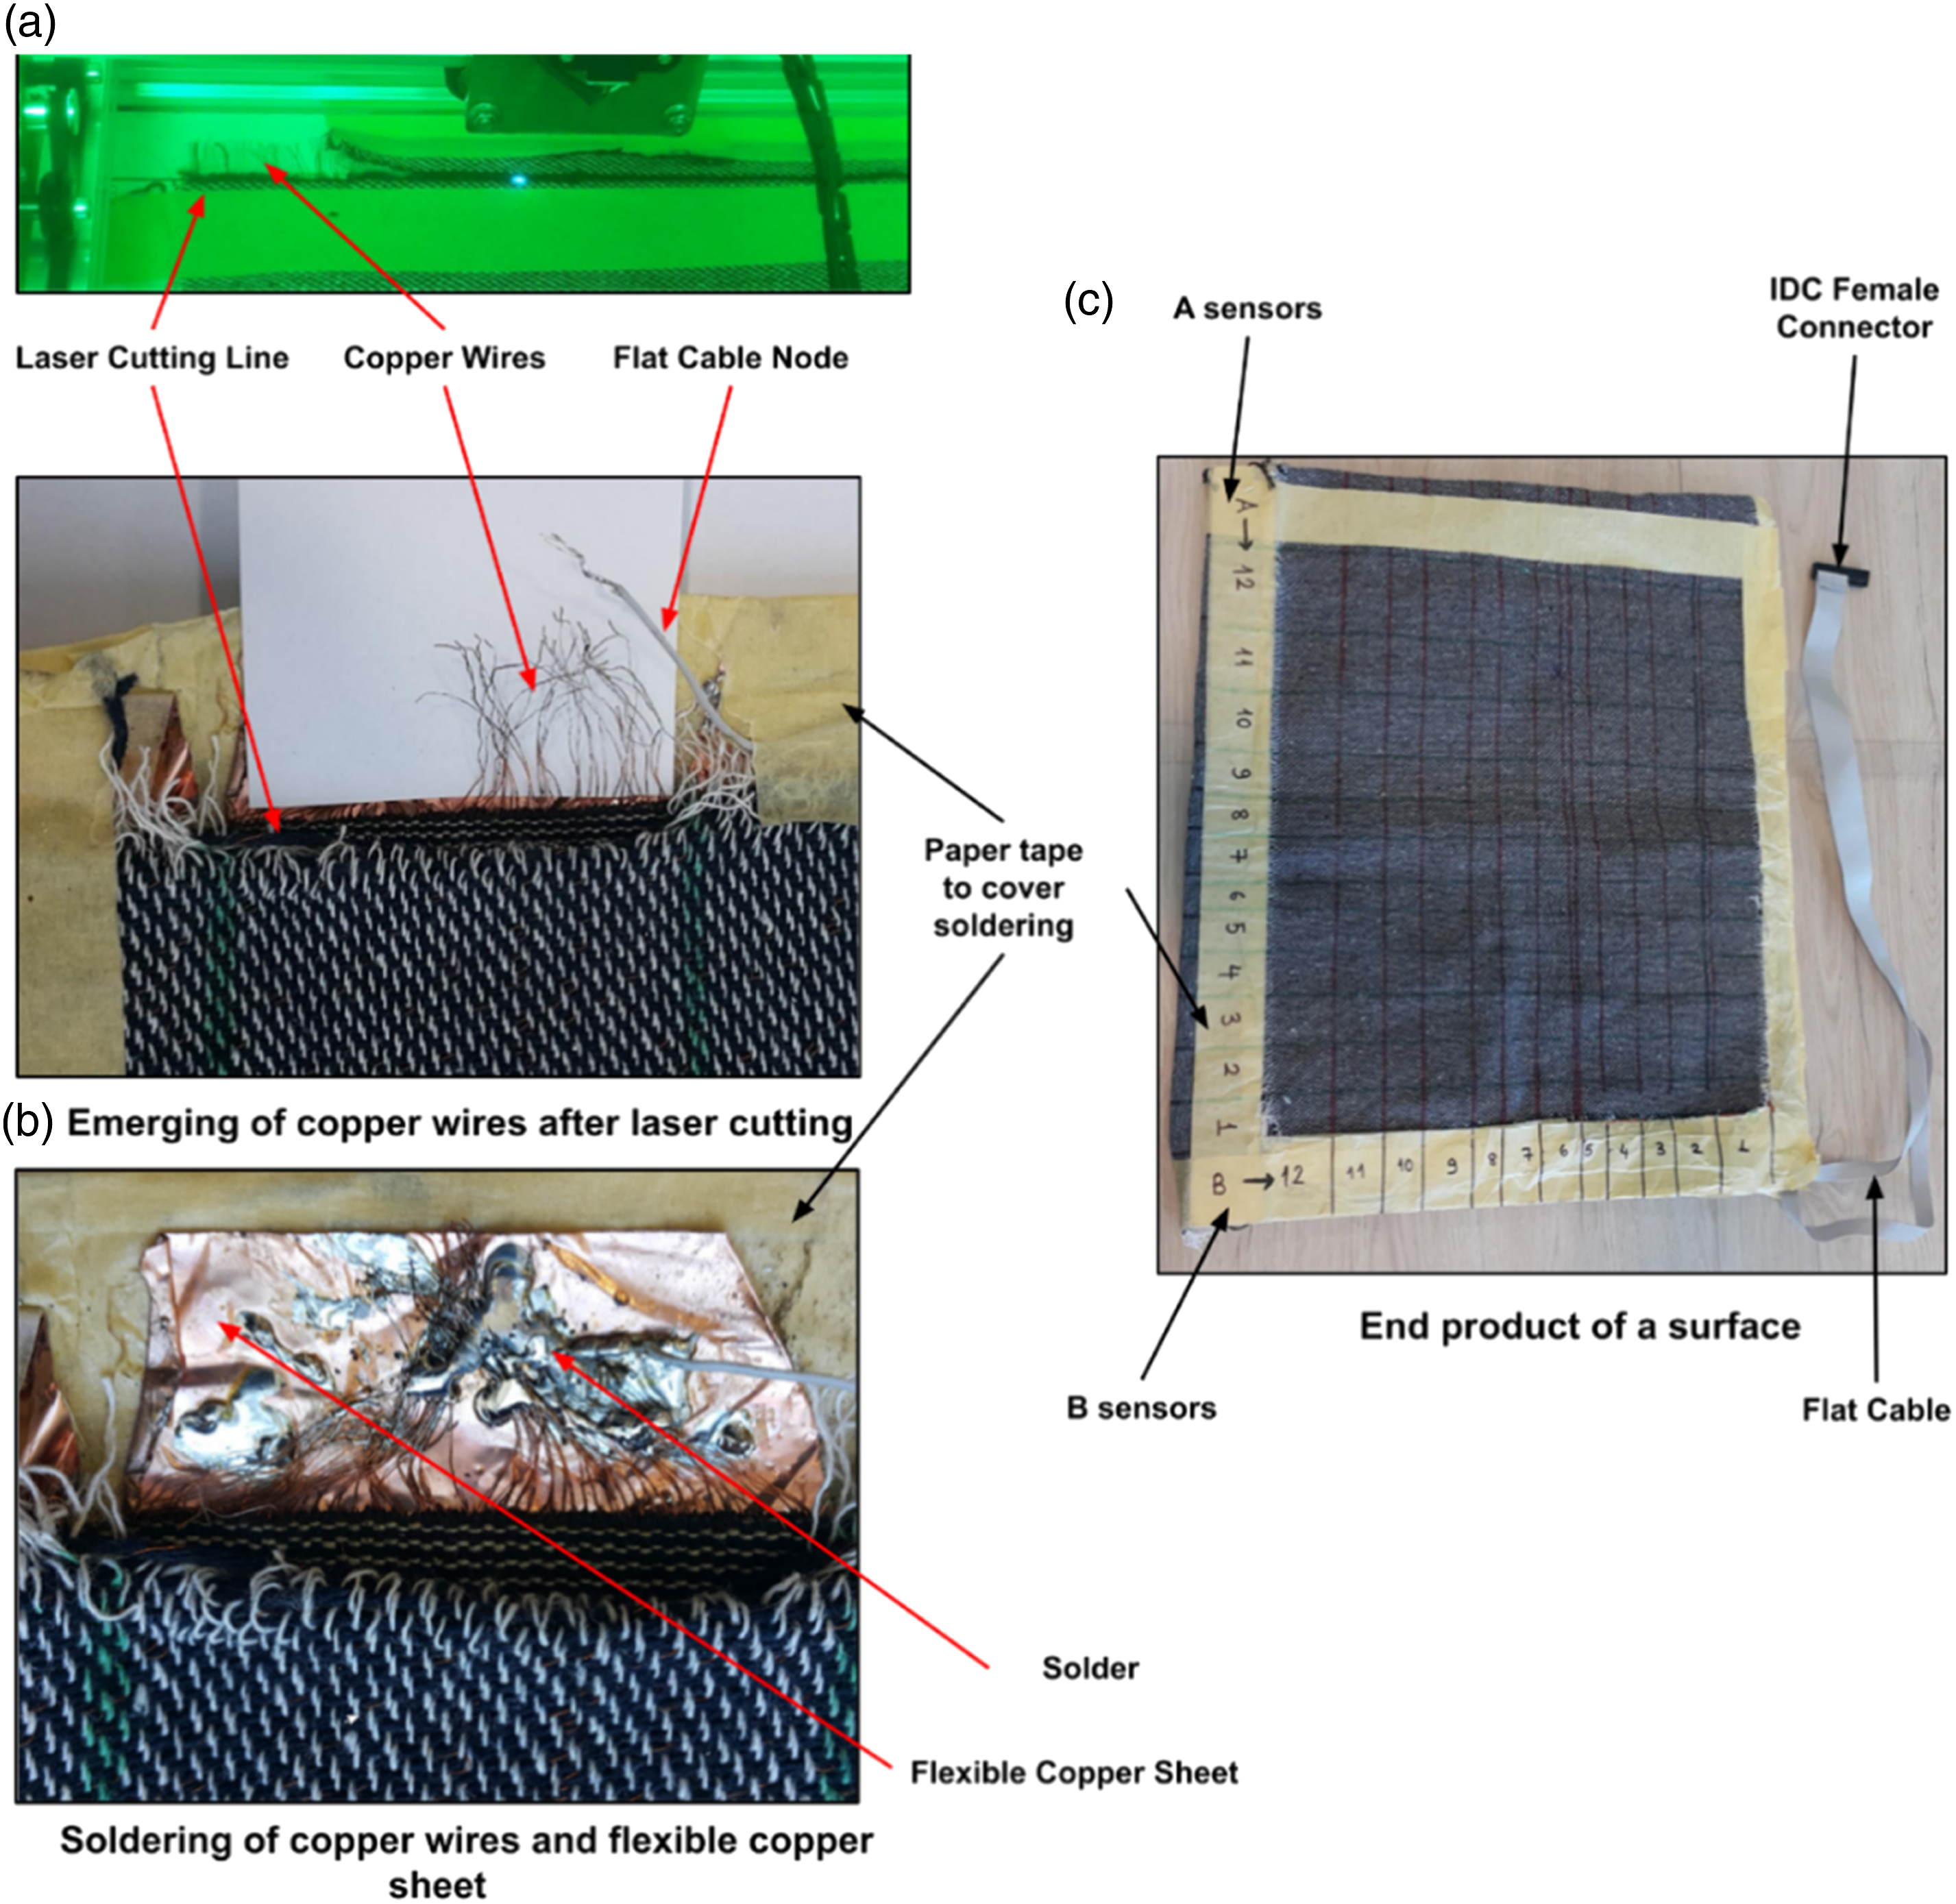
In order to obtain real-time data from the sensor textile surface created, the fabric circuit was made portable and turned into a final product by boxing, as seen in Figure 7. An external 5V battery powered this circuit.
Data Collection and Modelling
The sensor system’s fabric connection circuit application was successfully applied to a fabric sample to create a prototype product. The operation of the sensor system and data collection tests were carried out on a sample. A 3D pressing map was created for data modelling. The voltage measured at the input sensing node of the capacitive sensor in the connecting circuit was calculated inversely proportional to the capacitance. At the end of each charge cycle, this voltage was sampled by an internal 10-bit analog to digital converters (ADC). For this reason, the data received varied between 0–1023. In order to create a 3D pressing map, data were taken from 12 sensors located on both horizontal and vertical axes on the fabric surfaces in a certain period of time. Each of these data was obtained as a 1 × 24 matrix for each surface. In order to make sense of the pressing map, the calibration process was carried out for 5 seconds after the data were started. Calibration values were created by calculating the average of each row value taken during this period. After this process, a 12 × 12 matrix was created with the values obtained from the sensors taken from the horizontal and vertical axes. These matrix values were normalized according to the calibration values, and 3D pressing map values were obtained. This process is vital because the sensor yarns are distributed on the fabric surface and produce different voltage values since they have different distances from the sensor circuit. Since the fabric surface is likely to be used in different environments, these voltage values should be normalized according to their calibration values after the fabric is placed on the surface since it needs meaningful pressing values should be obtained. A meaningful pressing value matrix was obtained using equation (1). In equation(1), X is a matrix of N × N size. A is an N size matrix representing the data taken from the vertical axis on a fabric surface. B is an N size matrix representing the horizontal axis’s data from the other fabric surface. CA and CB are the average values of the calibration data taken from N sensors on the vertical and horizontal, respectively, for 5 seconds when the data acquisition was started
In transferring the received data to the pressing map, a filtering process should be applied to remove unnecessary data (noise). The pressure threshold value was calculated using equation (2) to generate a meaningful pressure value from the filtered data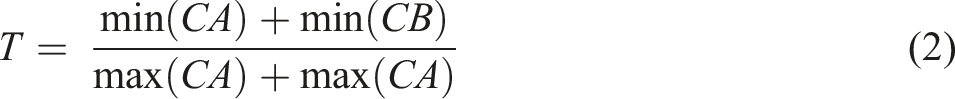
Using filtered raw data, calibration and pressing threshold values, a 3D model of the pressing matrix was created according to the algorithm flow diagram in Figure 6. 3D modelling algorithm flowchart of textile surface values.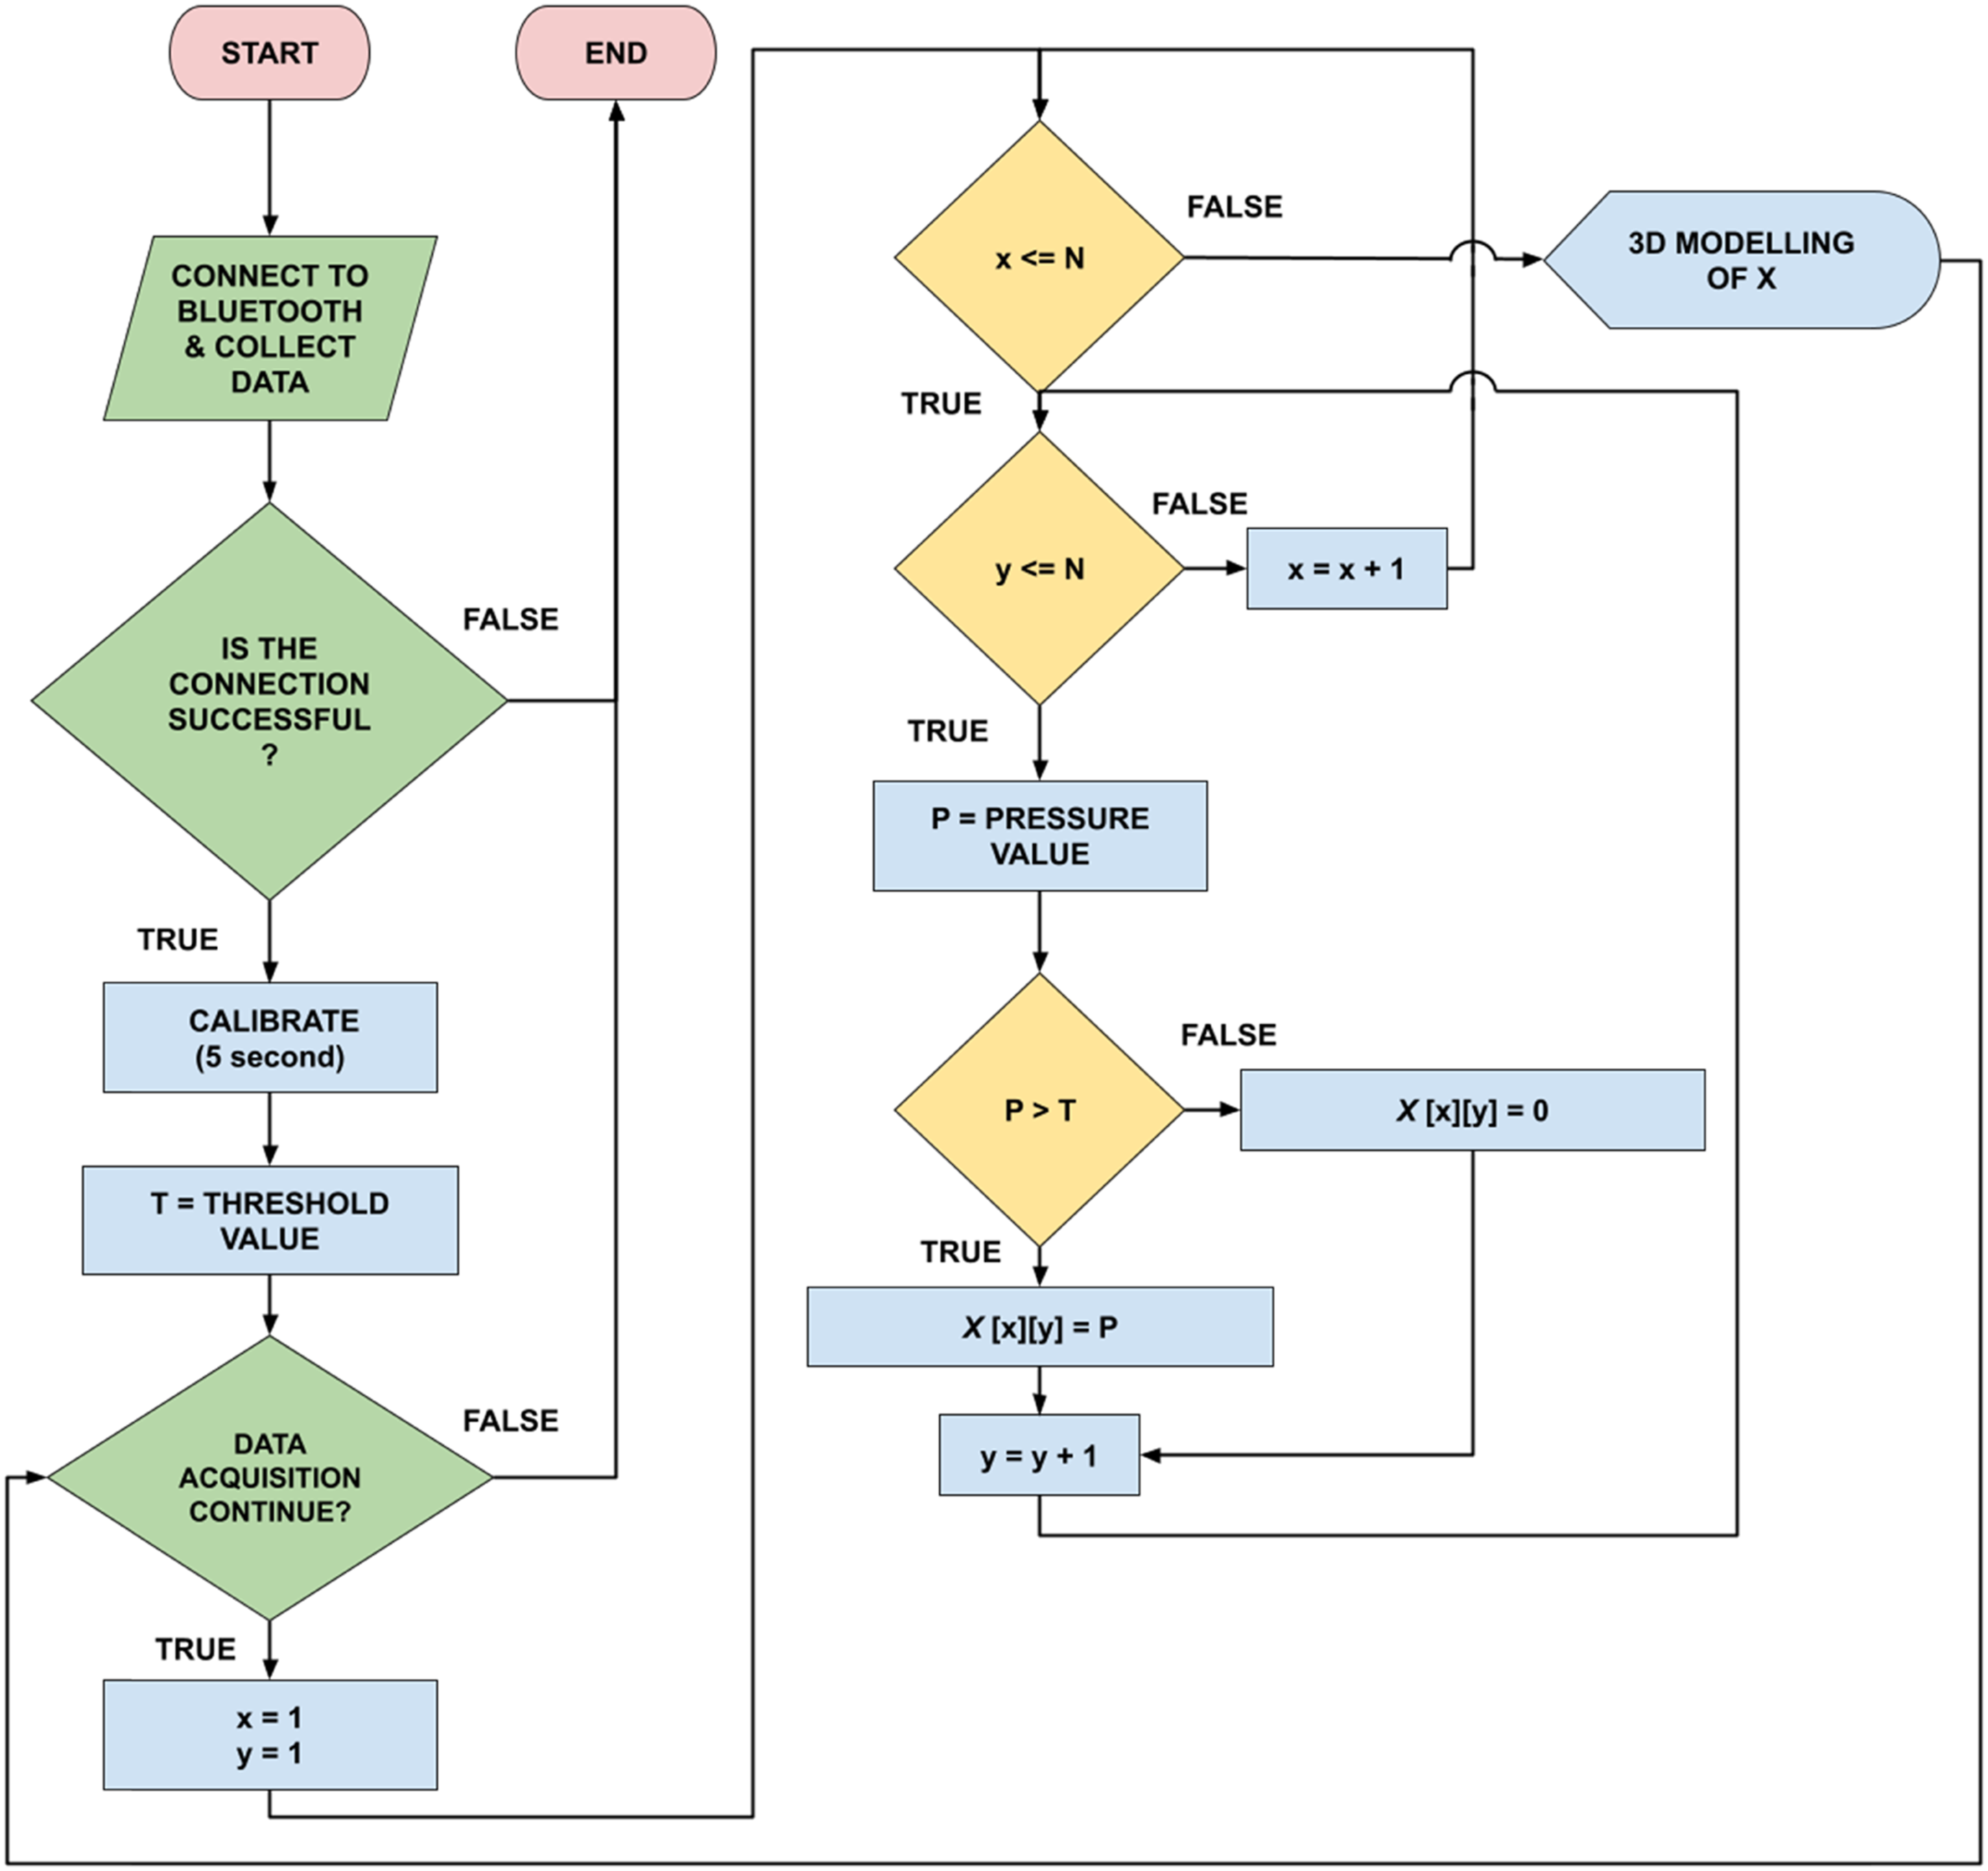
The data collection tests were conducted both cabled and wirelessly. In order to measure the response times of the sensors, the sensor circuit was programmed to receive data between 1000 and 10 ms, respectively. It was observed that 250 ms duration met the sensor response time in order to create a meaningful pressure value with the least amount of data. Since the smart textile surface was developed based on upholstery fabric, the modelling software and fabric test setup were designed to be used in the seating article. In the designed test setup, two separate fabric sensor sets (plain–sateen combination) were prepared for the sitting area and the back area and placed in the standard office chair. Then, the reaction of the system was examined by sitting on the experimental setup. The images of the experimental setup are shown in Figure 7. Experimental setup of electro textile surface.
Measurement of the electrical and physical properties
Voltage and current electrical properties of the smart textile surface were measured. In addition, it was measured whether it is affected by the electromagnetic magnetic field in the environment. The vibration tests were carried out to use the smart textile surface in different environments (office, vehicle, etc.). It was tested whether the data obtained from the surface were affected by the vibration in the environment. In order to measure the electricity consumption, the voltmeter and ammeter were connected to the surface sensors connection circuit. Voltage and current values were measured when both surfaces are empty, only the back surface is empty and both surfaces are not empty. The measurement system is presented in Figure 8. Voltage and current measurement.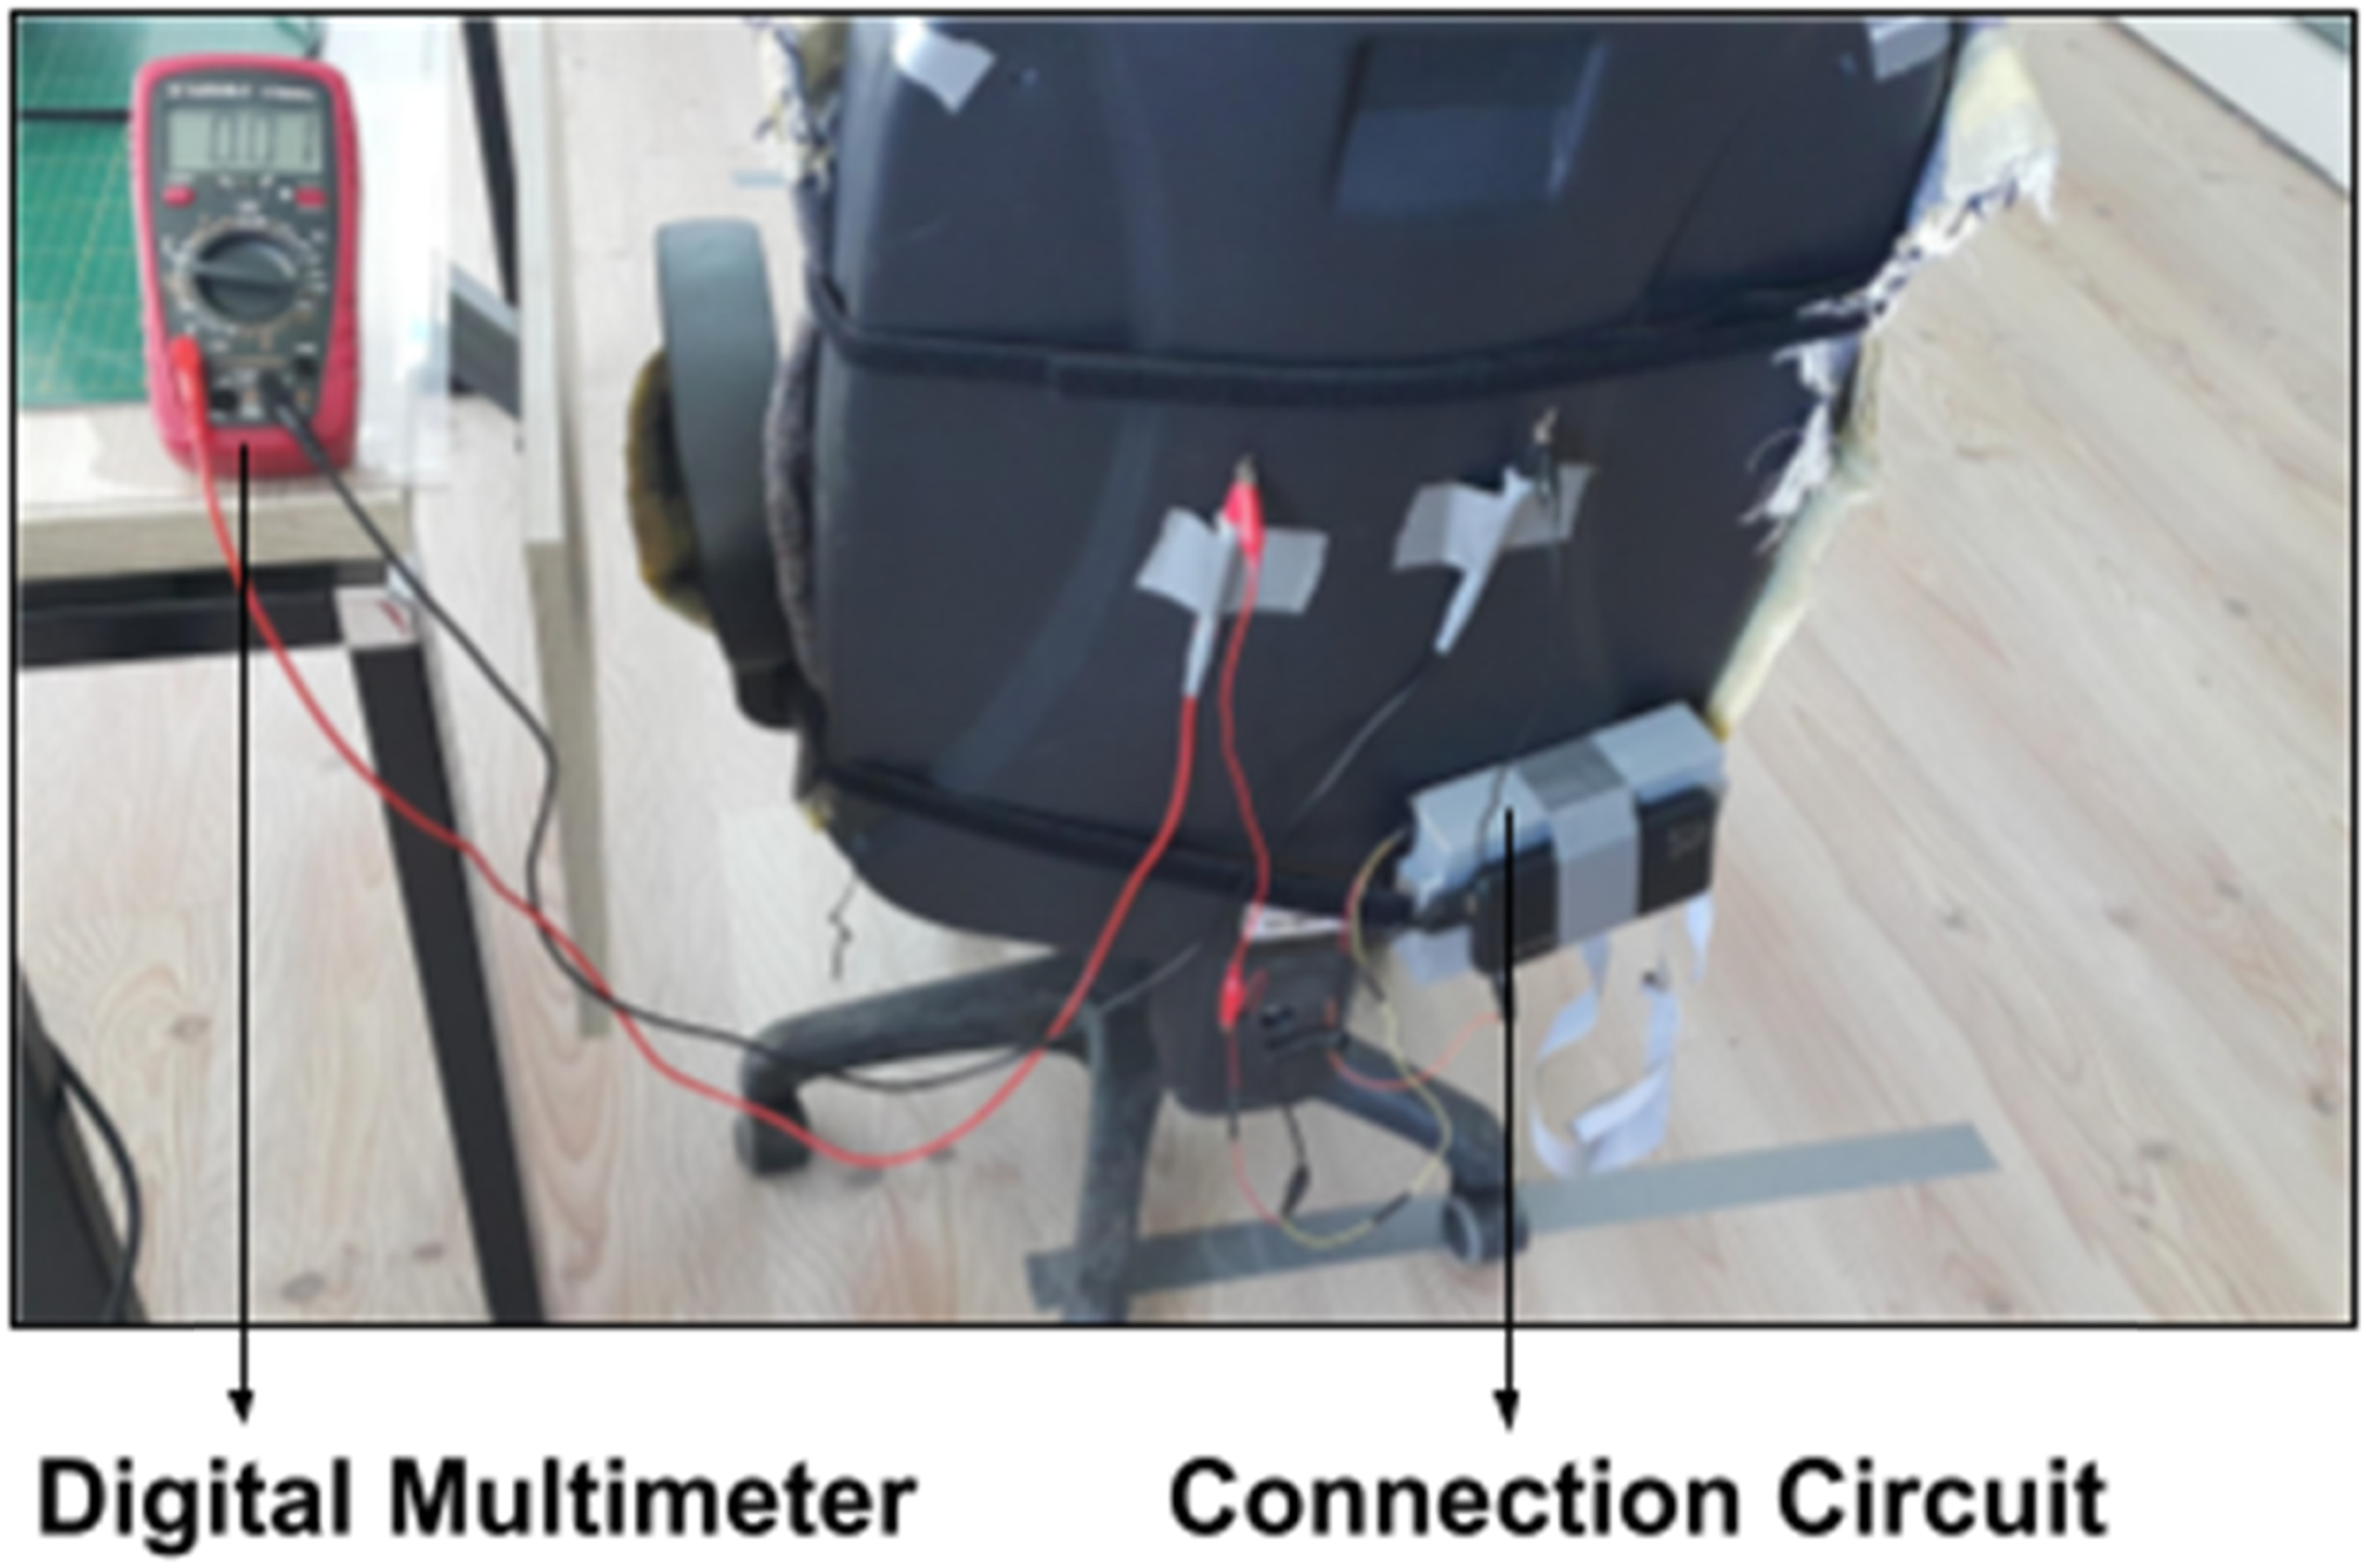
Today, with the development of communication technologies, wireless communication technologies are available almost everywhere. Since the developed textile surface is planned to be used mostly in sitting items, the data obtained from this surface should not be affected by the wireless communication technologies used in the environments where these items are located. Whether the data obtained from the smart textile surface will be affected by electromagnetic and magnetic fields was measured in an environment with wireless communication frequencies. Aaronia Spectran Analyser HF-6085 hand-held spectrum analyser was used for measurement. The measured parameters were monitored by the USB connection of the device and the Realtime Spectrum Analyser software. The measurement results consisted of instantaneous measurement data taken over a period of 6 min. This time was determined by International Commission on Non-Ionizing Radiation Protection (ICNIRP)
31
to avoid spikes or descent during measurement. The images of the spectrum analyser and the measurement software are shown in Figure 9. The measurement with spectrum analyser.
It is planned that the smart textile fabric surface can be used in seating items in different vehicles (car, train, plane, etc.). For this reason, the data taken from the fabric surface should not be affected by the vibrations occurring in these environments. In line with this purpose, the smart fabric surface was laid out on an automobile seat, and vibration values were measured while the car was driven for a certain period of time. The developed smart fabric system was used in a car, and it was investigated whether it was affected by the vibration of the vehicle.
To measure and analyse vibration in the automobile, the IOTECH High-Channel Vibration Analysis & Monitoring System device was used. The Dytran shock accelerometer sensor (3200B6) was used with the vibration device. The sensitivity of the sensor is 2 mV/g as (acceleration/meter) and has 2.500 g range. The sampling rate was chosen as 3000 Hz, and this value was considered sufficient since the measurement was made in a standard automobile. The vibration values were measured while the car was running in three different RPM values of the automobile and also while it was not running. All measurement periods are selected as 5 s. The measurement setup is given in Figure 10. The only sitting surface used while collecting data. The measurement setup of vibration. (a) Measurement setup. (b) Measurement process.
Results and discussion
Data modelling
Raw voltage values produced by 10-bit ADC were taken from the fabric surface. These values were normalized together with the calibration values, and a 3D pressing map was created. In the office chair where the smart textile surface was placed, certain seating positions were taken for approximately 250 s, and trials were made. With these trials, a data set of 1000 pieces was created. Raw data graphics taken from the sitting and leaning surfaces are given in Figure 11. Raw data from sitting and back surfaces. (a) Sitting surface raw data (1–1000). (b) Back surface raw data (1–1000).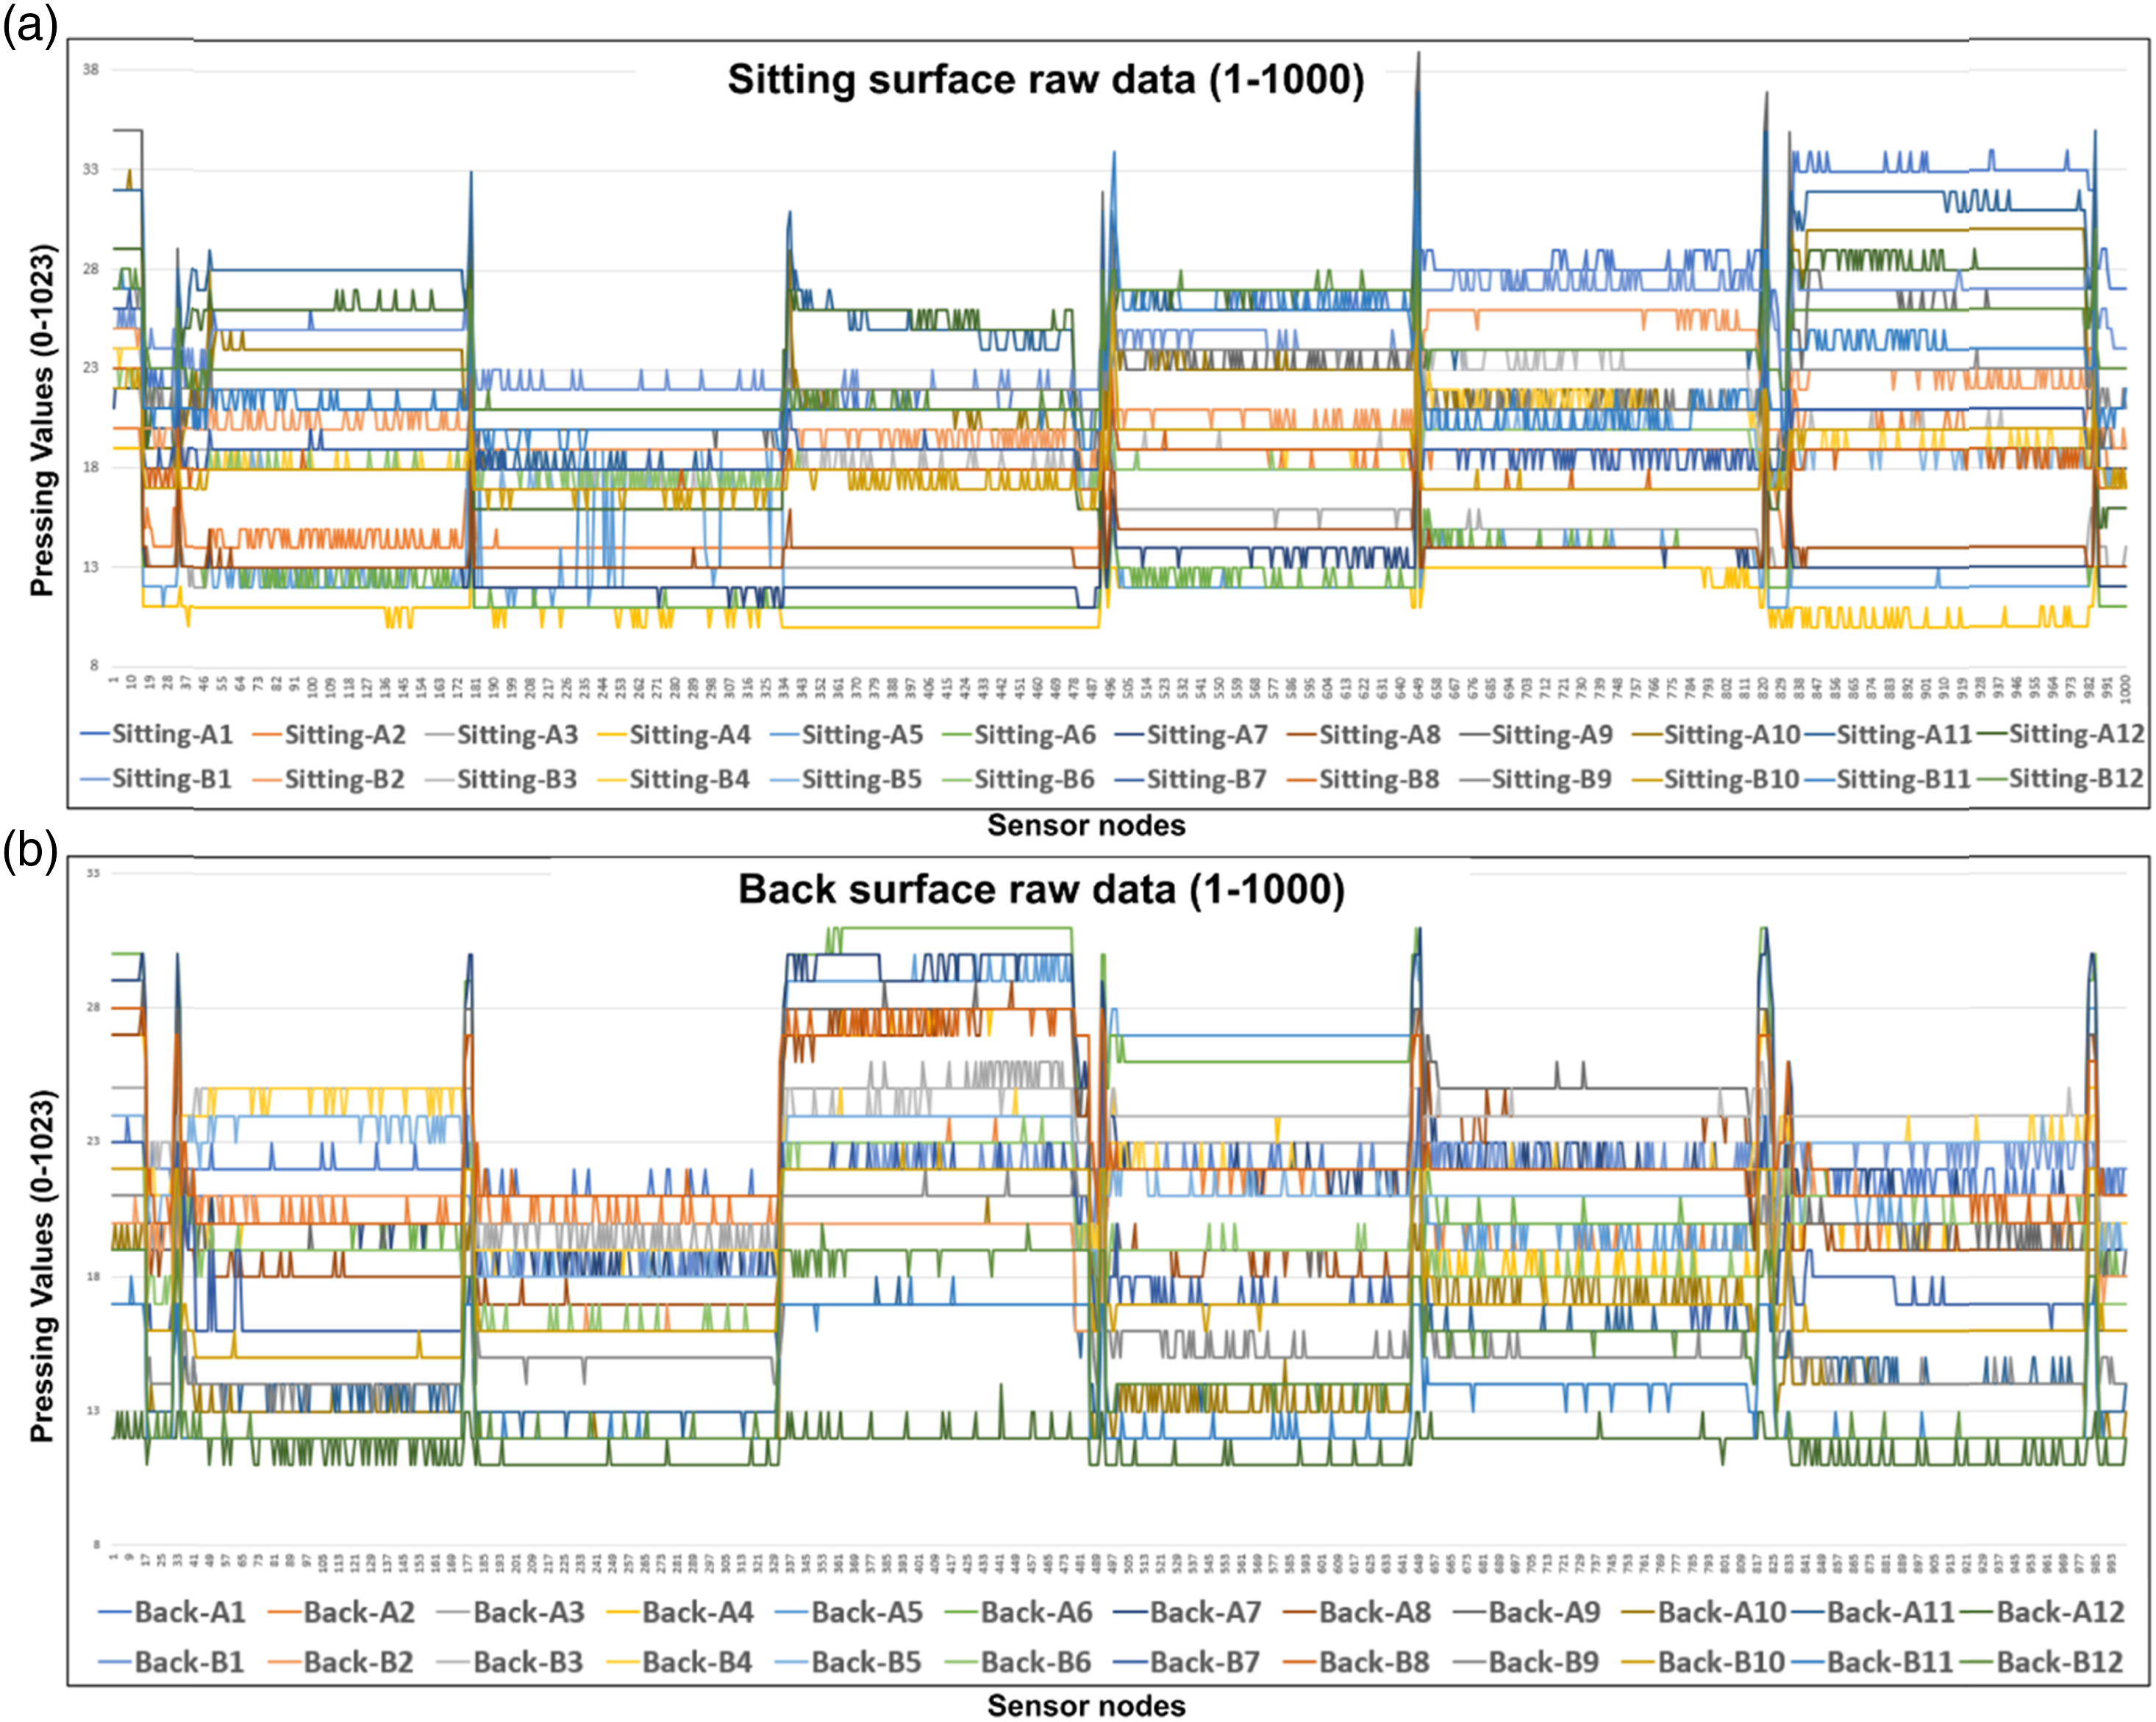
The raw data graphics of different sitting positions and the 3D pressing map obtained from the raw data were created in the office chair. The 3D pressing maps of each surface were obtained with MATLAB surf function and Python surf process of matplotlib library to visualize the data. The same data were calculated using both methods. In Figure 12, the raw data of the smart fabric surface placed on the office chair and 3-dimensional graphics obtained after calibration and normalization are given. Thus, while sitting surface data are between 500 and 1400, data have been calibrated between 0 and 1. While the back surface data are between 900 and 200, data have been calibrated 0 and 1. Eventually, sitting and back surface data have become meaningful. These graphs show the values of the data set in rows 1–16. Raw data and 3D modelling of empty surface. (a) Sitting surface raw data (1–16). (b) Back surface raw data (1–16). (c) 3D modelling of sitting surface at 8 data without calibration and normalization. (d) 3D modelling of black surface at 8 data without calibration and normalization. (e) 3D modelling of sitting surface at 8 data with calibration and normalization. (f) 3D modelling of black surface at 8 data with calibration and normalization
In Figure 13, the raw data created by a person sitting on an office chair and leaning on his back a little and the 3-dimensional and 2-dimensional graphics obtained after calibration and normalization are given. When Figure 13(c) and (d) are examined, it is shown that while sitting surface data are between 200 and 700, they have been calibrated between 0 and 1.5. Likewise, when Figure 13(e) and (f) are examined, while the back surface data are between 150 and 500, data have been calibrated 0 and 1.5. So eventually, sitting and back surface data have become meaningful. Position data with little leaning on the back surface. (a) Sitting surface raw data (52–64). (b) Back surface raw data (52–64). (c) 3D modelling of sitting surface at 52 data without calibration and normalization. (d) 3D modelling of black surface at 52 data without calibration and normalization. (e) 3D modelling of sitting surface at 52 data with calibration and normalization. (f) 3D modelling of black surface at 52 data with calibration and normalization
3D pressing maps obtained according to different seating positions performed in the test setup are shown in Figure 14. Also, descriptions of the seating positions are given in Table 2. 3D modelling of different sitting positions. Definition of positions in Figure 14.

Electrical properties
After the smart fabric was created, electrical consumption data were examined. The current–voltage values of the developed smart textile surface were measured. As seen in Figure 15, current values (mA) were measured, respectively, (a) when the sitting surfaces are empty, (b) when sitting and not leaning back and (c) when leaning on both surfaces. These values were measured for 1 minute in each step. During this whole measurement period, the voltage value was measured as 4.97 V. Current values of the surfaces.
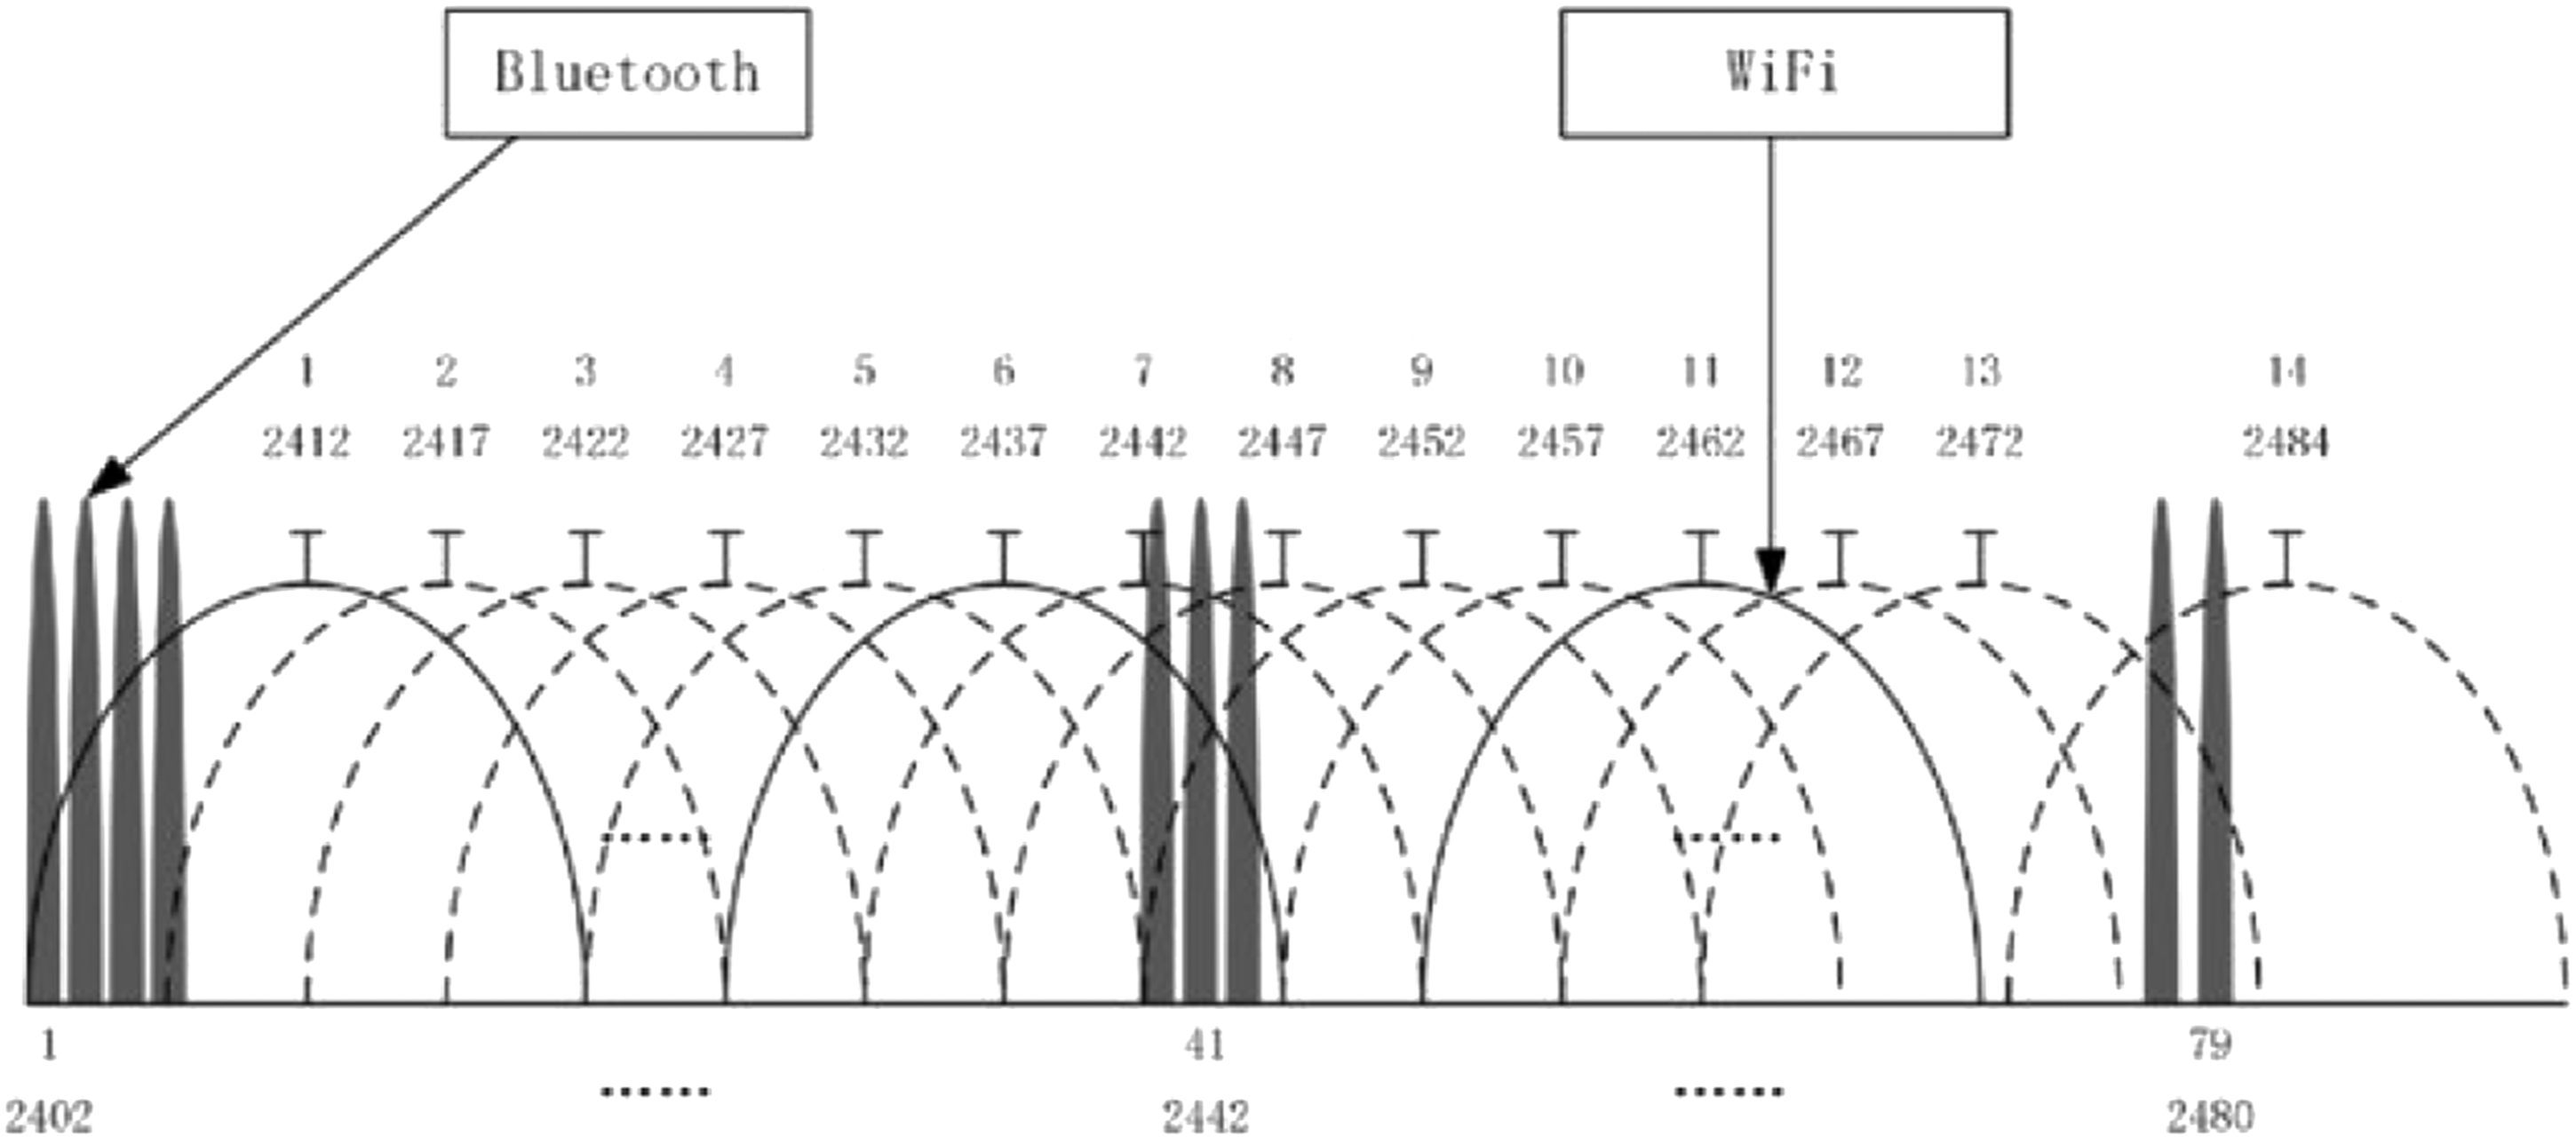
The smart textile surface is planned to be used in seating items in different environments. Today, with the development of technology, many electrical devices have become indispensable components of the living environment. In daily life, people and devices are exposed to electromagnetic waves emitted by each other. Considering this condition, electromagnetic waves of Wi-Fi, Bluetooth and GSM networks in the environment were observed for the developed smart textile surface. In the environments where these networks were used, it was examined whether the smart textile surface data were affected by these networks. The Wi-Fi network used in the environment was set to be on Channel 1. The Wi-Fi was used as Channel 1 F0 = 2412 MHz and 2401–2423 MHz. At the same time, the measurement was made with the Bluetooth network open in the environment. Bluetooth worked on all 79 channels as 2402 MHz and 2480 MHz ultra-high frequency radio waves. Wi-Fi and Bluetooth channel frequency ranges are illustrated in Figure 16. Wi-Fi and Bluetooth channels in the 2.4 GHz ISM band.
32
The frequency ranges and power values of the wireless networks in the environment are shown in Figure 17. In Figure 17(a) and (b), respectively, the electric field of the frequencies is given as power in pW (picowatt) and dBm (decibel–milliwatts). The power value of the GSM 900 network is given in dBm in Figure 17(c). Wi-Fi, Bluetooth and GSM900 electric field power values: (a) - The electric field power values in pW. (b) - The electric field power values in dBm. (c) - The electric field power values in dBM for GSM 900.
Data were received from the smart textile surface in the same procedure in environments with or without Wi-Fi, Bluetooth and GSM 900 networks. In order to understand the data exchange more easily, the variation values were created. Thanks to the different values, the measurement change was followed due to the measurement system’s influence from external factors during the test. The difference values were obtained for the sitting surface B7 and back surface B7 points on the textile surface according to the first surface data. The variation values radar charts of the data received when the smart textile surface was empty are given in Figure 18. Interaction of the system from Wi-Fi, Bluetooth and GSM 900 networks: (a) - The data received from the sitting surface in the absence of the networks. (b) - The data received from the sitting surface in the presence of the networks. (c) - The data received from the back surface in the absence of the networks. (d) - The data received from the back surface in the presence of the networks.
In Figure 18(a) and (c), the variation values created according to the first value taken from the B7 sensor on the sitting surface are seen in the environments where Wi-Fi, Bluetooth and GSM 900 networks are open and closed, respectively. In Figure 18(b) and (d), the variation value graphs created according to the first value taken from the B7 sensor on the back surface are seen in the environments where Wi-Fi, Bluetooth and GSM 900 networks are open and closed, respectively.
When the findings are examined, it is observed that the data obtained from the smart textile surface are not affected by the electromagnetic field strength created by the Wi-Fi, Bluetooth and GSM 900 networks in the environment. As can be seen, the data received in the presence and absence of networks in the environment are almost the same.
Vibration measurements
It was measured whether the data received from the surface were affected by the vibration or shaking in the environment to use the smart textile surface in different environments. For this purpose, the data were obtained from the surfaces placed on the vehicle seat when the vehicle was not running and the vehicle was running for a certain period. The image of laying out the fabric surface on the automobile seat and data acquisition are presented in Figure 19. The RPM values are (a) 4000, (b) 3000 (c) 2000, respectively. Vibration values at different RPM values of test automobile. (a) 4000 RPM. (b) 3000 RPM. (c) 2000 RPM. (d) Not working.
Collecting data from fabric surface was continued during all measurement periods for 20 seconds (4 period × 5 s). Approximately 60 (3 × 5 × 4) data were collected since three data were obtained in one second. Sitting data (b) and their calibrate data (a) are given in Figure 20. Calibration and raw data of sitting surface. (a) Calibration values of sitting surface during vibration measurement. (b) Sitting surface raw data during vibration measurement. (c) 3D pressing map of sitting surface 3th value. (d) 2D pressing map of sitting surface 3th value.
When the findings are examined, since the calibration and threshold algorithm in Figure 6 were utilized, it has not observed any effect on the sitting surface, even if it has observed changes on raw sensor data. When Figure 11 is analysed, the changes on raw sensor data occur even if the surface is on an empty office seat. This circumstance showed that the designed calibration and threshold algorithm were successful to obtain meaningful results either in an environment with or without vibration.
In this study, a novel calibration and threshold algorithm were developed. The smart fabric adapts the shapes of a different surface by means of these algorithms and evaluates the pressing values according to these surfaces. The smart fabric surface has been tested on a separate seat surfaces which are different from each other (e.g., office seat and car seat) to prove the reliability of these algorithms. Thus, the reliability of the calibration algorithm of smart sensors on fabric surfaces has been verified by obtaining meaningful results, as seen in Figures 12–14 and 20.
Conclusion
In this study, upholstery electro-fabric, which is planned to be used in sitting furniture, was developed. Sensor connections were made after the fabric was produced. Data acquisition was realized both wirelessly and wired by establishing a fabric connection circuit. Considering that the fabric surface will be used in different environments, a calibration algorithm was developed to adapt to the surface it is used on. A 3D pressing map was drawn for meaningful visualization of the raw data received. It was observed that the pressing areas formed on the surface were displayed in a meaningful way on the 3D pressing map.
In this article, pressing values were interpreted by calibration, and threshold algorithms and surface pressing graphs were obtained in order to examine the sitting behaviours. Although the subject’s weight is constant, it can be seen that the pressure applied to the surface may vary depending on the sitting positions (especially when the feet are on the ground). The subject’s weight and unit were not measured in this simulation, as the pressing areas are more important. Studies on measuring weight may be the subject of another study.
The content that presented as supplementary material is explained both video graphic and Comma-separated values (CSV) document. The second video file includes visualization of sitting and back surface data given in the CSV file. There are 12 sensors data of A and B fabrics on sitting and back surfaces, respectively, in CSV file. For instance, 12 sensors of A fabric on the sitting surface are named as between Sitting-A1 and Sitting-A12. Likewise, 12 sensors of B fabric on the back surface are named as between Back-B1 and Back-B12. Therefore, there are 48 sensor data in total. The researchers interested in this study can calculate X matrix values in equation (1) and T value in equation (2) by using the data in the CSV file. Also, the researchers can obtain the surface pressing map. Thus, the algorithm in this study has become authenticated and suitable for the use of researchers.
The electricity consumption values of the smart textile surface were measured. When these values were examined, it was seen that an electro fabric system with low power consumption was developed. Since the smart textile surface is likely to be used in different environments (office, home, etc.), it was investigated whether the Wi-Fi, Bluetooth and GSM 900 networks in the environment affect the fabric’s data. As a result of the experiments, it was observed that the data taken from the fabric were not affected by the environment where the networks were at. In addition, there is a possibility that the developed smart textile surface can be used in vehicles. For this reason, it was investigated whether the data taken from the smart textile surface were affected by the vibration in vehicles. As a result of the experiments carried out in an automobile, it was observed that the data obtained from the fabric surface were not affected by vibration, and the 3D map of the pressure created on the surface did not change.
In conclusion, a smart textile surface based on upholstery fabric with low power consumption that works without being affected by Wi-Fi, Bluetooth and GSM networks and ambient vibration has been developed. In a sequel to this study, seating positions may be determined according to the print maps formed on the surface. Since the smart fabric surface can be used wirelessly, a mobile application may be developed through mobile devices and sitting behaviours may be monitored. A mobile application-based healthy sitting application may be developed for use in personal and healthcare fields. While using this surface, the users’ emotional states during sitting may be determined, and their relationship with the sitting posture may be investigated.
Footnotes
Acknowledgements
The authors would like to thank Usak University, Turkey. This work was supported by Usak University as a scientific research project [Project number: 2019/DTS001]. The authors thank to Prof. Dr Isa Yesilyurt (Mechanical Engineering of Uşak University) for helping vibration measurements. Besides, the authors are grateful to the company Polat Iplik Tekstil Sanayi ve Ticaret Ltd Şti. for producing the fabrics used in the study.
Declaration of conflicting interests
The author(s) declared no potential conflicts of interest with respect to the research, authorship, and/or publication of this article.
Funding
The author(s) received no financial support for the research, authorship, and/or publication of this article.