
Abstract
The aim of this study was to determine the thermophysiological comfort behavior of fabrics based on copper wire that can be used for electro-textile applications. For this purpose, hybrid folding yarns were produced by twisting cotton/polyester yarn with copper wire. These electrically conductive hybrid yarns were then used to produce upholstery fabrics with different weave types as plain, 2/1 twill and sateen weave in three different density levels as tight, medium and loose. Thermophysiological comfort properties such as air permeability, thermal and water vapor properties of the hybrid fabrics were measured. In addition, the heat transfer properties of the fabrics were investigated with thermal camera videos, and porosity values were determined from microscope images. In this way, the main thermophysiological comfort properties of the basic electro-textile structures were revealed. According to the results obtained, it was found that the use of conductive wire in the fabric structure did not negatively affect the thermophysiological comfort properties of the fabrics, and fabric density was a determining parameter in relation to the thermophysiological comfort properties of the fabrics. The obtained results of this study may be used to improve the design of electro-textile structures taking into account the thermophysiological comfort.
Introduction
With the increase in the competitive environment, the trend towards product groups with high technical performance and functional characteristics began to replace the classic textile products. These product groups are generally referred to as smart textiles. The subgroup of smart textiles, which uses sensors, electronic circuits, microprocessors, etc., involving several disciplines and industries, where research and development studies are carried out, is called electronic textiles. All these applications provide data acquisition of textile products, evaluate the collected data, react according to the situation and transmit the data. The term smart textile illustrates the ability of materials to perceive and react to external stimuli. It is known that smart textile applications appeared in the 1850 s with various electric corsets and belts for therapeutic purposes. In these corset designs, low and high frequency electricity was used to treat patients' complaints [1]. Looking at the history of electronic textiles, one of the first examples was the use of illuminated headbands in the ballet La Farandole in 1883 [2]. The miniaturization and cost reduction of electronic components and the development of advanced systems facilitated their integration into clothing and expanded the application range of electronic textiles. The spread of electro-textiles in the academic environment gained momentum at the end of the 1990s as a result of research published by the Massachusetts Institute of Technology and the Georgia Institute of Technology [3]. Swallow and Thompson described two layers of conductive fabric and the sensory fabric, which has a non-conductive network between them and can determine the distance of interaction from a connection point [4]. Cottet et al. examined the conductivity performance of the woven fabrics using copper wire in weft and warp yarns in the fabric structures [5]. Gimpel et al. produced fabric structures using silver-coated polyamide yarns to integrate sensors and microelectronic components in textiles. Comparative tests were carried out along with the galvanic and electrochemical processes [6]. Ramachandran and Vigneswaran have tried to design and develop electronic fabrics from yarns produced with the friction spinning system Dref-3, which have copper filament in the core and cotton fibers in the sheath [7]. Merritt et al. designed a textile belt with capacitive sensors to monitor the health status of patients [8]. Cieślak et al. presented functional upholstery fabrics with permanent electrostatic properties [9]. Palamutcu et al. investigated the electromagnetic shielding properties of single jersey knitted and plain woven fabrics produced using fine copper wire, silver-cotton blended yarns and 100% cotton yarn [10]. Delkumburewatte and Dias developed a portable cooling system for the thermal management of thermal protective clothing. It was found that the designed structure was a miniature cooling system that enabled heat and sweat management in difficult environmental conditions [11]. Ortlek et al. examined knitted fabrics made from hybrid yarns with metal wire, and found that the shielding effect of the knitted fabrics with metal wire was higher than without metal wire [12]. Bedeloglu presented electrically conductive woven fabrics made of acrylic fibers and stainless steel wires, and pointed out that the use of steel wire in fabrics increased the air permeability, pilling resistance, thermal resistance, and bending stiffness of woven fabrics [13]. Roh analyzed the physical and electrical properties by a new type of composite metal embroidery thread [14]. Kayacan evaluated the conductivity properties of textile-based conductive transmission lines and found that the electrical resistance to environmental stress changes in the form of washing and dry cleaning cycles [15]. Chen et al. proposed a micro-cable current transmission textile that simultaneously collects energy from ambient sunlight and mechanical movement. In line with this goal, solar cells made from light polymer fibers down to microcords were then woven into an smart fabric using fiber-based triboelectric nanogenerators [16]. Soukup et al. developed a temperature and humidity sensor by applying an embroidery with silver-containing filaments to the fabric surface [17]. Hamdani et al. investigated the heating properties of a nylon knitted fabric that can be used as upholstered furniture, and concluded that polypyrrole heating fabric is suitable for heating close to the body [18]. Heo et al. presented a portable textile antenna embroidered on fabric for wireless power train applications. For this purpose, a planar spiral coil of conductive yarn was fabricated on a cotton substrate and connected to a rectifier circuit fabricated on a flexible polyethylene terephthalate film to form a flexible receiver by magnetic resonance [19]. Ahmed et al. presented the design and manufacture of a flexible textile antenna attached to denim fabric to operate at 5.8 GHz as the center frequency in the portable antenna design [20]. Asl et al. presented a noise model of textile capacitive contactless electrodes for bioelectric measurements [21]. Deng et al. designed a spirally swollen structure in core-sheath fibers for tactile sensor textiles, which have a sense of deflection-free pressure and spatial sharpness [22]. Hassan et al. investigated conductive cotton fabrics through the approach of copper metal coating and showed that the knitted cotton fabrics, which have finer yarn counts, could be available for electro-textile applications [23].
As can be seen from the literature, many studies referred to electronic textiles including temperature control, sensors, textile switches, lighting animation, electromagnetic shielding, and so on. Although many important studies have been carried out on electronic textile products, there are few studies that investigate their comfort and performance characteristics. Although industrial applications are considered in the manufacture of electro-textiles, depending on their application, these fabrics have contact with the human body. With regard to human body contact, it is important that the user feels comfortable with these fabrics and that they offer functional properties. In this study, the upholstery fabrics, which can be used as basic structures for electro-textile applications in different areas such as automotive, medical and military, were made from electrically conductive hybrid yarns including cotton/polyester and copper wire. Subsequently, the thermophysiological comfort properties of these electrically conductive woven fabrics were investigated with air permeability, thermal conductivity, thermal diffusivity, thermal absorptivity, thermal resistance, water vapor resistance measurements, image and video processing analysis. Therefore, the findings of this study will open the way for understanding and discussing the influence of different parameters and fabric combinations on the thermophysiological comfort properties of electro-textile structures, and the obtained results may contribute to future studies on electro-textiles.
Materials and methods
Materials
In the scope of the study, the production of woven fabrics containing copper wire was planned to form electro-textile upholstery fabric structures. As part of this plan, nine different woven fabrics were systematically produced with three different weave types such as plain, 2/1 twill and sateen in three different density levels as tight, medium and loose. A rapier weaving machine (PTS 4/J, Lindauer Dornier, Germany) with a jacquard unit (Unival 100, Stäubli AG, Germany) was used for the flexible and fully automatic production of fabrics in the same machine settings. Ne 10/1 (59 tex) open-end yarns with 25% polyester/75% cotton content were used as warp yarn in the woven fabrics. For the weft yarn, three-ply hybrid yarns with a twist of 120 turns per meter (TPM) in the S direction were produced from two twists of the open-end Ne 12/1 (49 tex) 25% polyester/75% cotton blended yarn and one ply of 0.30-micron copper wire. A yarn folding machine (Volkmann VTS08, Volkman GmbH, Germany) was used to combine copper wires with yarns. The copper wire used in the weft yarn was coated with varnish, which gave the weft yarn insulating properties. The copper wires only had open ends, and the varnish at these ends was corroded for connection to the circuit and electrical wiring. The illustration of the three-ply weft yarn prepared for weaving is given in Figure 1.

Three-ply hybrid weft yarn used in the weaving.
The weave patterns used for woven fabrics are shown in Figure 2 for plain, 2/1 twill and sateen, respectively. In addition, the production steps and illustrations of the materials produced are shown in Figure 3.

Weaving designs used in the study. (a) Plain, (b) 2/1 Twill, (c) Sateen.

Photos of fabrics and their production process. (a) Plain, (b) 2/1 Twill, (c) Sateen.
The physical and structural properties of produced fabrics, which were measured under the related standards (ASTM D1777 – 96, 2019; ASTM D3776/D3776M:09a, 2013), are presented in Table 1.
The physical and structural properties of the woven fabrics.
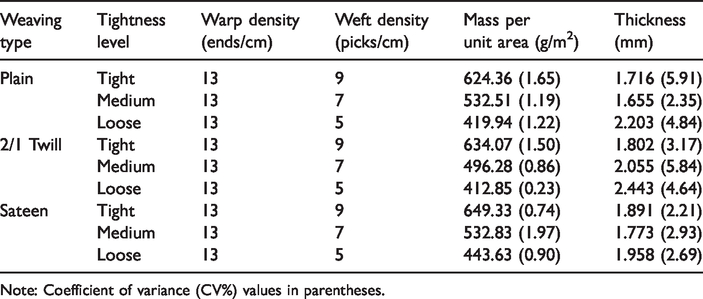
Note: Coefficient of variance (CV%) values in parentheses.
Methodology
All samples were kept in the laboratory for 24 hours under standard atmospheric conditions (20 ± 2oC, 65 ± 2% RH) prior to testing according to ASTM D1776/D1776M-15. The prepared samples were used to perform the main thermophysiological comfort tests such as air permeability, thermal and water vapor measurements, thermal camera and microscope image processing.
Optical porosity analysis
In order to investigate the relationship between the pore structures of the fabrics and breathability, microscopic images of the fabrics were taken. According to the NF G 07-111 standard, porosity (ε) is defined as a relationship between the airflow (QVe) through a piece of fabric and the airflow to the vacuum (QV0) and is expressed by equation (1).
Microscopic images were processed and analyzed to determine the optical porosity percentages of the fabrics. To analyze the optical porosity according to this standard, the image had to be converted into a binary image. In the binary image, the white pixels were considered to be pores that facilitate air permeability, while the black pixels were accepted as threads that prevent air intake. The Olympus BX53 microscope (Olympus Corporation, Japan) with an Olympus LC30 camera (Olympus Soft Imaging Systems, Germany) was used to obtain microscopic images of fabrics. The images were taken with the oil lens (MSPlan 100X objective). The microscopic images were analyzed using image processing techniques to determine the porosity size of the fabric and the sizes were calculated in percent. For this purpose, porosity characteristics and yarn areas were extracted. First, the microscopic image was separated into the red, green and blue layers. A ranking filter was applied to improve the image. Then, the variance values of the areas representing the pore in each layer were used as an adaptive threshold, and each layer was transformed into a binary image by the threshold. The binary image of each layer was combined into a single image. The dilation operator was used to make the white areas representing a pore clearer. In the last image, black and white pixel values were counted and the porosity rate was determined. The process of calculating the porosity rate by image processing is shown in Figure 4. In Figure 4, the red areas in the last picture were represented as pore structures.

Flowchart of feature extraction for porosity.
The optical porosity value was obtained from the binary images of the fabric samples based on the ratio between the white pixels (pores) and the sum of the white and black pixels (yarns) [24]. The images of the porosity range (red) of the sample in plain weave after the image processing are given in Figure 5.

(a) Microscopic image and (b) the porosity area of plain fabric.
Thermal video processing and feature extraction
Thermal camera measurements were carried out to investigate the thermal behavior of fabrics. An experimental set-up was created to extract the thermal video properties of fabrics. The system used to determine the thermal behavior of fabrics is shown in Figure 6. The system consisted of a thermal camera (1), a sample fabric and its holding-frame (2), a heater surface (HS) (3), a temperature control unit (TCU) (4), a power supply (5) and a remote monitoring device (6). The holding-frame was used to hold the fabric in a square shape and this was used to insulate around the sample. The HS was a square heating coil in 30×30 cm2 dimensions. The sensor of the TCU was connected to the middle of the HS. The TCU transferred the 12 V DC that obtained from the power supply to the HS according to the feedback temperature value of its sensor in a controlled manner. The sample which was placed on HS was fastened to a frame in 11×11 cm2 on the outside and 8×8 cm2 on the inside, so that it fits HS correctly. The samples conditioned under room conditions (24 °C and 40% RH for 24 hours) were placed on HS set up 35 °C. The temperature distribution on the sample was recorded by the thermal camera for 1 minute. In this study, the thermal camera Testo 872 (Testo SE & Co. KGaA, Germany) was used. The snapshot of the thermal camera was transferred to a tablet over Wi-Fi and recorded as a video file for each sample during the measurement. The video files of each sample were analyzed by a thermal video analysis software via two methods.
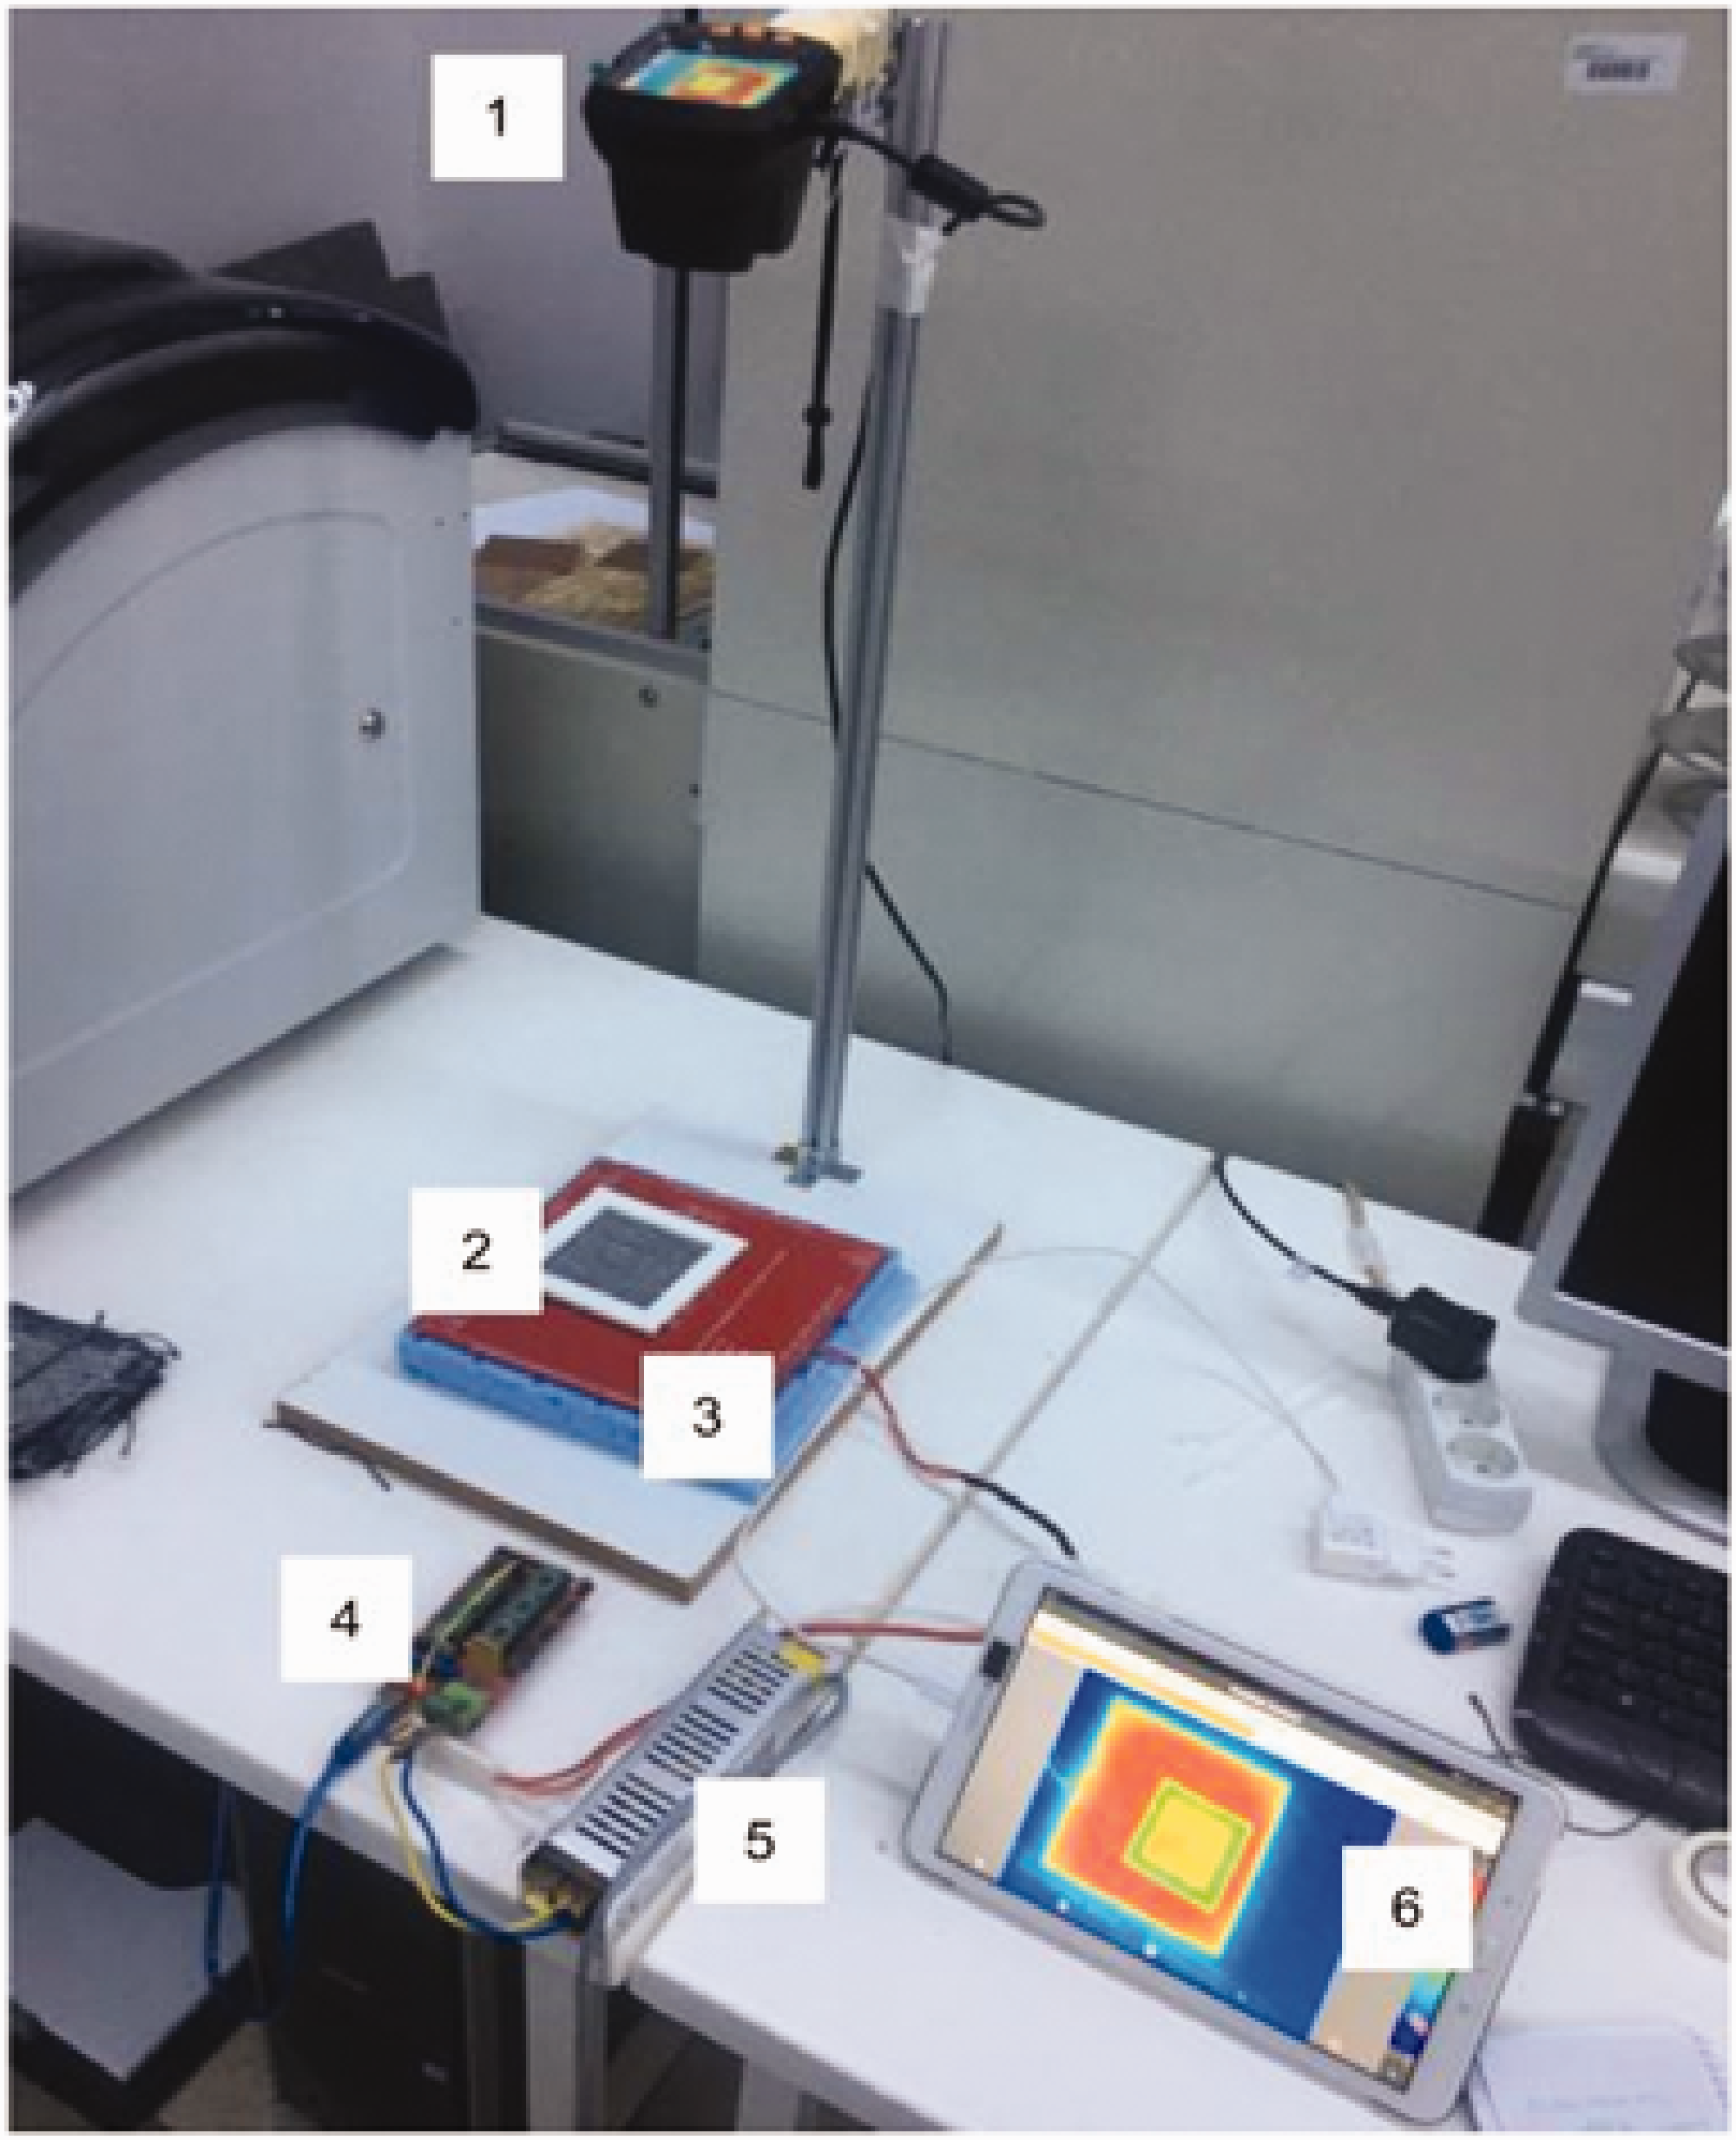
Thermal camera experimental setup.
In thermal imaging, primarily a special lens focuses infrared light, which is emitted by all objects in the view. The focused light is scanned by a series of infrared detector elements. The detector elements create a very detailed temperature model called a thermogram. It takes only a thirtieth of a second for the detector array to obtain temperature information to create thermograms. This information is obtained from several thousand points in the field of view of the detector array. The thermogram generated by the detector elements is converted into electrical pulses. Their pulses are sent to a signal processing unit, a circuit board with a special chip, which converts the information from the elements into data for the screen. The signal processing unit sends the information to the screen, where it appears in different colors depending on the intensity of the infrared transmission. The combination of all pulses from all elements creates the image. Coding is required to represent the temperature values of the created image. This coding can be done with techniques such as grayscale or RGB (Red, Green and Blue) conversion. In this study, we preferred to use the image in color. The conversion of the temperature to the RGB color map was coded in direct proportion for each channel, as shown in Figure 7. RGB coding is expressed by three values (Red, Green and Blue) in a pixel color image. These values correspond to the brightness value of the 3 Light Emitting Diode (LED) that make up a pixel. If the color channel that makes up each pixel is encoded as 8 bits, this means 256 (28) different values. These values are coded on the computer from 0 to 255, where 0 is an off LED, while 255 is a brightest LED. RGB encoding depends only on the value of the pixel to which it belongs, not related to the pixel's coordinate. The temperature value in the color map was displayed with blue color for low temperatures, green color for medium temperatures and red color for high temperatures. The temperature color scale for the thermal camera was attached and stored as blue color for the lowest value, which was 21°C, and red color for the highest value, which was 36°C. The scale used for RGB encoding is linear. In the coding of temperature values, for example, the lowest temperature (21°C) is coded as (0,0,255), the highest temperature (36°C) is coded as (255.0.0) and a intermediate value 24.75°C is coded as (0,127,127).

Thermal camera temperature to RGB relation.
The camera we use in the study produces a temperature map and can also measure the temperature at the center point as shown in Figure 8. When viewing the temperature at the center, the temperature value corresponding to the pixel values in the middle pixels is added as text and pointer. In the study, the temperature measurement at the center and the heat maps of the fabrics were obtained from the videos of the thermal camera. The center point temperature measurement is only used for reading text from the image described in the next section.

Sample video frames.
Each thermal video frame of the fabric samples was processed with the thermal video analysis program. The analyzes were performed according to the thermal camera temperature value and the RGB values of the video, respectively. The flow charts belonging to these methods are shown in Figure 9.

Flowchart of thermal video processing.
Thermal camera pointer read with tesseract image to text converter
In this method the temperature values measured by the thermal camera were used. The ROI (Region of Interest) field and the temperature value were obtained together with a time stamp at each temperature change, starting with the first frame of the video. The temperature value was read on ROI via optical character recognition. The mean time information for 1°C temperature change, the mean change temperature in 1 second, and the mean times reached the first highest temperature were obtained from these values for each fabric sample.
Histogram channel value calculation from time series
The histogram channel value calculation, which is a process of calculating a change the channel expected value in time, was used for the evaluation of thermal videos. The process flowchart is shown in Figure 10. The histogram of an image is not related to the coordinates of the pixels. The examination of the histogram of any data set is a fundamental plot operation and gives an overview of the density distribution of a data set. In this study, all pixels in the image frames that make up the video are accepted as a data set. When extracting the histogram of an image, the probability density function of all pixels that make up the image is used [25].

The histogram channel value calculation from time series.
The thermal video is a collection of frames. The image from the thermal camera was recorded at 19.5 frames per second, which means that a thermal measurement of the entire region the camera sees is made in 0.0512 seconds each. The thermal image was transferred from the camera to the tablet via Wi-Fi and recorded on the tablet. To process only the fabric a region of interest (ROI) selection was made. After the unnecessary parts on the recorded video were removed, only a sequence of cropped frames remained, and these frames included only the fabric surface. The second step was to calculate the time series of the histogram. For each frame, an expected value for each channel was calculated according to equation (2).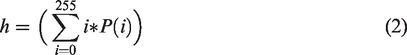
The h value is the expected value on the thermal image. The h value of each channel is the product of the value of the variable and the probability density functions. The variable i is between 0–255 for each RGB channel of an image pixel. P(i) is the probability density function. The probability density function of any variable is between 0 and 1. As a result, the calculated h is between 0 and 255. An example graph of the change of expected value in RGB channels over time is illustrated in Figure 11.
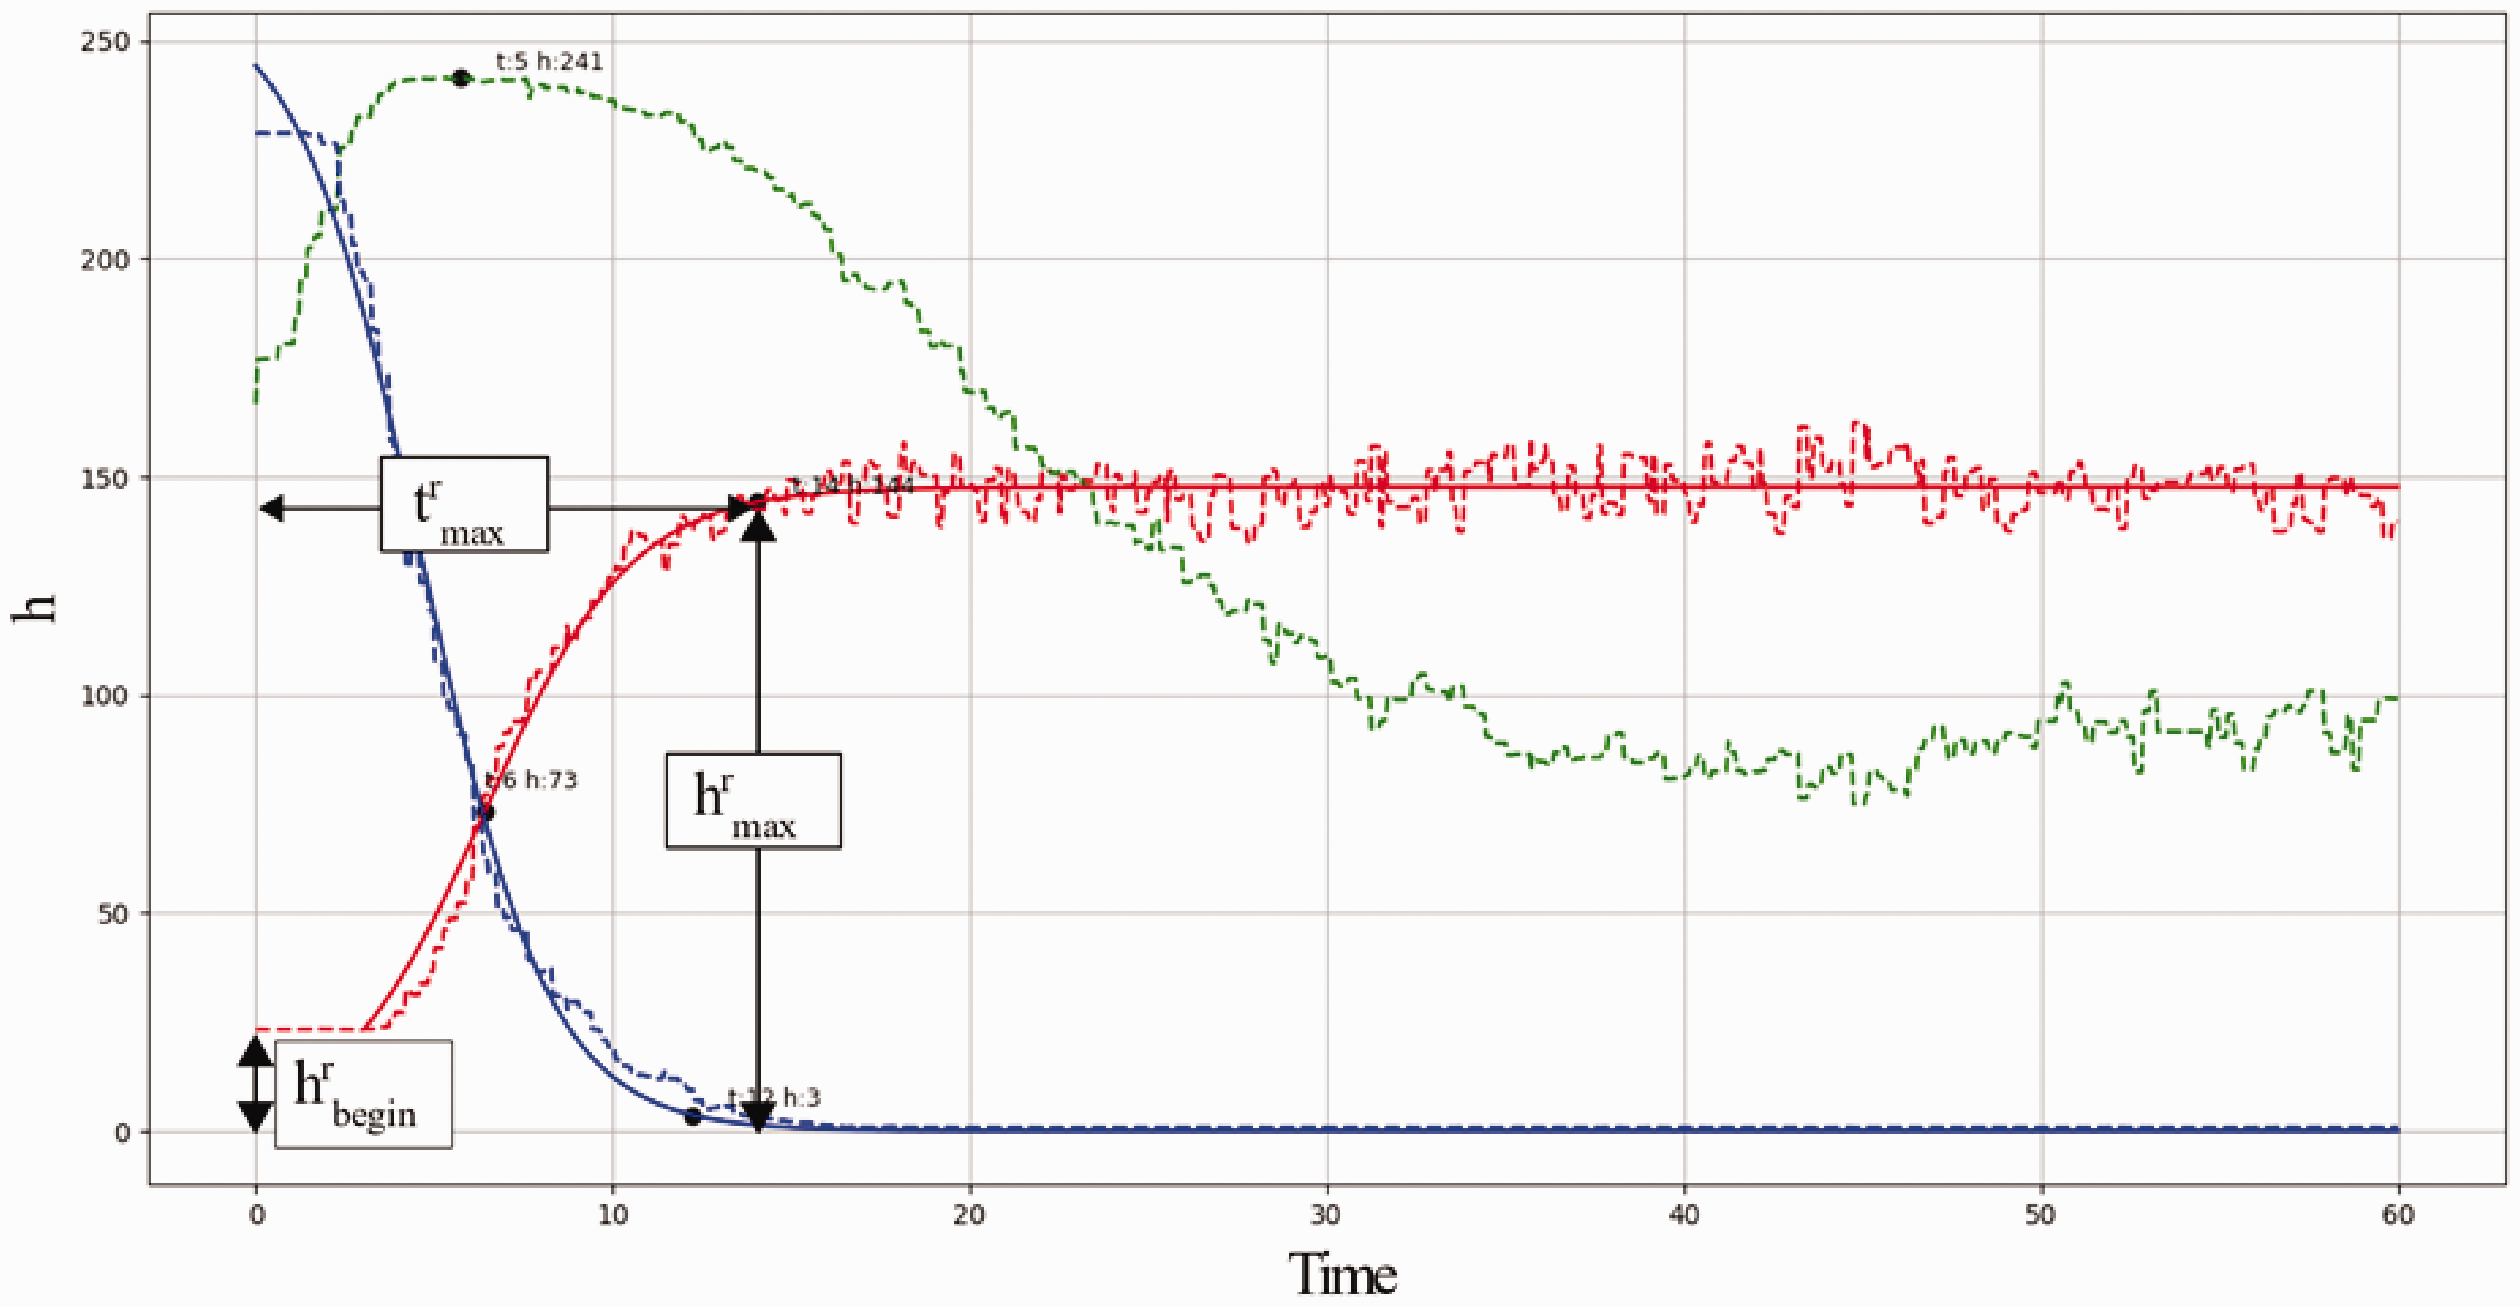
The change of expected value in RGB channels over time.
The value of the histogram channel (ΔR) was obtained by dividing the expected value change by the time change according to equation (3).
The hrmax value in this equation is the first peak value of the red channel. The value of hrbegin is the initial value of the red channel. trmax is the time until the red channel reaches hrmax. According to the parameters determined, the value of ΔR showed the time-dependent propagation of heat (heat dissipation) in the fabric. The obtained HCV value was filtered with the moving average/running average method
Thermophysiological comfort measurements
Air Permeability Tester (FX 3300 TexTest Instruments Air Permeability Tester III, Textest AG, Switzerland) was used to measure the air permeability values of the samples. The measuring unit was chosen as l/m2/s, the test pressure was 100 Pa, the test area 20 cm2 and each test was repeated 10 times according to ASTM D737-04. Thermal parameters such as thermal conductivity, thermal diffusivity, thermal diffusion, thermal absorptivity and thermal resistance of the produced woven fabrics were measured by Alambeta (Sensora Instruments, Czech Republic), which was invented by Hes et al. [26]. The test of each sample was repeated five times, and a contact pressure of 200 Pa was determined. The Permetest test device (Sensora Instruments, Czech Republic), which was also invented by Hes et al. [26], was used to measure the water vapor permeability and water vapor resistance of samples under ISO 11092.
An analysis of variance with a confidence level of 95% was performed using the statistical software SPSS 23.0 to obtain F and p values for all test samples, and p < 0.05 was considered significant for the statistical evaluation of the test results.
Results and discussion
In this study, air permeability, thermal conductivity, thermal diffusivity, thermal absorptivity, thermal resistance, relative water vapor permeability and water vapor resistance of electro-textile upholstery woven fabrics were investigated using nine different weave types and setting levels. The results of the measurements were evaluated, and the electro-textile structures were analyzed.
Porosity
Porosity is one of the main physical parameters that have a great influence on the thermophysiological comfort properties of fabrics. It determines the bulk density, moisture absorption capacity, mass transfer and thermal conductivity of the fabric [27]. The percentage porosity values obtained by processing the microscopic images of the fabrics are shown in Figure 12.

Porosity of the fabrics.
When examining the results of the porosity analysis, it was found that the porosity of the fabric was ordered according to the density levels of the fabrics. It was found that the fabric density is the main factor in determining pore size and pore distribution in the fabric. When the fabric structure changes from tight to loose, the pores expand, and the ways in which air can pass increases [28]. Different weave types create different images on the fabric surface, and different intersections of the yarns determine the geometric shapes and dimensions of the pores. The sateen weave fabrics produced in the study, which have longer jumps and greater coverage compared to other weave types, had a lower porosity level than others.
Thermal video analysis
The temperature values were measured by the thermal camera to determine the time information for 1°C temperature change, the average temperature change in 1 second. After the heat was given to the fabric samples, the time to reach the maximum temperature recorded by the thermal camera is shown in Figure 13.
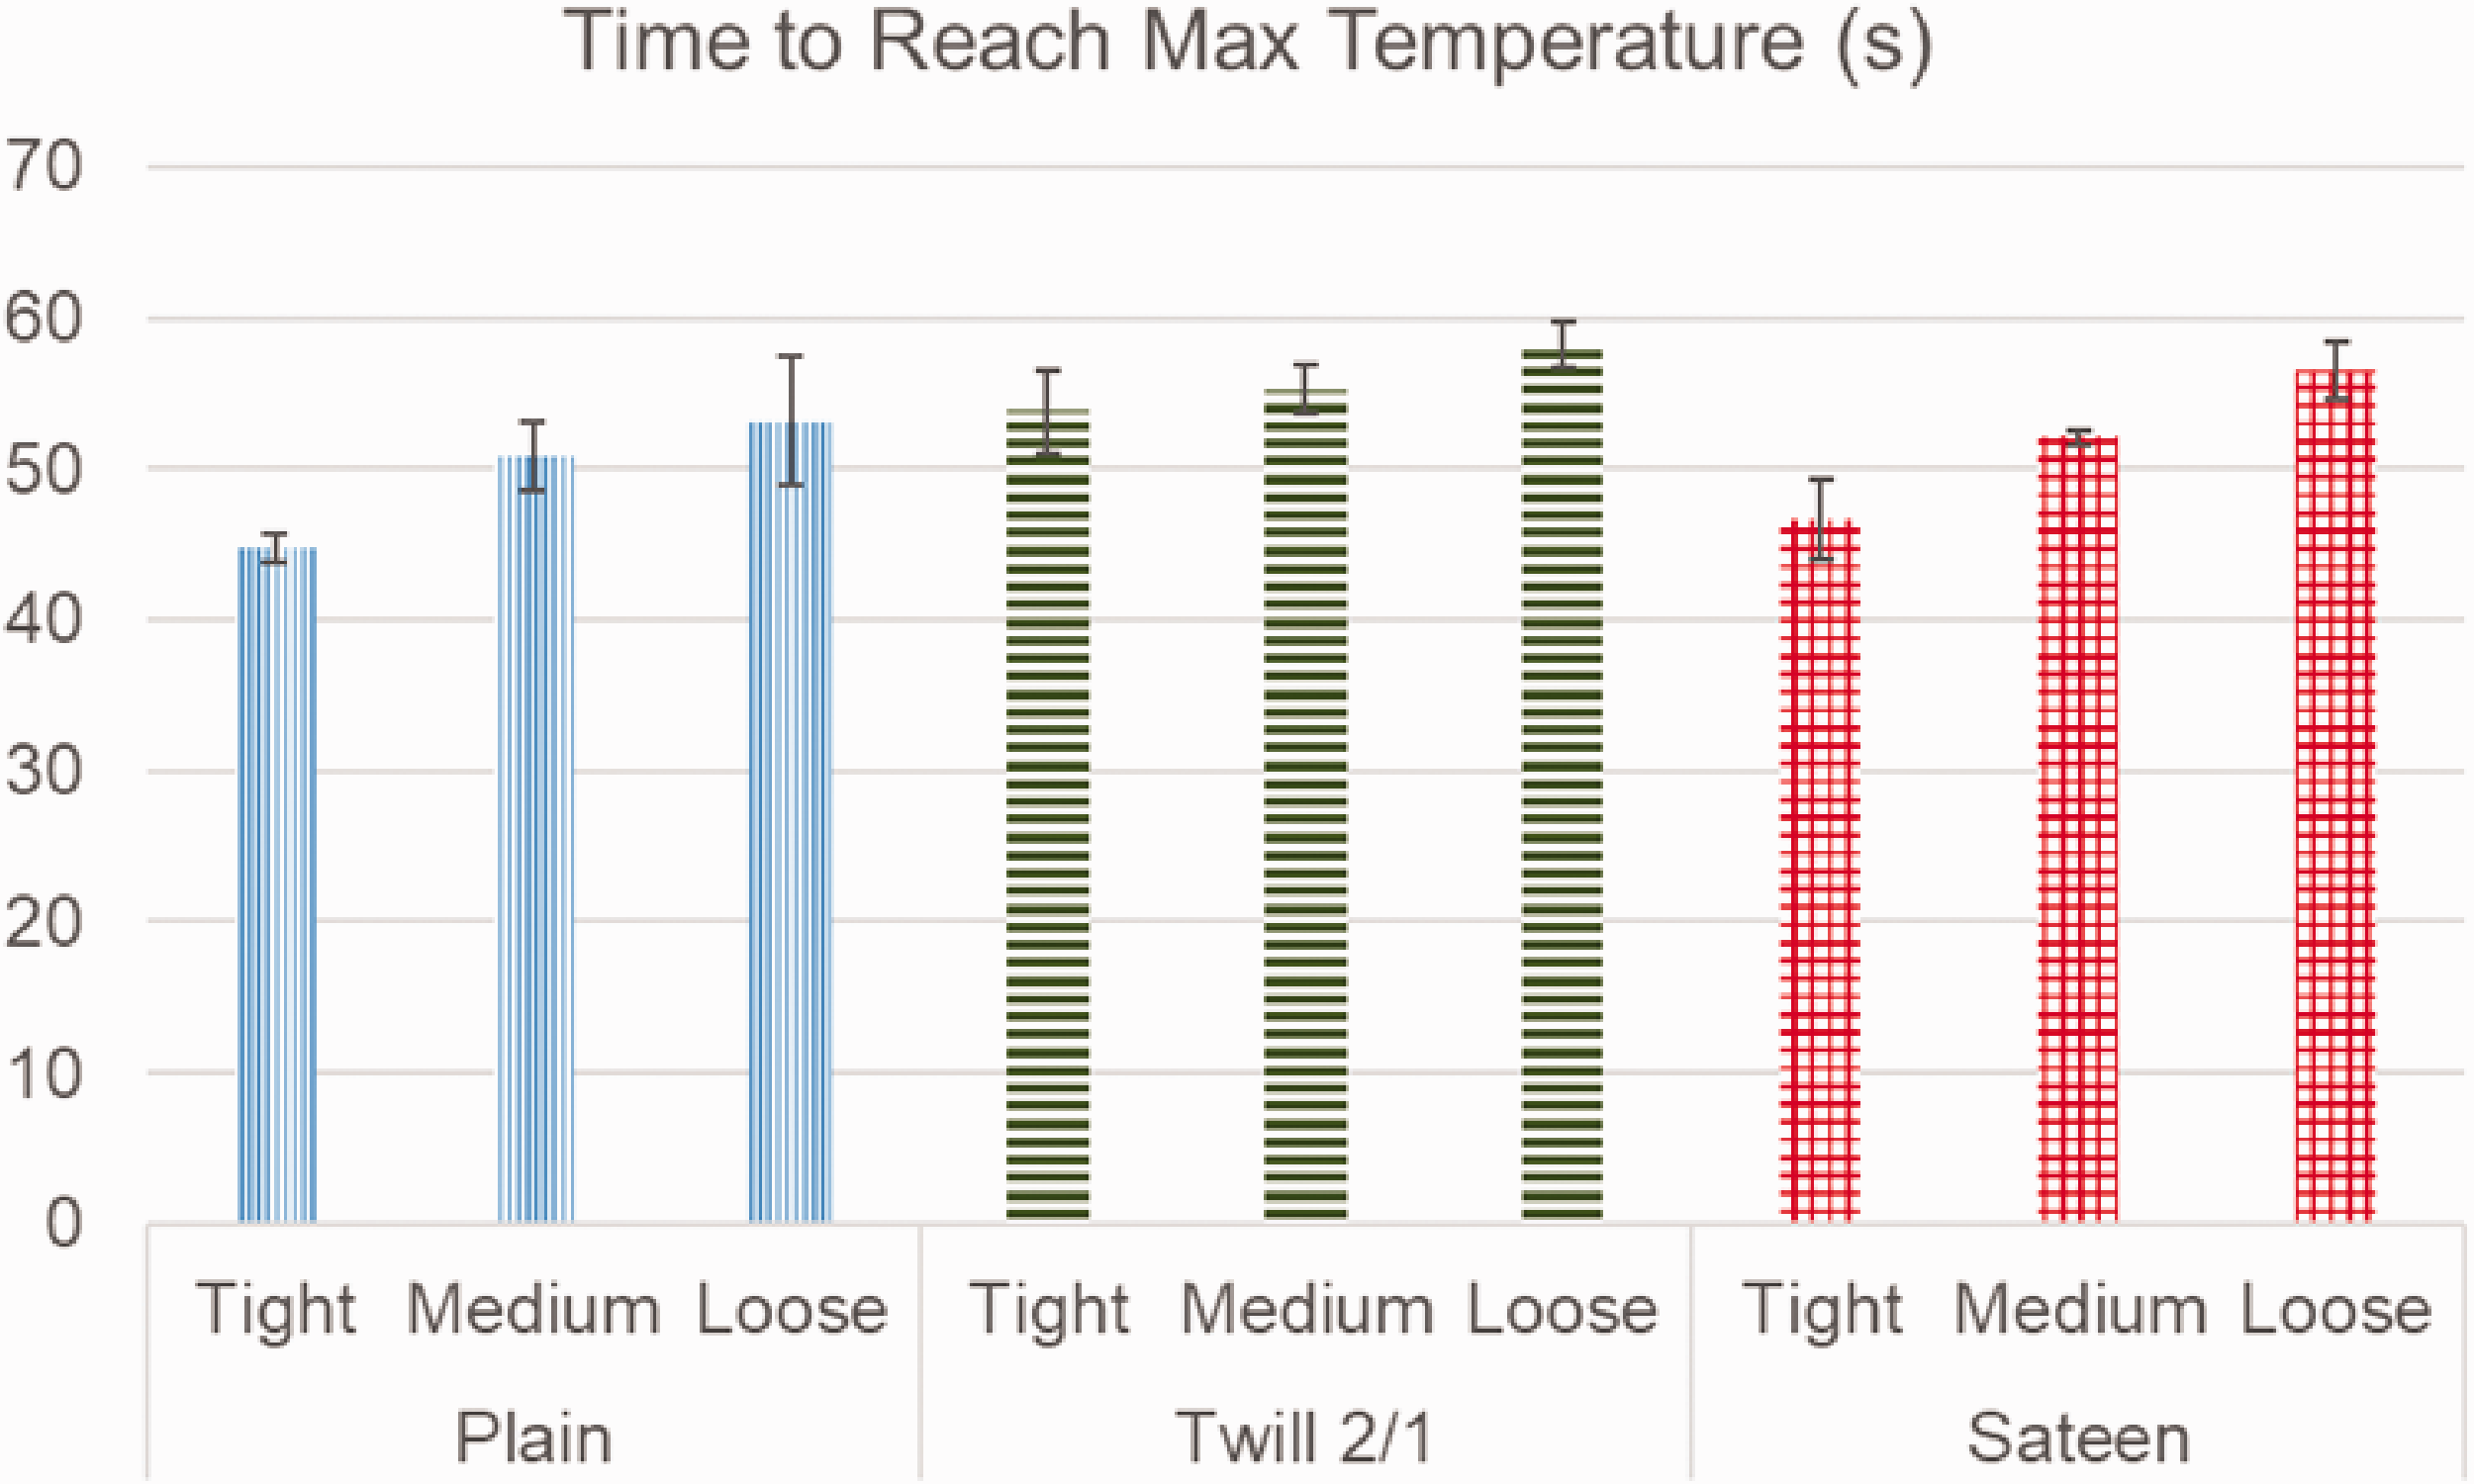
Time to reach max temperature of the fabrics.
According to this test method, time to reach maximum temperature value of the fabric indicates that it rapidly transfers heat from the surface with which it comes into contact. When the findings were examined, as the fabric setting increased, the yarns in the fabric structure got closer to each other, the air gaps decreased and the conductive heat transfer was accelerated. As Mohammadi et al. noted, if only the conduction mechanism is considered, the thermal conductivity should continuously decrease with decreasing mass density due to the reduced contact point [29]. In addition, plain fabrics having a more compact structure showed higher thermal conductivity behavior because they contain one-to-one overlaps. As the fabric structure becomes more compact, there is maximum contact between the fibers and between the yarns, and heat transfer will be effective [30].
The heat dissipation conditions obtained by processing the fabrics from the RGB values in the thermal camera videos are shown in Figure 14.

Heat dissipation values obtained from RGB.
As the findings show, the contact area between the yarns increased as the fabric structure tightened and the heat spread in the fabric structure accelerated. It was also found that the twill fabric structure had higher values of heat dissipation capacity than other fabrics. This could be attributed to the diagonal design in the twill weave, which causes a high heat dissipation change in a unit area.
Air permeability
The term air permeability refers to the speed of the air flowing vertically through a test piece whose conditions such as area, pressure drop and time are determined [28]. The concept of air permeability is used to explain the character, functional performance and breathability of the fabric. The air permeability results of the samples are shown in Figure 15.

Air permeability results of the fabrics.
As seen in the results, the values obtained were closely related to the porosity of the fabrics. When the air permeability values were analyzed, it could be seen that the highest values belonged to the looser fabrics as expected, followed by the medium and tight fabrics, respectively. As seen in loose fabric structures, as the fabric density decreased, the fabric structure became more open and porous, and the ways that air can pass through the fabric increased. This situation was clearly seen in the porosity measurement results. The effect of the setting on the fabric air permeability was observed to be statistically significant as was clear from the large value of F = 4212.53 and p = 0. In terms of the effect of weaving type on fabric air permeability, it was determined that twill and sateen fabrics had high values and the plain fabrics had the lowest values and the difference was statistically significant (F = 52.44, p = 0). This finding is in accordance with the other researchers [31–33]. Since plain fabrics have the highest warp and weft yarns interlacing, the pores decreased and the air transfer rate decreased. Considering these results, it is thought that the electronic wires, which are more rigid than yarns, in the structure of the fabrics may have made the change in the pores more obvious. Furthermore, this observation is in agreement with data from Bedeloglu, who indicated that utilization of wire in the fabric structure makes the yarn more compact, and so air permeability of fabrics increases [13].
As seen in the results, the values obtained were closely related to the porosity of the fabrics. The analysis of the air permeability values showed that, as expected, the highest values belonged to the looser fabrics, followed by the medium and tight fabrics, respectively. As can be seen in the loose fabric structures, as the fabric density decreased, the fabric structure became more open and porous, and the ways in which air can flow through the fabric increased. This situation was clearly shown in the results of the porosity measurement. The effect of the setting on the air permeability of the fabric was observed to be statistically significant, as can be seen from the large value of F = 4212.53 and p = 0. Regarding the effect of the weave type on the air permeability of the fabric, it was found that twill and sateen fabrics had high values and the plain fabrics had the lowest values and the difference was statistically significant (F = 52.44, p = 0). This finding is consistent with the other researchers [31–33]. Since plain fabrics show the highest warp and weft interlacing, the pores decreased and the air transfer rate decreased. In view of these results, it is assumed that the electronic wires, which are more rigid than yarns, may have made the change in the pores in the structure of the woven fabrics more obvious. Furthermore, this observation is in agreement with the data from Bedeloglu, who pointed out that the use of wire in the fabric structure makes the yarn more compact, thus increasing the air permeability of the fabric [13].
Thermal properties
The thermal properties of fabrics are important and interesting for textile research, as they are the main characteristics in determining the thermophysiological comfort of clothing. With the Alambeta device developed by Hes [26], seven parameters of the thermal properties of fabrics can be measured. These are thermal conductivity, thermal diffusion, thermal absorption, thermal resistance, thickness, maximum heat flow, and constant heat flow at the contact surface.
The thermal conductivity is a measure of the amount of heat emitted by the material in unit thickness, 1 K temperature difference. It occurs when two surfaces of the material are exposed to a temperature difference of 1 K. The thermal conductivity property of clothing plays a decisive role in the dissipation of excess heat generated by physical activity in the body. The results of thermal conductivity measurements of the woven fabrics produced from different weave types and settings are shown in Figure 16.
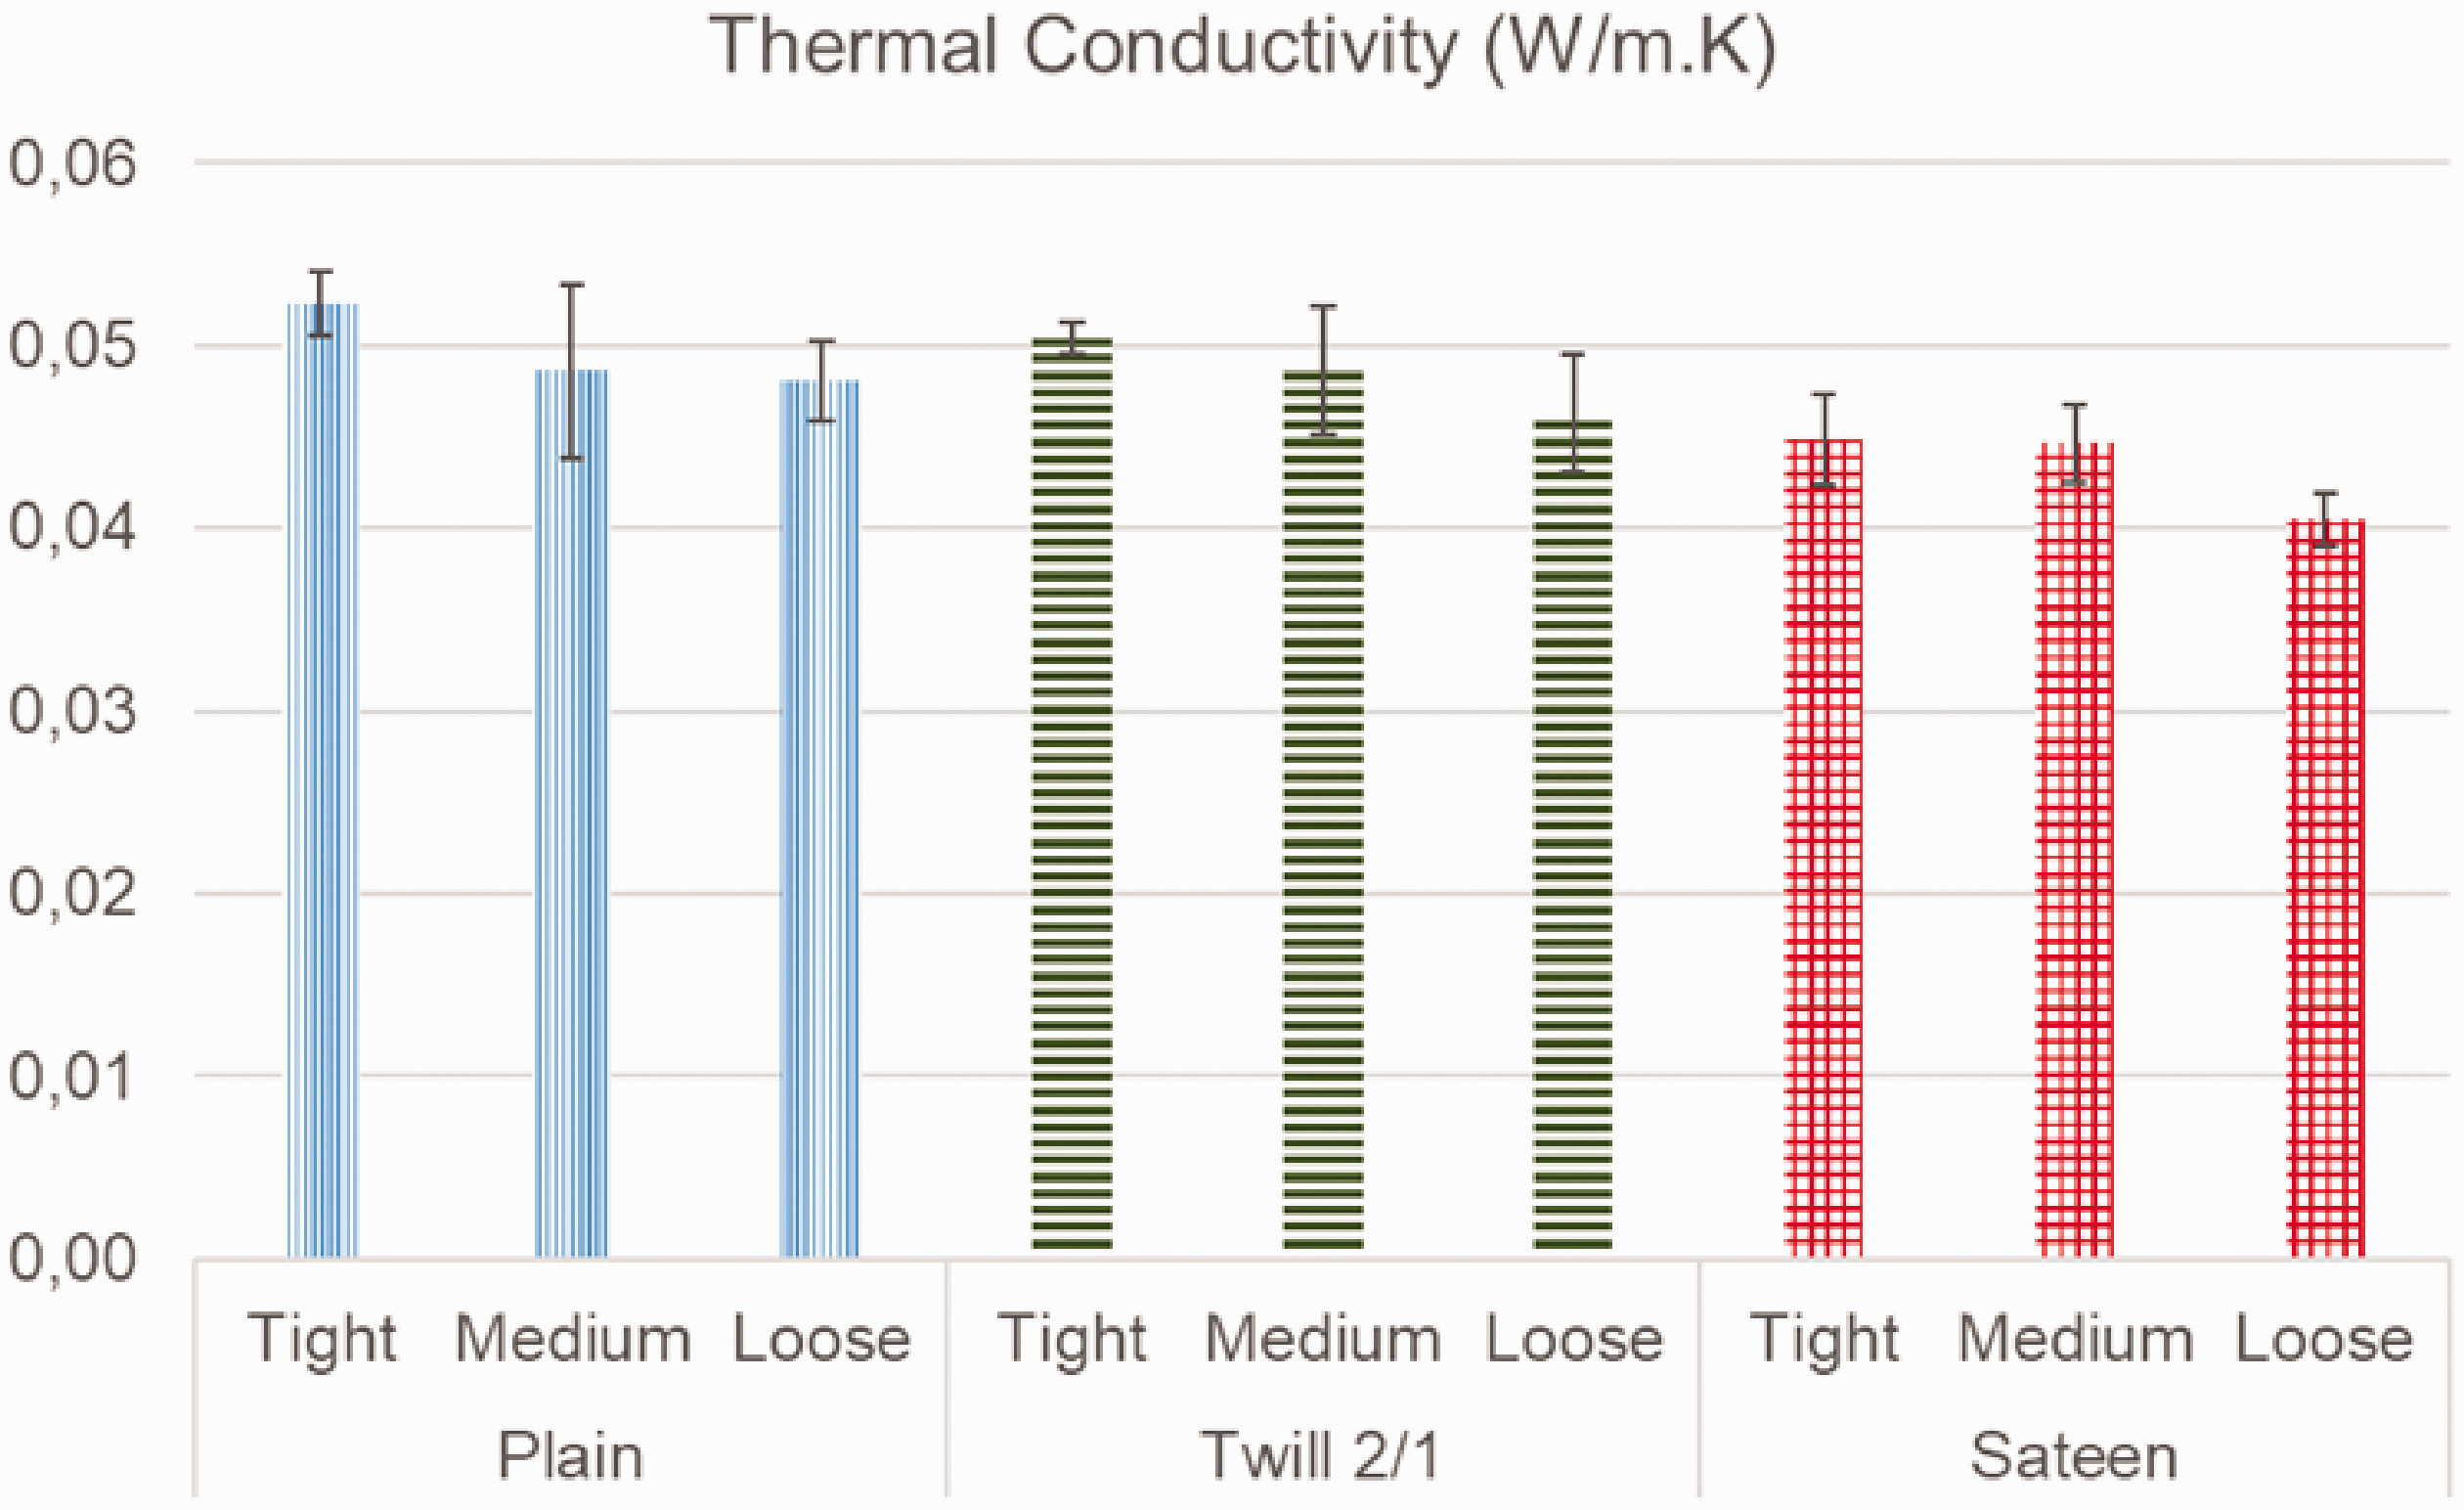
Thermal conductivity results of the fabrics.
When examining the test results and statistical analyzes, it was found that the fabrics with sateen weave were separated from other fabrics and had the lowest thermal conductivity values (F = 34.41 and p 0), while twill and plain weave fabrics showed the statistically equally high thermal conductivity effect. The results showed that plain weave fabrics had about 15% higher thermal conductivity than sateen weave fabrics. The sateen weave is characterized by long floats of weft and fill yarns covering the fabric surface. It can be said that these long floats in the structure reduced the intersection and contact area of the yarns, which reduced heat transfer by contact. With regard to the settings, it was observed that loose fabrics were statistically different from others, with the lowest values (F = 18.11 and p = 0). When compared with the results obtained with the thermal camera test method, it was found that the results of thermal conductivity showed a similar trend to the results obtained from the time to reach the maximum temperature. Thanks to the increase in fabric density, the yarns had more contact with each other, and conductive heat transfer occurred faster.
Thermal diffusion is related to the ability of the heat flow to pass through the air in the fabric structure. The thermal diffusion of textile materials is the temporary thermal characteristic of textiles. The results of the thermal diffusivity measurement are presented in Figure 17.

Thermal diffusivity results of the fabrics.
Similar to the results for thermal conductivity, fabrics with sateen weave (F = 4.99 and p = 0.12) and loose density (F = 36.18 and p = 0) were statistically distinguished from other fabrics. While loose fabrics showed the highest thermal diffusion values, sateen fabrics showed lower values than loose settings of other fabrics. As could be seen from the porosity results, loose fabrics showed a very high degree of porosity. Considering that thermal diffusion is the ability of the heat flux to pass through the air in the fabric structure, it can be said that the reason for this situation was the large pores of the loose fabrics.
Thermal absorptivity expresses the sudden heat flow that is caused by the contact of two parts with different temperatures. If the thermal absorption value is low, the fabric gives a warm feeling at the first contact, if it is high, it gives a cold feeling. The measured thermal absorptivity values are illustrated in Figure 18.
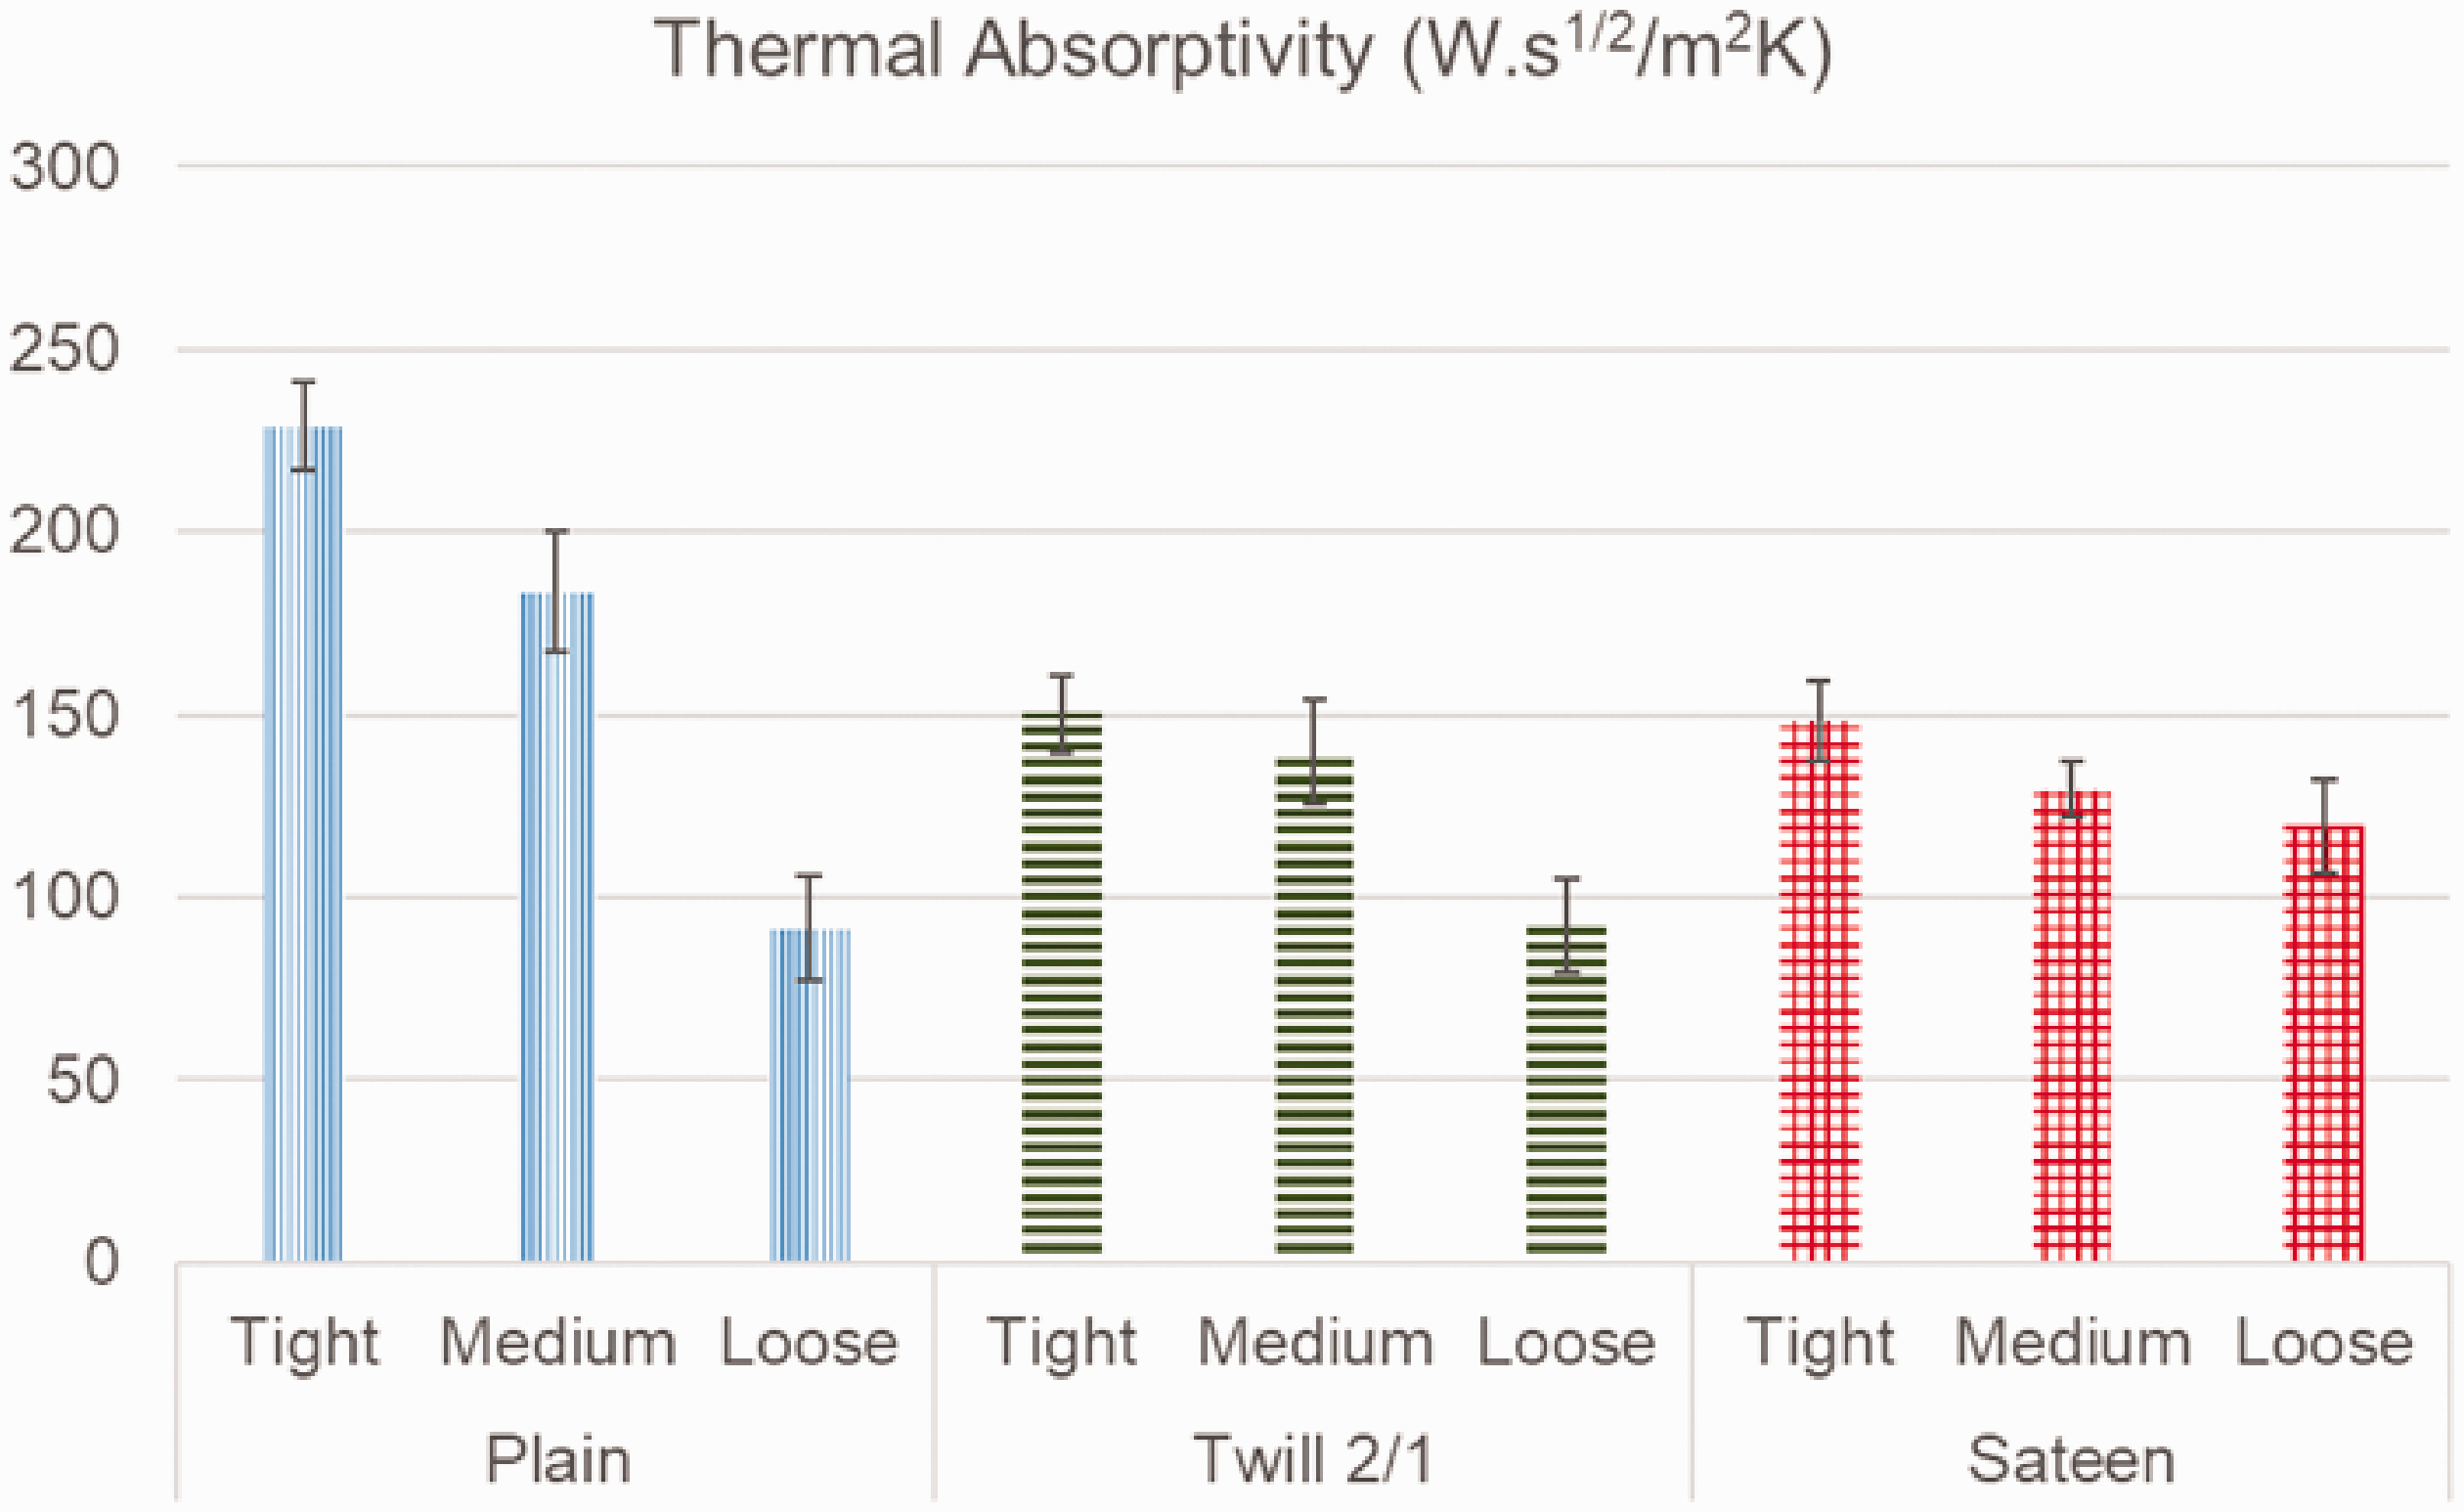
Thermal absorptivity results of the fabrics.
When examining the test results, it was found that plain weave fabrics generally had high thermal absorption values. Furthermore, the differences between the fabric types were statistically significant (F = 19.18 and p = 0). Plain weave fabrics had higher intersections of warp and weft yarns and a higher compactness [32], and this condition may be the reason for this. With regard to setting, it was found that the thermal absorptivity decreased with decreasing fabric setting. Statistically significant differences in setting were also found (F = 61.61 and p = 0). Based on the findings, one could say that plain fabrics and tight fabrics give a cool feeling on first contact. This is because a more compact surface transfers heat quickly on first contact and gives a cooler feel [34].
Thermal resistance is the temperature difference between two sections of material, and it is the quantity defined by dividing the heat flow rate between the sections and showing the resistance to heat transfer. Especially for activities performed in cold weather conditions, thermal resistance determines the thermal insulation properties of the clothing. The measurement results of thermal resistance are shown in Figure 19.

Thermal resistance results of the fabrics.
As shown in Figure 14, the thermal resistance values increased with decreasing fabric setting, and this effect was statistically significant (F = 57.78 and p = 0). It was assumed that the thermal insulation increased due to more air inclusions in the loose fabrics. The relationship between thermal resistance and the amount of stagnant air that keeps the fabric in the structure is also highlighted by researchers in the literature [35–38]. When the thermal resistance values of the fabrics were examined in relation to the weave, it was found that particularly tight and medium setting plain fabrics gave the lowest values, and this effect was found statistically significant (F = 22.53 and p = 0).
Water vapor properties
Under normal conditions, i.e. at average ambient temperature and humidity and low physical activity, the human body continuously produces water vapor through the skin pores [39]. The difference in pressure between the outer surface and the sweating skin surface causes the water vapor molecules to pass through the clothing and move towards the outer environment at low pressure. When sweating through the vapor without liquid sweat, the person feels comfortable. Therefore, the water vapor permeability is a very important parameter in determining the wear comfort of the garment. The Permetest device measures the heat loss caused by the measuring head due to the evaporation of water in the bare state and covered by the fabric. The relative water vapor permeability is then calculated from the ratio of the latter to the former. The results of the relative water vapor permeability are shown in Figure 20.
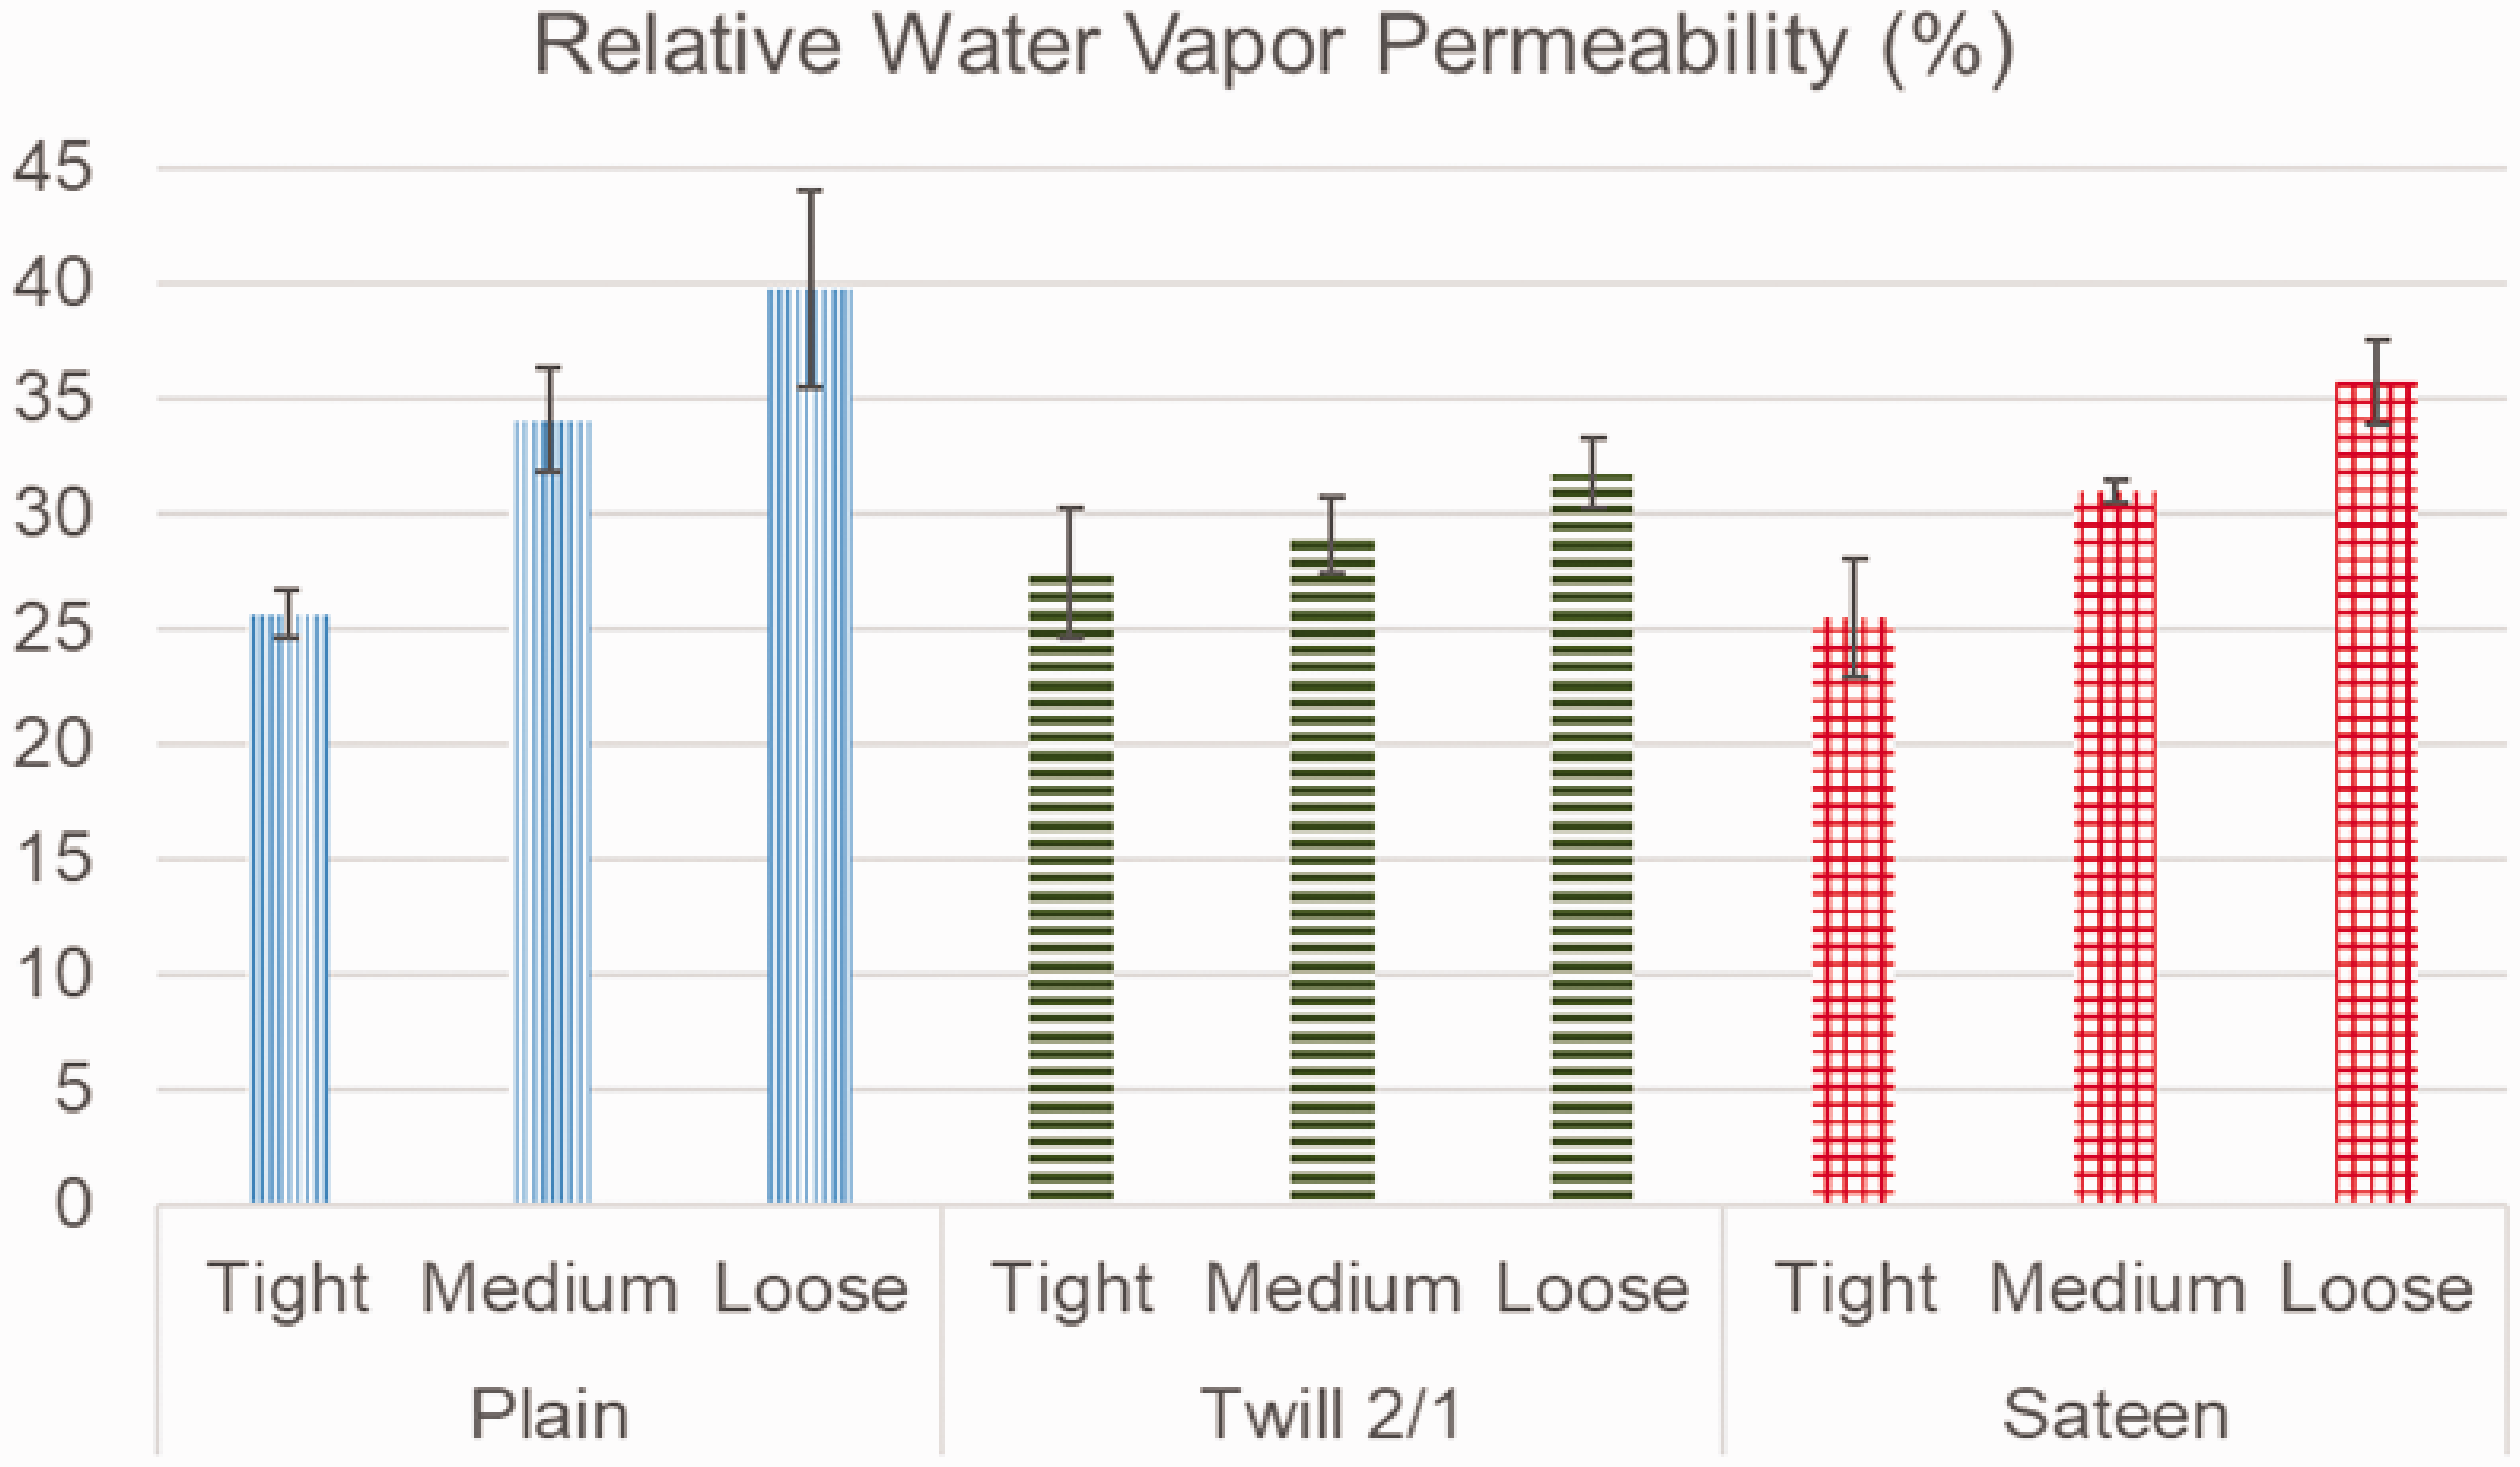
Water vapor permeability results of the fabrics.
The test results showed that plain structure with a loose structure had the maximum water vapor permeability followed by sateen and twill structures among three weave types. This effect was also statistically significant (F = 10.2 and p = 0). Nayak et al. similarly found that the water vapor permeability was higher for plain fabrics than for twill fabrics [40]. With regard to the setting effect, the results for water vapor permeability were somewhat similar to those for air permeability, although the effect was more pronounced in the former. With increasing setting of the fabric structure, the water vapor permeability decreased, and this effect was also statistically significant (F = 64.71 and p = 0). As the test results show, the water vapor permeability values of woven fabrics produced from conductive hybrid yarn varied between 25% and 40%. As Bączek and Hes stated in their work, these values ranged from low to moderate [41]. It was understood that the water vapor permeability of the fabrics containing conductive hybrid yarn was not very good.
Relationship between measured parameters
To investigate the relationship between measured parameters, Pearson correlation coefficients were calculated and are given in Table 2.
Pearson correlation coefficient values between measured parameters.
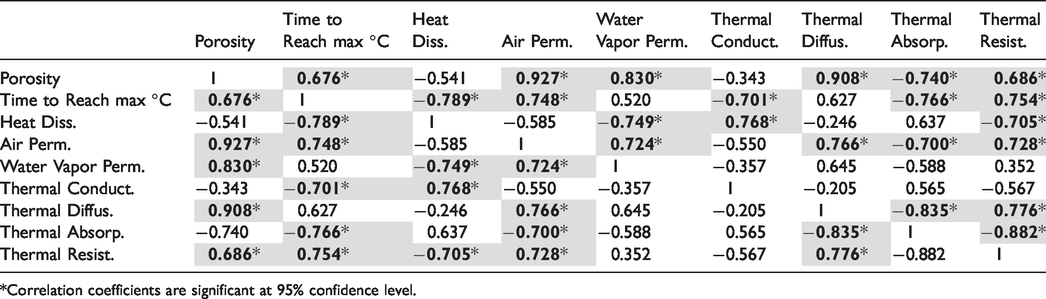
*Correlation coefficients are significant at 95% confidence level.
Based on the correlations between the parameters investigated in the study, it was found that the porosity has a significant relationship with many parameters. Seen from this point of view, it was once again shown that fabric porosity is one of the most important parameters in determining the thermophysiological comfort properties. Therefore, the porosity measurement, which was performed in this study by microscopic image processing analysis, should be one of the first measurements performed in thermophysiological comfort studies. On the other hand, it is noteworthy that the time to reach the maximum °C and the heat dissipation parameters performed in this study by means of thermal camera video analysis show significant relationships especially with thermal conductivity. At this point, it was shown that the experimental system prepared with the thermal camera was particularly useful for the determination of heat transfer by contact.
Conclusion
The yarn and fabric properties determined for this study are currently being used by the company to manufacture traditional upholstery fabrics. With this study, modifications were made to the traditional production system and a cost-effective electro-textile structure was achieved using hybrid yarns with copper wire. Upholstery woven fabrics are widely used in the furniture and automotive industries due to their properties such as high abrasion resistance, high light fastness, high seam shear strength, high dry and wet rub fastness, easy care. By providing these upholstery fabrics with electrically conductive properties, they can be used in functional applications in the furniture and automotive industry.
Thermophysiological comfort properties of upholstery fabrics containing conductive wire, with different settings and weave types developed with these objectives were investigated. In addition, the properties of electro-textile fabrics were evaluated using various methods such as thermal and microscopic cameras. In view of the findings obtained, it was concluded that fabric density was the main factor in determining pore size and pore distribution in the fabric. Furthermore, porosity was the key parameter that determined many thermophysiological comfort parameters of the fabrics. The use of copper wire, which is more rigid than yarns, made the pores in the fabric structures more visible, and this condition resulted in a more permeable structure. When evaluating the results in terms of knitting type, it was observed that different weave types created different images on the fabric surface, and different intersections of the yarns determined the geometric shapes and dimensions of the pores. Accordingly, it was shown that fabrics in plain weave, which is the most compact structure among the woven fabrics, had lower air permeability, higher thermal conductivity and thermal absorptivity; fabrics in twill weave, which have the diagonal design, had higher heat dissipation capacity and lower water vapor permeability; fabrics in sateen weave, which have longer jumps and greater coverage compared to other weaves, had lower thermal conductivity and lower thermal diffusivity than others. On the other hand, it was found that the experimental system prepared with the thermal camera for this study was particularly useful in determining heat transfer by contact.
Thanks to this study, the basic thermophysiological comfort properties of electro-textile fabrics containing conductive wires are examined and reference research for scientific studies and technological applications in this field is presented. Electronic applications will be applied to electro-textile structures produced by the studies to be carried out in the coming period, and the test methods established within the framework of this study will be used for electronic purposes. In future studies different electronic applications of these electro-textile structures will be investigated and the fabric parameters will be selected according to the results of the reference study.
Footnotes
Declaration of conflicting interests
The author(s) declared no potential conflicts of interest with respect to the research, authorship, and/or publication of this article.
Funding
The author(s) disclosed receipt of the following financial support for the research, authorship, and/or publication of this article: This work was supported by Usak University as a scientific research project [Project number: 2019/DTS001].
Acknowledgements
This work was supported by Usak University as a scientific research project [Project Number:2019/DTS001]. Besides, the authors would like to thank to the company Polat İplik Tekstil San. ve Tic. Ltd. Şti. for producing of the fabrics used in the study.