
Abstract
In this study, composite thermoplastic polyurethane (TPU)/polystyrene (PS) nanofiber web and TPU nanofiber web and PS-extracted TPU/PS microfiber web have been experimentally investigated with regard to sound absorption and thermal conductivity coefficients to observe a potential use in sound and thermal insulation areas. Moreover, other properties such as surface area, morphology, tensile strength/elongation, air permeability, and thermal degradation have been analyzed. It has been observed that nanofiber web properties such as fiber diameter, extensibility, pore volume, and porosity have been clearly changed by Soxhlet extraction of PS from the composite TPU/PS nanofibers. PS-extracted TPU/PS fibers can be preferred for the low frequency (600–800 Hz) due to higher SAC (0.7). On the other hand, TPU nanofibers were more effective at medium frequencies (around 3000 Hz, SAC 0.6). Both TPU and PS-extracted TPU/PS composite fibers had similar thermal conductivities, whereas TPU/PS composite nanofibers had lowest thermal conductivity (0.05 W/mK) with moderate maximum SAC value (around 1000 Hz, SAC 0.5–0.6).
Keywords
Introduction
Since ancient period, excessive noise has been a significant problem. Some of the health problems encountered due to excessive noise can be listed as sleep discomfort to cardiovascular problems, physiological issues, social problems, etc[1].
Hearing impairment is a remarkable health problem caused by either noise or various physical issues. Not only the frequency range of the sound but also sound level and exposure time determine the possibility of noise-based hearing impairment. 1 More than 430 million people is dealing with hearing impairment currently. 2
To reduce noise, porous materials can be used, since acoustic energy is absorbed by friction and small diameter pores which are distributed through the structure allowing air movement inside the pores. In terms of porous materials for sound absorption, fibers, foams, and porous composites can be used. When fibers with large diameters are used, high efficiency sound absorption at lower frequencies is a challenge, thus nanofibers with smaller fiber diameters are on target with smaller fiber diameters. With finer fibers, even at lower frequencies, high sound absorption can be obtained.3–5
Apart from the noise pollution, another challenge in today’s world is energy saving. Thermal insulation is one of the methods for diminishing energy consumption by decreasing heat transfer. Fiber-based materials with porous structure have been used as thermal insulators. Porosity, fiber shape, cross section, fiber diameter, and thickness are some of the factors that change the heat transfer, thus thermal insulation. As a result, thermal insulation is important for both energy saving and thermal comfort.6–8
In the literature, there are studies related with either sound absorption or heat insulation. Sound absorption of nanofibers and nanofiber-based composites has been investigated in the literature in the last decade. Materials such as polyacrylonitrile (PAN),9,10 polyvinylidene fluoride, 11 cellulose, 12 and PU, 13 were used either alone as nanofibers or as a part of composite for sound absorption properties. Mohamed et al. 14 produced composite open cell polyvinylidene fluoride (PVDF)/potassium sodium niobate (KNN) nanofiber foams consisting PVDF matrix and KNN nanofiber fillers and analyzed their sound absorption coefficients. Increased KNN nanofiber content from 0 wt% to 3 wt% and 5wt % in the composite enhanced the sound absorption coefficients (SAC) from 500 to 6400 Hz frequency. The calculated noise reduction coefficients (NRC) were found as 0.25, 0.3, and 0.37 for 0 wt% to 3 wt% and 5wt %, respectively. It was seen that by enhancing KNN nanofiber concentration, more sound is absorbed by the PVDF/KNN composite nanofiber foams. Özkal and Çallıoğlu 15 investigated the sound absorption performance of polyurethane (PU) nanofibers and their composites with polyethylene terephthalate (PET) needlepunched nonwoven fabrics. Electrospinning durations of PU nanofibers were varied between 5–120 min (thus increasing the nanofiber web thickness) onto PET nonwovens with basis weights of 250, 500, and 750 g/m2 and their effect on various properties were analyzed. The thickness of nanofibers were measured between 0.016 – 0.212 mm, and they concluded that SAC at lower frequencies can be increased by increasing nanofiber web thickness of PU nanofiber/nonwoven composites. The best NRC was observed in PU nanofiber/PET needlepunched nonwoven composite or needlepunched textile waste fabric in which the electrospinning was performed for 60 min. In another study by Özkal et al., 16 the effect of PU polymer concentrations (13–15 wt%) on PU nanofiber/PET nonwoven composite properties was investigated, and they concluded that finer fibers, thus lower polymer concentrations, enhance the noise reduction coefficients. The highest SAC was measured almost 1 for sandwich structured nonwoven/nanofiber/nonwoven composite samples at 2000–3000 Hz. Bahrambeygi et al. 17 examined the effect of nanofibers (electrospun PAN and PU nanofibers), nanoclay, and MWNT’s incorporation on sound absorption performance of PU foam. PAN and PU nanofibers were produced and incorporation of the nanofibers within PU foam resulted in increased sound absorption. They have modeled the effect of number of nanofiber layers on SAC and concluded that in case of use of PAN nanofibers, increasing number of layers resulted in increased sound absorption, Rabbi et al. 18 manufactured PAN and PU nanofibers and examined their effect on sound absorption properties (between 100–6300 Hz) of nonwoven fabrics. Nanofibers, varied in basis weights in between 1–5 g/m2, were positioned in between nonwoven layers (4–6). Increased sound absorption compared to neat sample was observed when PAN and PU nanofibers were incorporated. Higher amount of increase in SAC was obtained especially at low frequencies. On the other hand, PAN nanofibers were found to be better in terms of sound absorption compared to PU which might be because of the difference in elasticity of PAN and PU, or difference in nanofiber diameter, (average fiber diameter of 121 and 203 nm, respectively). Comparison of SACs of nanofiber webs and microfiber fabrics was made by Na et al. 19 In mid-frequencies (1000–4000 Hz), multi-layered nanofibers showed greater SAC. The highest SAC was observed in 11 layers of nanofibers at 4000 Hz as 0.57.
Thermal conductivities and thermal properties of nanofibers have also been investigated in the literature. Gibson et al. 20 worked on thermal conductivities of various insulation materials along with electrospun PAN nanofibers and mentioned that for fibrous materials used in insulation, thermal resistance can be increased by reducing the fiber diameter. Sabetzadeh et al. 21 produced PAN nanofibers with average nanofiber diameters of 102 nm, 297 nm, and 504 nm by changing PAN polymer concentrations of electrospinning solution and placed the nanofibers in between polyethylene (PE)- nonwoven layers and obtained sandwich composites. With the use of nanofibers, reduction in thermal conductivity was observed. When finer nanofibers were used (102 nm), the thermal conductivity was also found to be lower than composites with coarser nanofibers (for bulk density of 176 kg/m3, and thermal conductivity was around 0.02 W/mK, whereas when average nanofiber diameter was increased to 504 nm, thermal conductivity rises to approximately 0.03 W/mK). PAN-based carbon nanofibers were produced by Wang and Wang 22 , and their thermal properties were examined. Variation in thermal conductivity with change in fiber diameter was observed. The thermal conductivity testing temperature also affected the thermal conductivities of carbon nanofibers.
The objective of this study is to combine both sound absorption and thermal insulation performance of nano/micro fibrous webs by using TPU nanofibers along with PS and obtaining TPU/PS composite nano/micro fiber webs. Another aim of this study is to investigate the effect of Soxhlet extraction process on sound absorption and thermal conductivity properties of TPU/PS microfiber web. By Soxhlet extraction process, in which PS was extracted from the composite nanofiber structure, density, pore structure, and composite nanofiber morphology were varied. Obtaining higher SAC at lower frequencies and decrease of thermal conductivity were another target of the study. To our knowledge, there are no studies on TPU/PS composite fiber web properties before and after Soxhlet extraction which affects the properties of fiber web and none are related to the effect of these nanofibers on both sound and heat insulation at the same time. In addition to these original points, a comprehensive study has been performed by including the effect of air-back cavity distance on sound absorption properties and many structural analyses such as tensile properties, air permeability, FTIR, TGA, SEM, BET, porosity along with sound absorption properties, and thermal conductivities. Some original results such as extraction of PS from TPU/PS composite nanofiber to enhance sound insulation at the low frequency applications of TPU nanofibers and TPU/PS composite fibers were pointed out. On the other hand, composite TPU/PS nanofiber web presents best thermal insulation among others (0.05 W/mK). It has been seen that extraction of PS from composite TPU/PS web leads to an increase in fiber diameter and extensibility of webs.
Materials
Thermoplastic polyurethane (TPU, Ravathane R130A85, Ravago) with a density of 1.19 g/cm3 was used along with polystyrene (PS, Sabic) with a density of 1.05 g/cm³. N,N-dimethylformamide (DMF) anhydrous, 99.8%, tetrahydrofuran (THF), and cyclohexane were obtained from Merck.
Methods
Nano/micro fiber formation by electrospinning
The electrospinning solution for 100% TPU nanofiber webs was prepared with 10 wt% TPU in 1:5 THF/DMF solvent mix by continuously stirring for 5 h at 30°C.
For composite TPU/PS nanofiber web production, the electrospinning solution was prepared with 10 wt% TPU/PS solution which was dissolved in THF/DMF. The TPU:PS ratio was selected as 3:1 and was prepared by continuously stirring for 5 h at 30°C
Both TPU and TPU/PS nanofibers were electrospun with an electrospinning voltage of 10 kV, 15 cm electrospinning tip-to-collector distance, and 2 mL/h feed rate. The needle used in the electrospinning process was a 19-gauge metal hub needle.
To vary the density, pore structure, and the morphology of TPU/PS composite nanofiber, Soxhlet extraction was performed to the TPU/PS composite nanofibers to extract PS from TPU/PS composite nanofiber. Soxhlet extraction was performed with cyclohexane in which PS can be dissolved and TPU cannot be dissolved. The TPU/PS composite fibers were dissolved with cyclohexane at 80°C by using mantle heater. The dissolving process was continued for 5 days, and the extracted membrane was dried in a vacuum oven at 40oC for a day. The abbreviations used for 100% TPU nanofiber webs, TPU/PS composite nanofiber webs before Soxhlet extraction, and TPU/PS composite microfiber webs after Soxhlet extraction are TPU, TPU/PS-BSE, and TPU/PS-ASE, respectively.
Analysis
The morphological analysis of fibers was observed with SEM microscopy with Tescan Vega-3 scanning electron microscopy after Au+ coating at TEMAG Laboratory, ITU. For cross-sectional analysis, FIB SEM imaging was conducted with Tescan, GAIA 3 FIB SEM system at HUNITEK laboratories, Hacettepe University. Fiber diameters were measured by using Image J software with 30 measurements. Average fiber diameters were calculated after measurements. The thickness measurements were conducted according to BS 2544 standard. Ten replicates were tested with a pressure of 5 g/cm2 and average value has been calculated. Micromeritics AccuPyc II 1340 gas pycnometer was used to determine density of fiber webs. The air permeabilities of the samples were measured with Prowhite Air Test 2 setup according to EN ISO 9237 standard. Three replicates for each sample were tested with a test area of 20 cm2 against 100 Pa pressure. BET and pore analysis were performed with Micromeritics—Tristar II 3020 at 50oC of degassing for 24 h.
Pore volume measured by BET analysis, apparent density, calculated (estimated) porosity (%), and density measured by pycnometer are different concepts and while some of them are related to each other, some of them are not related.


Properties of nanofiber and microfiber webs.

FTIR analysis was performed with Nicolet™ FT-IR IS™10 spectrometer between 400 and 4000 cm −1 wavelengths. The TGA analysis of micro/nanofiber webs was performed at a nitrogen atmosphere between 25 and 1000°C with an increment of 10°C/min by using TA INSTRUMENTS - Q600 SDT setup. The tensile test device has been used for measurement of tensile properties of the micro/nanofiber webs with a pressure head of 100N, 20 mm/min gauge speed, and gauge distance of 15 mm. Sample dimensions were 5 mm × 35 mm. The thermal conductivity measurements were performed at DUBIT Laboratories, Düzce University by using C-Them TCI setup. Five measurements were conducted and an average of 5 values was calculated. The sound absorption coefficients (SACs) were measured with TestSens Sound Tube (BIAS) tester by using tubes with 29 mm and 100 mm radius and round samples. Five layers of micro/nanofiber webs were tested to analyze SAC. The gaps between the sample and the experimental setup, which can also be referred as air-back cavity distance, were varied as no gap, 1 cm gap, 2 cm gap, and 3 cm gap to determine the effect of air gap in back of the test sample.
Results and Discussion
FTIR Analysis
The characteristic peaks of TPU nanofiber can be seen from the FTIR curves (Figure 1) such as N-H stretching band (3332 cm−1), the absorption peaks (−H−N−COO− groups at 1595 cm−1 and 1730 cm−1) wavelength, and the alkene stretching vibrations (–CH - 2956 cm−1).
27
The composite fiber before and after extraction showed peaks comparable with TPU due to high TPU content in the structure. FTIR curves of PS granule, TPU nanofiber web, and TPU/PS composite nano/microfiber webs before and after Soxhlet extraction.
In PS granule, the characteristic peaks of PS can be observed such as out of plane bending vibration peaks (C-H–at 698.2 and 756 cm−1) and stretching vibration aromatic peaks (C=C at 1600.8, 1492.7, and 1452.2 cm_1 wavelengths). 28 When used in composite form, the peaks reduced as can be seen in TPU/PS-BSE curve. Additionally, after Soxhlet extraction, the peaks corresponding to PS were totally removed because of the reduced PS content in the structure.
Morphological analysis and structural properties of nanofibers
The SEM images and FIB cross-sectional images of micro/nanofibers can be seen in Figure 2, and data related to properties of fiber webs are shown in Table 1.
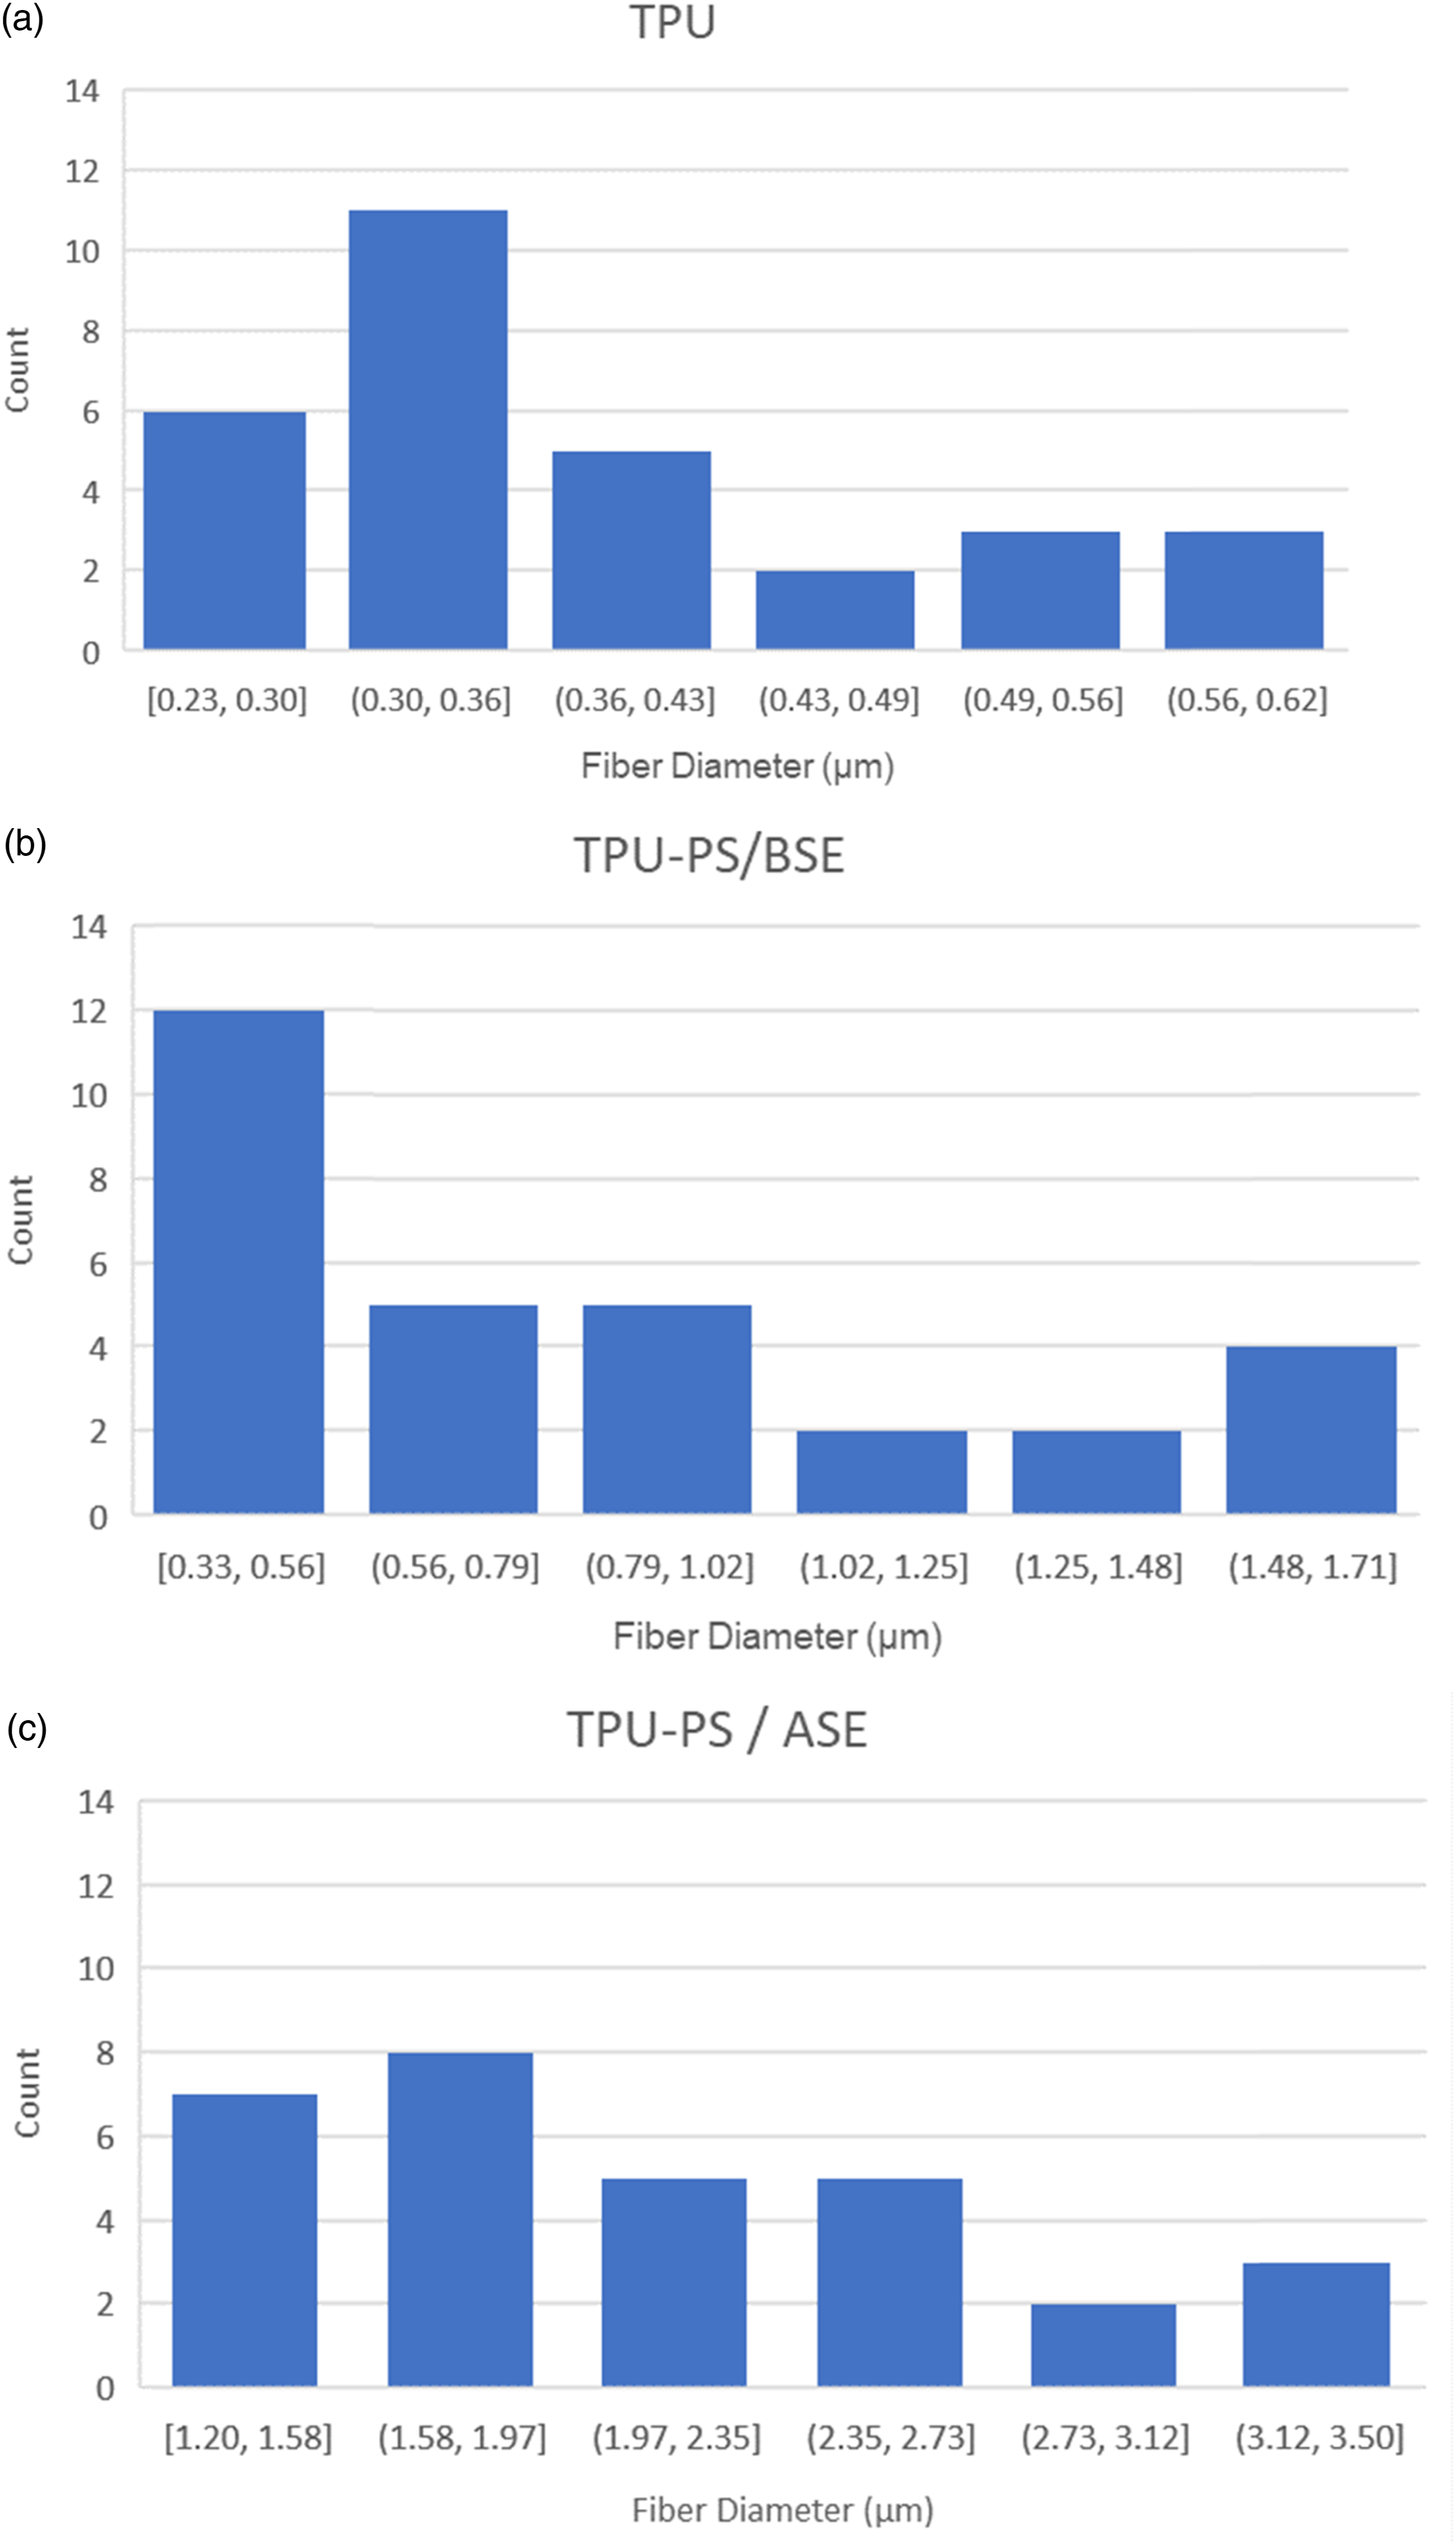
Average nanofiber diameters were 0.378 (±0.1) μm for TPU nanofiber, 0.820 (±0.4) μm for TPU/PS nanofiber before Soxhlet extraction, and 2.097(±0.6) μm for microfibers after Soxhlet extraction. There is an increase in nanofiber diameter of TPU/PS nanofibers compared to 100% TPU nanofiber because of the addition of PS polymer. However, there is a significant increase in average fiber diameter after Soxhlet extraction. Even though a major portion of PS was removed after extraction (as can be seen from Figure 1 and Table 1), coarser fibers/microfibers (2097 nm) were obtained compared to 100% TPU nanofibers (378 nm) and compared to TPU/PS nanofibers before Soxhlet extraction (820 nm). Increased average fiber diameter might be caused by the shrinkage and thickening of fibers due to the relaxation of elastic TPU resulted from removal of strain during Soxhlet extraction under hot and wet environment. The pores discharged with the removal of PS might be filled with TPU due to relaxation shrinkage, rather than forming an evident porous structure. However, there should be some minor pores (substance reduction) after PS removal because of Soxhlet extraction, and this effect can also be observed from the decrease of density obtained from pycnometer (Table 1).
From the SEM images and FIB cross-sectional images, shown in Figure 2, incorporation of PS resulted as bead formation on nanofibers (Figure 2(c)). The fiber diameter distributions of the fibers are shown in Figure 3. The specific surface areas and pore volumes, fiber diameters, and densities of the fibers are shown in Table 1. The lowest pore volume and specific surface area are observed in TPU nanofiber. Incorporation of PS resulted as an increase in surface area and pore volume that may be resulted from the presence of beads coming from very thin region on nanofiber web. After Soxhlet extraction, both pore volume and specific surface area were reduced but were still higher than the TPU nanofibers. This is because of relaxation shrinkage and thickening after Soxhlet extraction. SEM images of nanofibers and FIB cross-sectional images of nanofibers and microfibers. (a) TPU; (b) TPU cross-sectional image; (c) TPU/PS-BSE; (d) TPU/PS-BSE cross-sectional image; (e) TPU/PS-ASE; (f)TPU/PS-ASE cross-sectional image. Fiber diameter distributions of nanofibers. (a) TPU; (b) TPU/PS-BSE; (c) TPU/PS-ASE.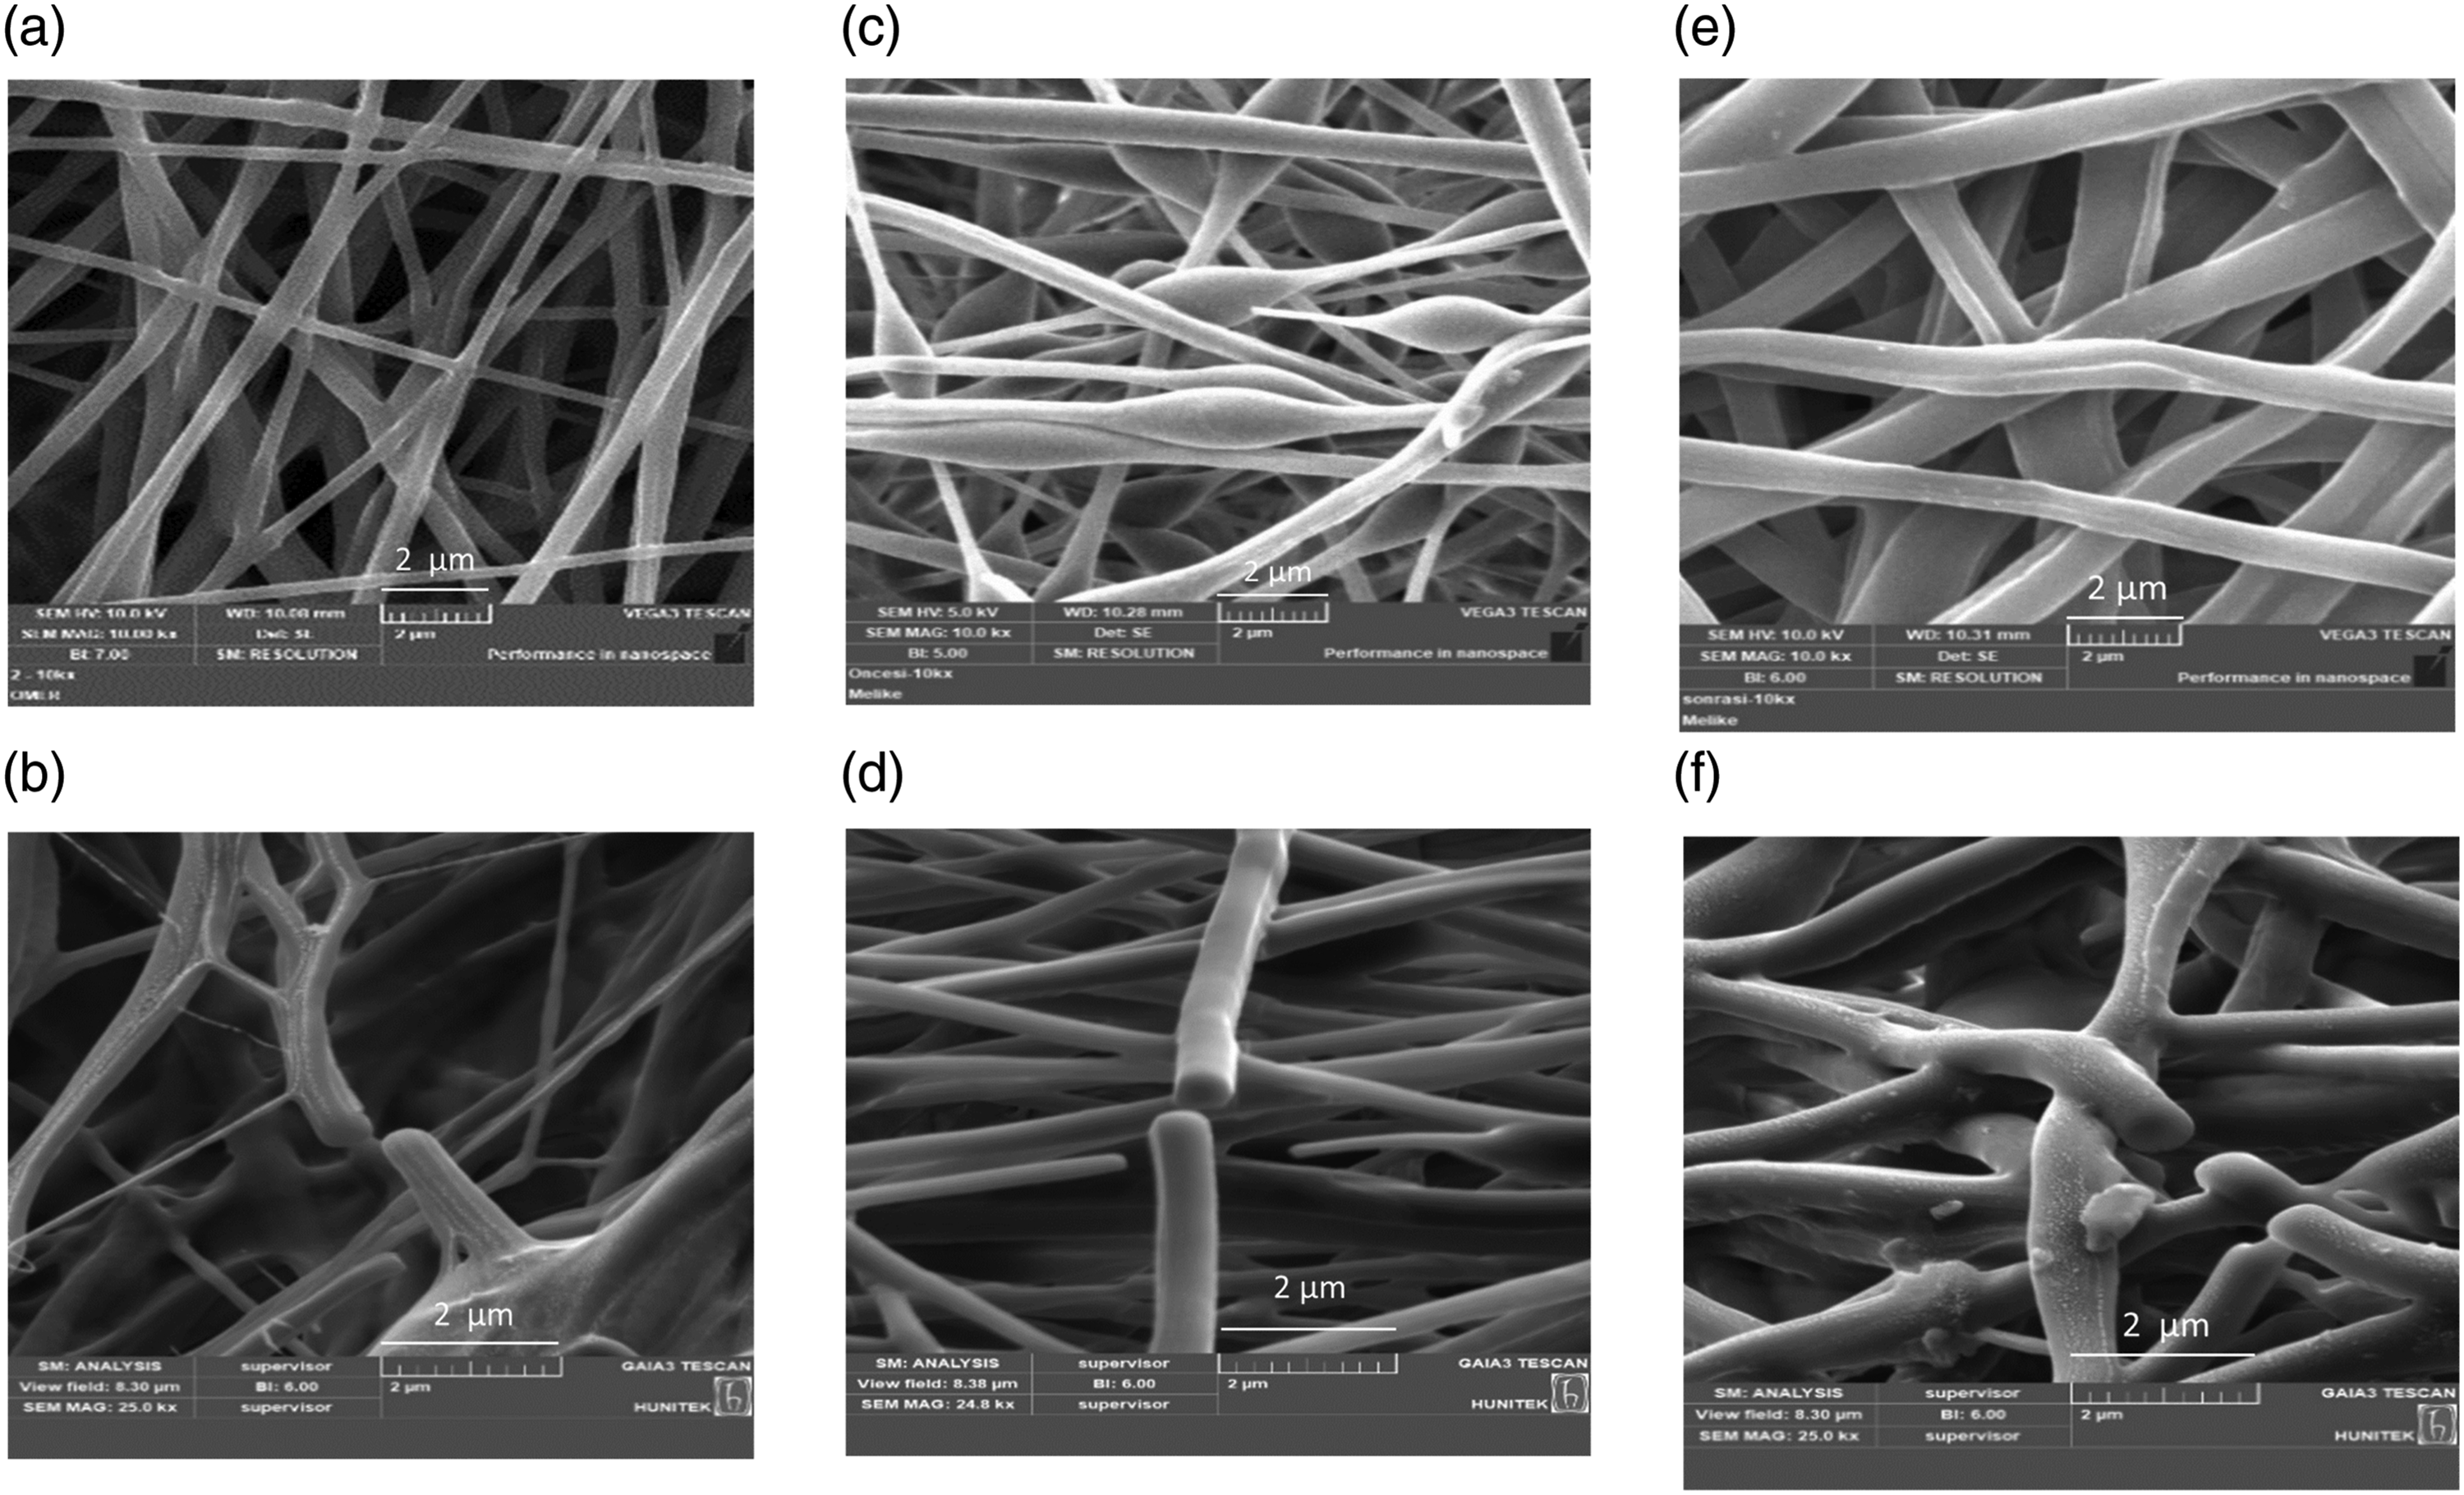
As pointed out above, TPU/PS nanofiber before Soxhlet extraction has distinct beads as seen in SEM appearance (Figure 2(c)) which led to many thin and thick places. These beads result with many voids (pores) on nanofiber membrane plane compared to other membranes which lead to highest % porosity (the highest void, pores on nanofiber membrane plane) and highest air permeability. However, % porosity and thus air permeability decreased after Soxhlet extraction (TPU/PS-ASE) compared to nanofiber before Soxhlet extraction (TPU/PS- BSE), due to shrinkage and thickening and compactness caused by relaxation of the nanofiber after the removal of PS during Soxhlet extraction under hot and wet environment. Similar effect can be seen in BET analyses results, that is, surface area and pore volumes decreased, since pore closes due to shrinkage and thickening of nanofiber after Soxhlet extraction. The least air permeability has been seen on 100% TPU web which has the least % porosity (the least void, pores on nanofiber membrane plane) on nanofiber web.
As seen from the information given in methods section, the density measured by pycnometer is the density of solid materials in nanofiber mat (web), that is, the density of fiber. Thus, there may be a relation between pore volume measured by BET and density measured by pycnometer if there is no any other disruptive effect on this relation, as in the case in this study.
As seen from Table 1, the pore volume and surface area increase by the presence of PS (TPU/PS) when it is compared with 100% TPU. Thus, density measured by pycnometer for TPU/PS is slightly less than that of 100% TPU, as PS polymer has less bulk density than that of TPU. But, this relationship is destructed when TPU/PS nanofiber web is treated with Soxhlet extraction. Since PS is dissolved and extracted from TPU/PS nanofiber, the density of TPU/PS web after Soxhlet extraction measured by pycnometer decreases as expected. However, pore volume and surface area after Soxhlet extraction for TPU/PS compared to that of before Soxhlet extraction decreases, while the opposite was expected. The reason for this is the shrinkage and thickening of fibers due to relaxation of nanofiber under hot and wet extraction environment of highly elastic TPU/PS nanofiber. Shrinkage and thickening diminish (close) the pores, causing decrease of pore volume and surface area. The pores discharged with removal of PS after Soxhlet application might be filled with TPU due to relaxation shrinkage/thickening, rather than forming an evident porous structure. However, there should be some minor pores (substance reduction) after PS removal due to Soxhlet extraction, this effect can also be observed from the decrease on density obtained from pycnometer, compared to nanofiber before Soxhlet extraction (TPU/PS- BSE); however, bulk density (apparent density) is increased because of shrinkage and thickening after Soxhlet extraction leading to decrease of porosity (%).
Air permeabilities and porosities of nano/micro fiber webs.

Even though there is an absence of PS form membrane after Soxhlet extraction, since fiber is forced to shrinkage and thickening due to relaxation under wet and hot environment during extraction process, porosity (%) calculated by equation (3) and pore volume and surface area measured by BET analysis have decreased, extensibility exceptionally increased for TPU/PS after Soxhlet extraction due to similar effect of accordion/spring effect because of the removal of PS.
In Figure 4, stress–strain curves of representative nano/micro fiber webs are shown. According to t test with two tailed and 0.05 significance level, the differences between strains and also stress for all sample types are statistically important except for the differences between the strain and stress values of TPU and strain, stress value of TPU/PS-BSE, which are not statistically significant. Adding PS into structure (TPU/PS-BSE) results in some increase in breaking elongation compared to 100% TPU which is not statistically significant. However, extraordinary elongation more than %600 breaking elongation was observed in TPU/PS-ASE nanofibers, which was only about 1/4th before Soxhlet extraction (TPU/PS-BSE). Both stress and strain values exceptionally increased for TPU/PS after Soxhlet extraction, which may be resulting from the similar effect of accordion/spring effect due to removal of PS. Stress/strain curves of representative fibers (curve a: TPU, curve b: TPU/PS-BSE, and curve c: TPU/PS-ASE).
Thermal conductivity coefficient and thermal degradation behavior
Thermal properties of nanofibers.
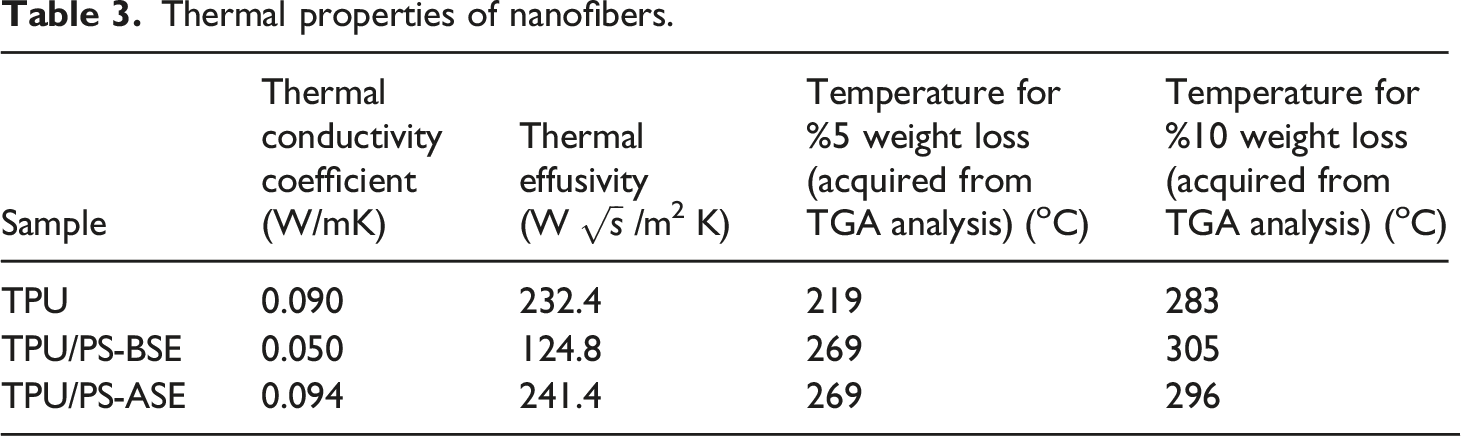
On the other hand, 100% TPU reference nanofiber web and microfiber web after Soxhlet extraction (containing approximately 98% TPU and 2% PS) have similar thermal conductivity coefficients (0.09 and 0.094 W/mK with 10−3 standard deviation, respectively). According to two tailed t-test at 0.05 significance level, the differences between thermal conductivity coefficient of TPU and TPU/PS-ASE are not significant. Since the diameter of TPU/PS-ASE’s fiber is quite higher than that of TPU, thermal conductivity was expected to be significantly higher than that of TPU due to higher thermal conductivity with larger fiber diameter observed in literature.21,22,33 However, even though an increase of thermal conductivity is observed, it is not statistically significant. The density, pore volume, and surface area might be effective on this result, that is, lower density, higher pore volume, and higher surface area of TPU/PS-ASE compared to TPU results to decrease of thermal conductivity. Thus, two opposite effects might balance each other resulting in not significant change on thermal conductivity after Soxhlet extraction, compared to TPU nanofiber web. A similar trend and relationship were observed in thermal effusivities of nanofibers. The thermal effusivity of TPU nanofibers reduced with PS addition. On the other hand, as in the case of thermal conductivity coefficient, Soxhlet extraction process enhanced the thermal effusivity compared to TPU nanofiber and compared to composite nanofibers before Soxhlet extraction (TPU/PS-BSE).
The TGA curves and results are shown in Figure 5 and Table 3, respectively. It is obvious that 100% TPU nanofiber web begins thermal degradation at an early phase compared to TPU/PS composite fiber webs (both before and after Soxhlet extraction samples). PS incorporation increased the thermal degradation temperatures, and while 10% weight loss was observed at 305oC for composite fibers before extraction, 296oC for composite fibers after extraction, and 283oC for 100%TPU. TGA curves of the nanofiber samples.
Sound absorption coefficients of nano/micro fiber webs
Nanofibers are known to enhance the sound absorption performance which might be related to their increased surface area, reduced fiber diameter, etc.17,34–36 They are known to increase sound absorption coefficient (SAC) at low frequency ranges, additionally improve SAC at high-frequencies.35,37-38 Use of multiple nanofiber layers is also a known factor to enhance the sound absorption properties.
38
Thus, 5 layers of fibers were used and tested with air-back cavities of 0–3 cm (no gap, 1 cm–2 cm, and 3 cm gaps). The effect of air-back cavity on SAC for fibers is shown in Figure 6. As shown in Figure 6, resonance sound absorption with peak shaped becomes more prominent by the presence of air-back cavity. When a gap is formed at the back (such as 1, 2, and 3 cm), enhanced sound absorption is generally observed compared to no gap sample. There is tendency that maximum SAC value is changed to lower frequency ranges as the air-back cavity increases due to vibrational damping effect.
26
This tendency is more observable for both TPU/PS-BSE and TPU/PS-ASE compared to TPU, this might be due to both TPU/PS-BSE and TPU/PS-ASE having higher elasticity than TPU and thus increase of elasticity might result in more vibrational damping leading to shifting maximum SAC to lower frequency as the air-back cavity increases (1000 Hz and lower frequency such as 600–800 Hz). Effect of gap on SAC for 5 layers nanofibers. (a) TPU; (b) TPU/PS-BSE; (c)TPU/PS-ASE.
The SACs with change in frequency for all fibers with 0–3 cm gap for air-back cavity are shown in Figure 7. As can be seen from Figure 7, while all samples have similar maximum SAC when there is no air-back cavity (0 cm), as the air-back cavity increases, there is a tendency to an increase of maximum SAC especially for very elastomeric TPU/PS-ASE, due to more effective vibrational damping. The effect of air-back cavity on SAC is lower in case of TPU nanofibers which have the lowest elasticity among all samples. The maximum SAC value and the resonant frequency are not affected by the air-back cavity significantly. On the other hand, when TPU/PS composite samples before and after Soxhlet extraction both of which have higher elasticity were investigated, the resonant frequency will reduce. When Figure 7(c) and (d) which shows higher air-back cavity results among others are examined, it has been seen that maximum SAC value of TPU/PS-BSE and TPU/PS -ASE compared to TPU shifted toward lower frequency, this might be due to higher elastic behavior of TPU/PS-BSE and TPU/PS-ASE leading to vibrational damping. When PS is added into the structure (TPU/PS-BSE), the value of maximum SAC has not changed too much until maximum air-back cavity, which is 3 cm. At the air-back cavity 3 cm, the maximum SAC (TPU/PS-BSE) decreased to 0.5 where, the maximum SAC of 100% TPU is 0.624. As known from literature, an increase in fiber diameter can result in decrease of SAC, while an increase porosity % of membrane and decrease of fiber density (an increase of pore volume) can result in increase of SAC.17,34–36 Both opposite effects are available for TPU/PS-BSE, and it has been seen that an increase in fiber diameter results in more dominant effect on maximum SAC value leading to decrease of maximum SAC compared to 100% TPU, when air-back cavity is highest (3 cm). As the elasticity of the material increases, vibrational damping increases (leading to higher maximum SAC). When the maximum SAC value of TPU/PS-ASE which has highest SAC value compared to other two structures (TPU and TPU/PS-BSE), it has been seen that its extraordinary elastic performance has more dominant effect on maximum SAC value than the other properties such as porosity, fiber diameter, and pore volume. This extraordinary elasticity might have overcome the disadvantage of coarser fibers, thus the highest SAC was observed. As can be seen from Figures 6(c) and 7(d), for 3 cm gap, the fibers after extraction had highest sound insulation performance especially for lower range frequencies (less than 1000 Hz, i.e., between 600–800 Hz) (SAC of 0.6–0.7). On the other hand, for frequencies between 2500–3500 Hz, TPU nanofibers have the highest sound absorption coefficient, around SAC 0.6. Thus, with air-back cavity (2 cm and 3 cm), for low frequency applications (600–800 Hz) and high frequency applications (5000–6500 Hz), TPU/PS-ASE microfiber web can be preferred, while for medium frequencies around 3000 Hz, TPU nanofiber web can be preferred. The SACs of nanofibers with 0, 1, 2, and 3 cm gap setups. (a) no gap; (b) 1 cm gap; (c) 2 cm gap; (d) 3 cm gap.
Conclusions
This study investigates sound absorption and thermal insulation properties of 100% TPU nanofiber web along with composite TPU/PS nanofiber webs and also PS-extracted TPU/PS microfiber webs. Following results have been concluded: PS incorporation reduced thermal conductivity (0.05 W/mK, almost half of 100% TPU) and decreased the thermal degradation; however, after Soxhlet extraction of PS from TPU/PS fiber webs, thermal conductivity rises to the thermal conductivity value of 100% TPU nanofibers (around 0.09 W/mK). A similar trend with thermal conductivity coefficient has been observed for thermal effusivity, in which least thermal effusivity belongs to TPU/PS-BSE, then TPU, and then TPU(PS-ASE). Even though they have larger fiber diameter, TPU/PS-ASE microfiber webs had higher SAC (maximum SAC around 0.7) at low frequency range (especially at the highest air-back cavity, 3 cm). As a result, TPU/PS-ASE microfiber webs can be selected for applications requiring lower frequency than 1000 Hz. For medium frequencies (around 3000 Hz), TPU nanofiber webs had higher maximum SAC (around 0.6) compared to others. TPU/PS-BSE nanofiber web may be more preferable for the applications which need less thermal conductivity (0.05 W/mK) with moderate sound absorption coefficient (maximum SAC of 0.5-0.6) around 1000 Hz All samples have similar maximum SAC value when there is no air-back cavity (0 cm); however, as the air-back cavity increases, air-back cavity enhanced SAC and caused a shift of frequency that maximum SAC observed which might be because of the vibrational damping caused by air-back cavity. The air-back cavity did not affect SAC of TPU which might be due to the lower elasticity of TPU. The effect of air-back cavity was more obvious in case of PS-extracted TPU/PS microfiber web that may be due to highest extensibility properties. Soxhlet extraction of PS from composite TPU/PS nanofibers resulted in significant structural changes, increase in average fiber diameter, extensibility and decrease of fiber density, and pore volume. Dominant ones among all these changes affect the final insulation performance of nanofiber web.
Footnotes
Declaration of conflicting interests
The author(s) declared no potential conflicts of interest with respect to the research, authorship, and/or publication of this article.
Funding
The authors disclosed receipt of the following financial support for the research, authorship, and/or publication of this article: This article was supported by TUBITAK; grant no218M766.