
Abstract
In the liquid composite moulding (LCM) process, fabric is draped over the mould surface and a resin is injected under pressure to develop a composite laminate. Wrinkling is one of the most common flaws that occurs during the draping of the fabric. Wrinkling of the fabric within the composite could severely reduce the quality of the finished composite laminate. Thus, to develop a high-quality composite laminate, exact prediction of fabric wrinkling behaviour is necessary. The aim of the paper is to investigate the draping behaviour of carbon fabric. Carbon fabric with an areal density of 245 g/m2 is used in the study. Both experimental and numerical investigations were performed. An experimental setup was developed to predict the draping behaviour of the carbon fabric used in the study. LS-DYNA/Explicit solver is used to achieve macro level draping simulation. Material model MAT_REINFORCED_THERMOPLASTIC [MAT_249] offers the possibility to simulate the forming behaviour of a thermoplastic material. To simulate dry fabrics using MAT_249, a very low properties are used for the matrix in the material model. To capture the forming behaviour of fabric, an intensive material characterization has been performed. Tensile and shear properties of the fabrics were determined using uniaxial and picture frame tests, respectively. Influence of the position of the integration points from the mid surface on bending behaviour is studied and calibrated using a simple test.
Introduction
During the initial draping stage in the liquid composite moulding process, the two-dimensional fibrous preforms must be draped over the three-dimensional complex curve-shaped mould. Fabric does not exhibit isotropic behaviour like metals, and it has relatively high tensile properties in comparison to in-plane shear and out-of-plane bending. The fabrics have low shear and bending resistance. Therefore, the warp and weft yarns tend to reorient during the draping process. Hence, bending and shear deformation modes mostly govern the draping behaviour of the fabric. The fabric deformation modes are described below. Figure 1(a) illustrates the tensile nature of the fabric, which is slightly different from that of unidirectional (UD) material initially. During the initial loading phase, the undulated yarns straighten themselves, and further loading causes a direct load on the yarns. Hence, for woven fabric, there is an initial straightening phase immediately followed by a direct tensile-loading phase similar to UD or non-crimp fabric (NCF) material, as seen in Figure 1(b).

(a) Fibre straightening in woven fabric under tensile load and (b) Tensile response of woven fabric vs UD or NCF fabric loaded in fibre direction [1].
The fabric shear deformation mode is shown in Figure 2. A shear load on the fabric causes a rotation of warp and weft around the point of intersection. In the initial state of shear, the deformation is governed by the friction between warp and weft [2]. Further loading causes the tows to compress each other (fibre jamming or compaction), and the shear force tends to increase faster. This compaction or jamming causes the fabric to demonstrate higher shear stiffness, and further loading leads to out-of-plane buckling or wrinkling. The deformation of fibres significantly affects strength and stiffness properties of the final part [3–5].

Different states of shear deformation within plain weave representative unit cell [6].
An accurate prediction of wrinkles and fibre orientation after forming is necessary as existence of these defects decreases the compressive strength of the part and reduce its life span. Thus, to develop a successful structural fibre reinforced polymer (FRP) component, it is necessary to understand the deformation behaviour of fibres and their accurate prediction of wrinkling onset. To summarize, the fabric shear behaviour is governed by the initial state of low shear stiffness before locking (Ginitial) and a state of high shear stiffness after locking (Glocking).
Two methods are used to simulate the draping behavior of woven fabrics, namely, kinematic draping and the solid mechanical-forming approach. In the first approach, the drape behaviour of the fabric is approximated to a simplified mechanism in which the fabric experiences pure shear, with the integral tows rotating freely at crossover points. This behaviour can be modelled simply by mapping these crossover points onto the curved mould shape [7]. This approach is simple and fast, but the drape solution is more dependent on the mould geometry, and the solutions are not accurate for geometries which do not have uniformly curved surfaces. Kinematic draping also does not consider the material behaviour and hence results in the same draping pattern regardless of fabric/fibre architecture [8–10]. The solid mechanics approach can be applied at the micro roving level, the meso yarn level, and the macroscopic part level. The micro and mesoscopic approach is computationally too expensive to model [11], and draping studies thus focus on the macro level and represent both weft and the warp yarns as single layer. Along with fabric in-plane and out-of-plane stiffness properties, the model also considers forming parameters such as blank holder force, tool velocity, tool-ply, and ply-ply friction. To perform a macro-level draping simulation, the tensile, shear, and bending behaviour of the fabrics is required. The tensile behaviour of the reinforcement can be characterized using tension tests. The bending stiffness of the fabric can be measured using either a simple cantilever test or a Kawabata bending test [12]. The elastic in-plane shear response of the fabric can be characterized using mechanical techniques such as a picture frame and bias extension test [13,14]. Within these two techniques, the bias extension test does not require any special tooling and can be performed by applying a tensile load on fabric with a principal direction of ±45° in a uniaxial tensile test machine. However, a bias extension test exhibits an inhomogeneous state of shear within the fabric coupon. In addition, fabric coupons tend to slip and slide within the clamps in a bias extension test beyond a certain displacement. Picture frame shear tests, by contrast, induce shear uniformly [15–18] and thus offer certain advantages in comparison to a bias extension test.
In the study, tensile properties were identified using a uniaxial tension test on dry fabrics. Since no standards were available for identifying the shear behaviour of the fabrics, a new picture frame fixture was designed. As the shear forces recorded in the experiments are presumed to be very low, the joints in the picture frame was constructed using ball bearings to prevent self-induced friction during testing. Bending deformation of the fabric is measured using a simple experimental set-up. An omega shaped experimental draping setup is designed and constructed to study the draping behaviour of the investigated carbon fabric. LS-DYNA solver is used to achieve a macro level draping simulation. The material model MAT_REINFORCED_THERMOPLASTIC [MAT_249], which offers the possibility of simulating the forming behaviour of a thermoplastic material will be used in the study. The aim of this study is to check the effectiveness of material model to predict draping in three dimensional parts.
Material characterization of the fabric
245 g/m2 carbon fabric from DowAksa is utilized in the study. The tested fabric properties are shown in Table 1.
Physical properties of the investigated carbon fabric.

Tensile test
The tensile testing of carbon fabrics was utilized according to the ASTM D 5035 standard using Instron Electro Puls E10000, a linear-torsion all-electric dynamic test machine, which has a load cell capable of measuring a 7 kN static load. Tensile load was applied at a constant speed of 0.5 mm/min, and the dimensions of the specimens were set to 135 mm × 20 mm (Figure 3(a)). The thickness of the fabric was 0.3125 mm. Since the investigated carbon fibre is woven, the same results were also used for weft direction. Four tests were performed on the warp direction (Figure 3(b)), and an average value was used to calibrate the numerical model. The width of the fibre was maintained as 8 yarns for each sample. To provide a better gripping to the clamping region, three different types of clamp tabs were tested:

(a) Dimension of the tensile test specimens, (b) Illustration of tensile test experiment, and (c) stress-strain response for the investigated experimental samples.
A layer of adhesive tape
No clamping tabs, meaning that the carbon fibres were directly clamped
Curing the clamping area using ethyl-2-cyanoacrylate adhesive
A large amount of slippage occurred with the utilization of adhesive tape. Due to slippage within the clamping tab, no fibre breakage occurred. Thus, adhesive tape clamping was not used further. When carbon fibres were directly clamped, there were failures at the edge of the clamping region, and the results were thus not used. When clamping regions were cured using a “super glue” (ethyl-2-cyanoacrylate adhesive), the clamping region became solid. During a tensile test of carbon fibre with this clamping technique, there was no slippage or failure at the edge of the clamp. Thus, ethyl-2-cyanoacrylate adhesive curing of clamping was utilized for tensile test of the fabric. Tensile results obtained with ethyl-2-cyanoacrylate adhesive curing of clamping region were repeatable (Figure 3(c)). Engineering strain is calculated using initial gauge length and the measured displacement from testing. Stresses are calculated by considering the fabric as a homogeneous continuum and hence by using a simple rectangular section of 25 mm × 0.3125 mm. Since tensile stresses are quite low during draping, tensile behaviour determined from experiments for a strain range from 0 to 0.020, is sufficiently large enough to capture the tensile nature of fabric when draped.
Shear test
Shear deformation behaviour of the fabric was characterized using a picture-frame test set-up. A picture-frame test of woven fabrics consists of a hinged frame with four bars of equal length assembled in a tensile testing machine. A tensile force is applied diagonally on the opposing corners of the picture frame, inducing shear on the woven fabric. The pulling force caused the frame to move from its initial square configuration to a rhomboid. As there are no existing international published standards for a picture-frame test measuring the shear angle of the fabric, a rhombus frame was designed and constructed with initial frame size (Lframe) of 250 mm. The samples has a side length of 180 mm.
The force measured without mounting the fabric to the frame corresponds to frictional force (F/) of the picture frame fixture. Force measured by mounting the fabric on to the frame corresponds to shear load (F//). Shear force (Fs) experienced by the fabric can be calculated from equation (1), where offset value F/ is the frictional force in the frame and F// is the machine-recorded value during the test with fabric. The frame must have low friction during the experiment. Plain-sleeve bearings were utilized to connect the four bars. To measure the friction, the picture frame was tested without the fabric in the Zwick Roell Z030 universal tensile testing machine, which has a 30 kN load cell. Three different crosshead speeds, of 50, 100, and 200 mm/min, were used until the frame reached 90 mm displacement. For each crosshead speed, tests were performed three times. Average frictional force without fabric (F/) was measured as 1.6 N, which was used in equation (1) to calculate shear force (Fs).
Equation (2) and (3) describe the kinematics of picture frame shear test.

Lframe is the side length of the frame, d is the displacement measured during the test and
Picture-frame test with carbon fabric was performed on the same machine at a constant speed of 50 mm/min. Three tests were performed to measure the shear load of the investigated carbon fabric. All recorded responses showed strong noise, as a 30 kN load cell was used at low force values. Raw machine data was smoothed using an averaging technique, and finally, a mean curve was used to further calibrate material model. Shear force vs shear angle curves were obtained using force-displacement responses. Warp and weft tows are orthogonal to each other at zero displacement. As a result, the shear angle is 0° at the beginning. Increment in displacement induces decrement in the opening angle of the shear frame, which causes shearing in the fabric. Thus, a rotation of the warp and weft tows occurs with shear angle increment. Shear force and shear angle increase linearly due to friction in the cross points of the fabric. With greater displacement, the warp and weft tows begin to pack tightly to a point at which the tows are not able to freely rotate, which results in a steep increase in the force and stiffness of the fabric. The point at which this phenomenon occurs is called the locking angle, and this is the characteristic parameter for the drapeability of a textile. Further increases in the displacement result in wrinkling, and the fabric begins to buckle out of the plane.
The locking angle was determined graphically by intersecting the tangent to the linear curve of the shear angle-force graph. Two tangent lines were created, one for the shear angles in the range of 5° to 10° and another for the last five degrees. Due to the inertia of the system, a shear angle below 5° was nonlinear. In addition to overcoming static friction, a tangent line was not considered for shear angles below 5°. Three tests were performed to measure the repeatability of the locking angle, and the average locking angle was measured as 32° (Figure 4).

Shear stress vs. shear angle response of the investigated carbon 245 g/m2 twill 2/2 fabric.
Bending test
Hamila et al. suggested that bending stiffness is very small for textile reinforcement due to its fibrous nature [8]. To study bending deformation, a simple experimental set-up is used, as shown in Figure 5. A 25 mm × 230 mm fabric is placed on the mould and allowed to deform out of plane due to its self-weight. The deformation in the fabric was recorded with a digital single-lens reflex camera, and the captured picture was processed with ImageJ, an open-source program to measure the maximum deformation. A 4 mm deformation was measured in the mid-point of the deformed fabric.

Bending test experiment.
FEA analysis and material model validation
Draping behavior of the investigated fabric is captured with the help of material model MAT249_REINFORCED_THERMOPLASTIC available in FE-Software Ls-Dyna. The matrix is formulated as a thermal elasto-plastic material and reinforcement as an anisotropic hyper-elastic material. The overall stress response is evaluated using matrix and fibre contributions. Since the draping of dry fabrics is intended in the current work, very low properties are used for the matrix in the material model so as not to disturb the overall response. The stress response is calculated as an addition of matrix and reinforcement contributions as described in equation 4 [19].
The elastic tension/compression stresses of the fibre reinforcement are given as

Based on the input orientation angle, initial fibre configuration
Shear behavior of the fibre family is described as
Tensile test – FEA
Tensile test is simulated using fully integrated shell elements. Fully integrated elements will have 4 planar integration points. Element size of 1 mm is used to model the test coupons and the FE-model comprises of 2375 elements and 2496 nodes. Figure 6(b) shows the FE model of the tensile test. Green and blue are rigid bodies. A green body is fixed in all directions except Y, and a blue body is fixed in all directions. Rigid bodies are used to introduce displacements and constrain the ends. Figure 6(a) shows the load versus displacement response for a numerical against an experimental mean. Figure 6(c) and (d) illustrate displacement and stress contour in fibre direction. Figure 6(a) shows that there is a good agreement between numerical and experimental results. Thus, the numerical tensile behaviour can be used in a draping simulation.

(a) FEA vs. experimental response of the tensile test experiment; (b) FE model of the tensile test; FE model showing the (c) displacement and (d) tensile stress contour (MAT_249).
Picture frame test – FEA
The FE representative model of the experimental picture-frame test was constructed as shown in Figure 7(a). Red regions represent the fabric. Regions in which fabric is clamped to the plates are represented using rigid bodies. Similar to tensile test simulation, fully integrated shell elements [ELFORM = 16] are used. The bearing regions are modelled using stiff truss elements. The pulling node is free to move only in the Y direction, and its displacement in X and Z and rotations in all directions were constrained.

(a) FE model of the picture frame test; (b) FEA vs. experimental response of the picture frame test; (c) Shear angle contour (MAT_249).
MAT_249 can be used to model unidirectional as well as woven and non-crimp fabrics. To model the investigated woven carbon fabric, equation 10 was defined to model the elastic shear response for the variable METHij, which is tailored for woven fabrics. To produce an accurate force-displacement response, the frictional force (1.6 N) is subtracted from the experimental graph. As shown in Figure 7(b), the simulation results show an acceptable correlation with the experimental results. Figure 7(c) describe the shear angle contours in radians for a machine displacement of 100 mm. Thus, it can be used to model the in-plane response of the investigated carbon fabric.
Bending test – FEA
The FE representative model of the experimental bending test was constructed as shown in Figure 8(a). Fully integrated shell elements [ELFORM = 16] is used to model the fabric. In the material card MAT_249, transverse shear modulus that are normal [G23] and along the direction of fibre [G31] can be used to describe out-of-plane behaviour. Varying these values manually showed negligible effect on the bending behaviour of the fabric. Part_composite available in Ls-Dyna defines only one integration point (IP) per layer. Running the model with one integration showed a stiffer response in comparison to the experiment. The bending behaviour in the current study was identified by varying the position on the integration points in the FE model to match the experimental deformation test [20]. Integration rules are defined in natural coordinate system. Three relative distance for the IP to the middle plane is chosen as 0.125, 0.1, and 0.075, as seen in Figure 9.

(a) FE model of the picture frame test; (b) out-of-plane displacement response of the fabric due to its self-weight with 0.125 relative distance from the IP to the middle layer.

Available and modified relative distance of the IP to the middle layer.
For each simulation, the maximum deformation on the mid-point of the fabric is measured. Since gravity loads are used in the simulation, the model is run for 1 s to achieve a steady state. Maximum out-of-plane displacement was measured as 11.61 mm, 5.975 mm, and 3.904 mm for the relative distances of 0.075, 0.1, and 0.125, respectively, which shows that the relative distance from the IP to the middle layer has a significant influence on the bending deformation of the fabric. As shown in Figure 8(b), a 0.125 relative distance of the IP to the middle layer shows good agreement with the experimental value of 3.905 mm. This value can be used to model the out-of-plane response of the investigated carbon fabric.
Deformation of the fabric
Draping setup – Experimental
The carbon fabric with twill 2/2 weave was tested experimentally using the setup shown in Figure 10(a). Three steel pillars were used to connect the blank holders through the punch. 0/90°-oriented carbon fabric 250 mm in length and 300 mm in width was placed on the bottom mould. The punch was lowered, and the first contact was made from the blank holder with 40 N dead weights, which maintains the load on the fabric irrespective of the movement of the punch. The blank holders are not symmetrically positioned with respect to bottom mould. The left blank holder is at a horizontal distance of 60 mm from the bottom mould edge and the distance to the right blank holder is 50 mm from bottom mould edge. As shown in Figure 10(b), the movement of the punch drapes the fabric. The punch was removed to measure the deformation in the fabric. The initial experiment was performed without the blank holder, so there was no tension in the fabric, resulting in a large shear angle and wrinkling within the omega shape. After applying a blank holder, tension from the blank holder force created tension, which prevented large shearing in the omega shape of the part.

(a) Experimental setup of the draping process and (b) movement of the punch causing the deformation in the fabric.
Draping setup – FEA
The FE representative model of the experimental draping test was constructed as shown in Figure 11. Omega shaped punch with a length of 340 mm was used. A constant blank holder force of 80 N (40 N for each blank holder) was applied to hold the blank with the bottom mould. A rectangle composite blank has dimensions of 250 mm in length, 300 mm in width, and 0.3125 mm in thickness. Fully integrated shell elements [ELFORM = 16] are used for all bodies.

FE model of the draping test.
Comparison between experimental and FEA results
The experimental draped fabric is shown in Figure 12(a). The edge of the fabric undergoes shear deformation. No wrinkling occurred on the fabric. Numerical simulation of the draping procedure gives the final draped geometry of the blank. As shown in Figure 12(b), a shear deformation was observed on the edge of the fabric in the FEA model, which shows an acceptable agreement with the experimental draped fabric.

Results of the omega shaped drape using a) experimental setup and b) FEA model.
Experimental deformation in the fabric is recorded using an industrial non-contact GOM ATOS Core 3D scanner. ATOS Core sensor projects fringes onto the measuring object. The two cameras within the sensor system will captures the measuring process and will results in the 3D coordinates of the camera image pixels. The sensor will capture data only to the points which were visible to both cameras simultaneously. In order to scan the complete object, more scans were performed from different position. To combine different scans together within common coordinate system, reference points were used around the scanned object. To remove the reflection of the scanned object, the surface was sprayed with thin layer of NORD-TEST Entwickler U 89 spray. Scanned samples were post-processed using GOM correlate software (Figure 13).
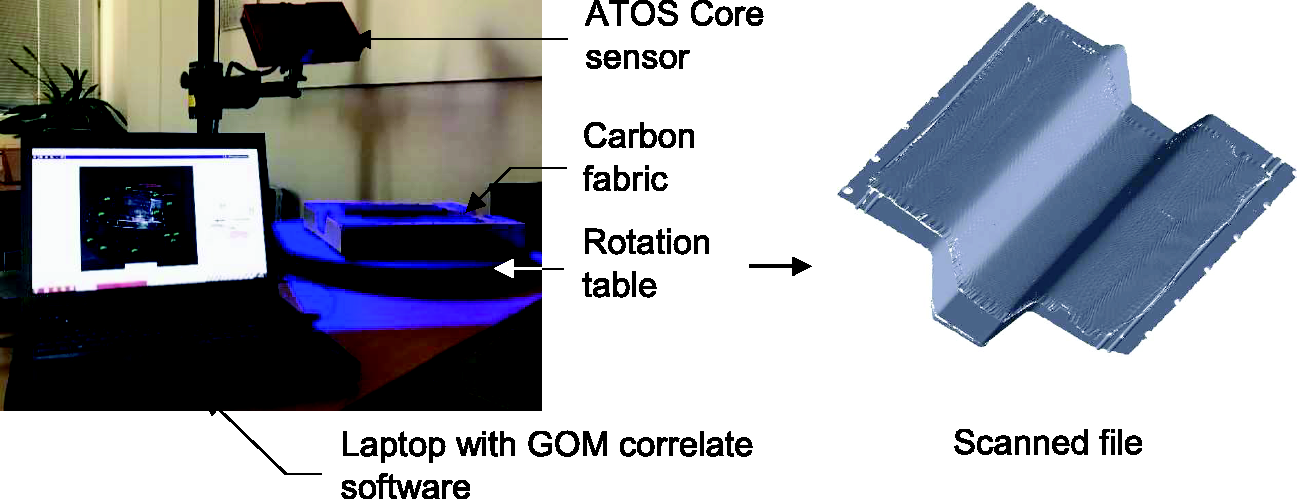
Scanning of the experimental draped fabric.
During the post-processing of experimental draped fabric in GOM correlate software, straight line along the weft and warp direction of the tows were drawn and angle between them was calculated, which also allow to measure the location of the points from the centre of the fabric. Both sides of the fabric undergo different shear behaviour. High shear deformation was observed only on one side of the fabric, which is considered as Side-A and other was considered as Side-B. Thirteen points were measured on both sides of the fabric. The points were measured at 50 mm from the edge of the fabric, as shown in Figure 14(a). Similar to experimental measurement, shear angles were measured at same points in blank. Experimental and numerical shear angles measured on both sides of the fabric are shown in Figure 14(b) and (c), respectively). Side-A has high shear compared to Side-B. On both sides, from points 1 to 9, the FEA accords well with the experimental results. The shear angle observed between these points is below 6°. The maximum shear angle deviation observed between experimental and numerical results is below ± 2.5°. The blank holder load also creates in-plane shearing in the fibres below the blank holders. The fabric below the blank holder undergoes high shear compared to other regions. For the fabric below the blank holder, more than 2.5° shear angle deviations were observed between experimental and numerical results. In both the experimental and FEA studies, shear angles were less than 12° and were thus less compared to the locking angle of the fabric. Thus, no wrinkling was observed during the draping process.
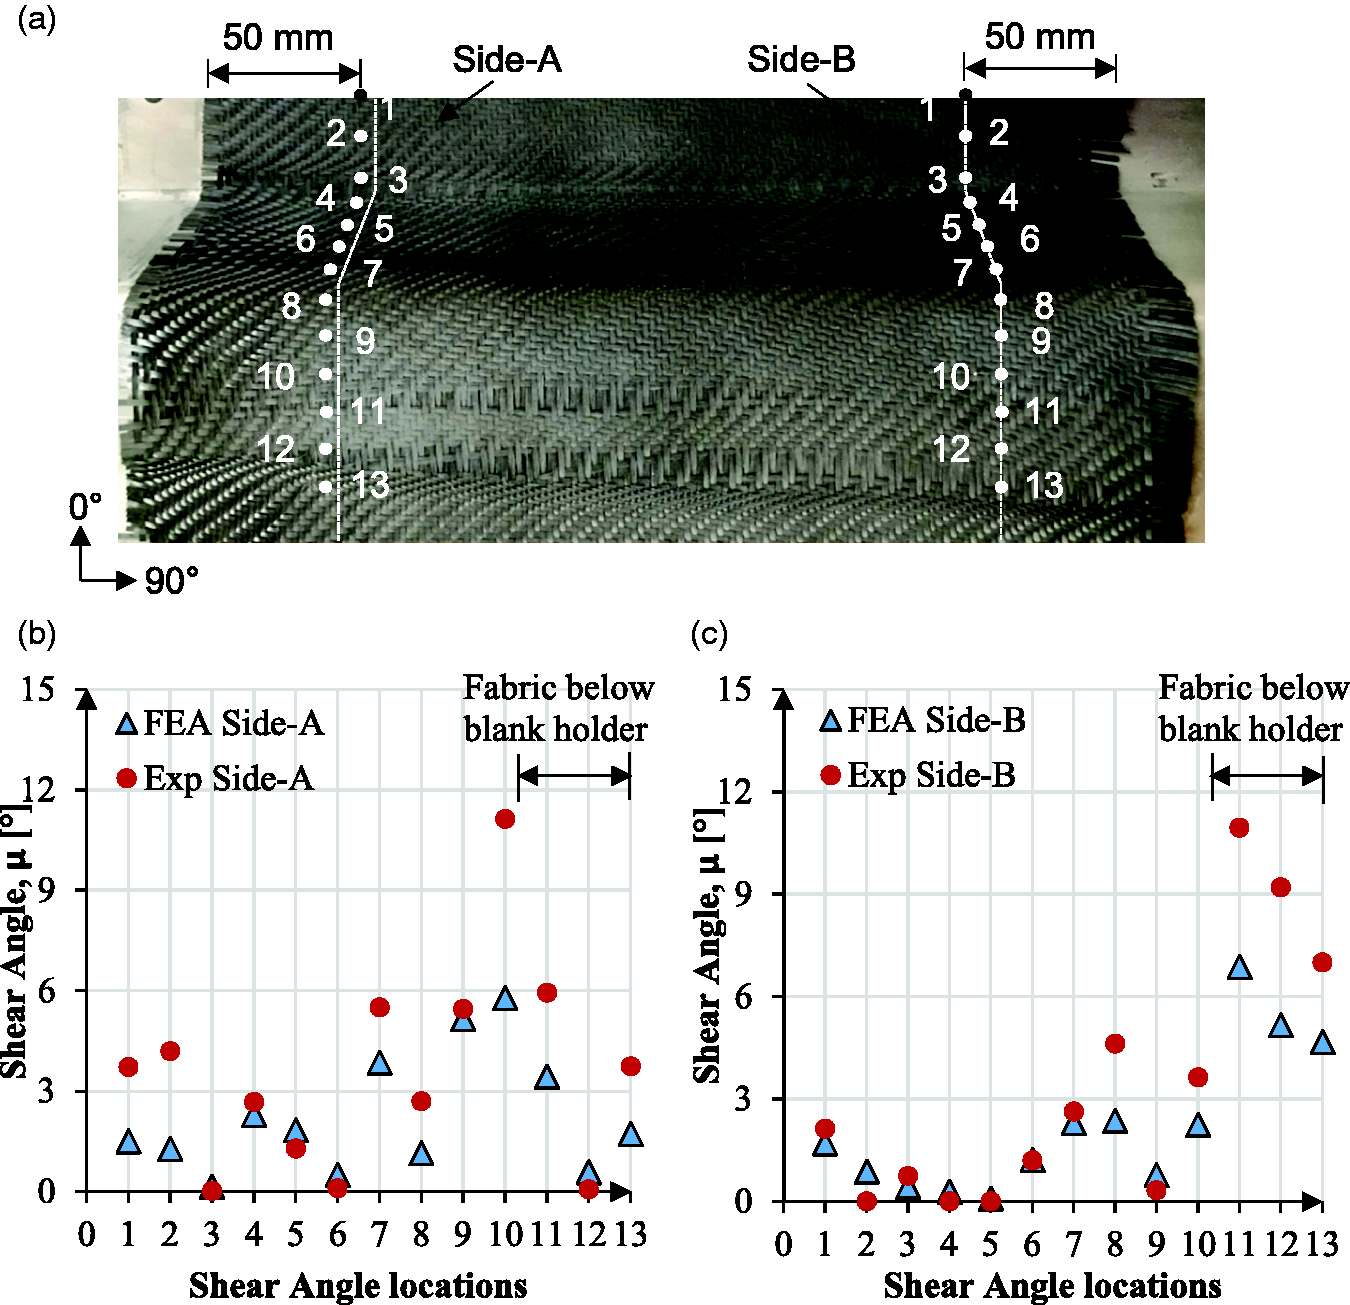
(a) The location of the shear angle measuring points; experimental vs. numerical shear angle comparison on (b) Side-A and (c) Side-B.
Conclusion
Experimental and numerical draping behaviour of the woven carbon fabric was investigated in this study. In-plane mechanical characteristics of the fabric was investigated using tensile and picture frame shear test. A simple set-up was used to study the out-of-plane bending deformation. MAT_249 material model in LS-DYNA was used to represent the fabric. Mean stress-strain response from tension test is used in the numerical model. Locking angle measured from picture frame test is 32°. Experimental values have an acceptable agreement with the numerical results. Out-of-plane bending behaviour of the fabric was significantly influenced by the position of integration points from the middle plane. With 0.125 relative distance of the integration point to the middle plane, a good agreement with the experimental result was achieved. An omega shaped draping set-up was designed and constructed to study the drapability of the fabric. Shear angle were measured at various points. A maximum deviation between simulation and experiment was ±2.5°, except for the fabric region below the blank holder. No wrinkling defects occurred on the fabric.
Footnotes
Acknowledgements
The paper was written in the framework of the “LocPro – Local production by smart value chains cluster” in the Graduate Research School established by Brandenburg University of Technology (BTU) Cottbus-Senftenberg.
Declaration of conflicting interests
The author(s) declared no potential conflicts of interest with respect to the research, authorship, and/or publication of this article.
Funding
The author(s) received no financial support for the research, authorship, and/or publication of this article.