
Abstract
The aim of this study executed on Silicon Nitride (Si3N4) yarn is to examine some bending damage behaviors and fracture mechanisms that occur during the 3D orthogonal fabric forming process. A three point bending experiment device has been developed in order to simulate the Z-binder yarn bending condition. The effects of weft density, fabric thickness, and yarn tension have been studied. The Weibull analysis of the tensile strength show that the bending damage increases with the increase of weft density, fabric thickness, and yarn tension. The resulting bending damage causes a reduction in yarn strength of between 2.5 and 17.2% depending on the bending parameters of yarn. The growth of the fibrillation area also reflects similar trends with tensile strength loss rate. The fibrillation length produced by the yarns is mostly distributed within the range of 0.3 to 0.9 mm. A comparison of the calculation result to experimental data shows the bending fracture probability of filaments inside yarn are less than that of monofilament. The tensile and bending fracture of Si3N4 filaments exhibit typical brittle fracture characteristics.
Keywords
Introduction
Silicon-Based structural ceramics are often considered to be the ideal wave-transparent and electrical insulating material under high temperature conditions because of their excellent properties such as high tolerance to mechanical stress, good thermal stability, low dielectric constant and high electrical resistivity [1–3]. The use of continuous silicon nitride fibers as a reinforcement enables ceramic matrix composites to have much higher damage tolerance than monolithic ceramics [4,5].
In order to assure the required quasi-isotropic characteristics and near-net shape enhancement architecture, silicon nitride fibers are often made into three-dimensional fabrics in practical applications [6–8]. However, during the 3D weaving process, brittle multiply yarns are difficult to weave and are susceptible to damage due to abrasion and flexure [9–11]. 3D woven fabrics can usually be divided into two parts as fully interlaced 3D angle-interlock woven and non-interlaced orthogonal woven [12]. Compared to 3D angle-interlock weaving structure, the 3D orthogonal provides an advantage by reducing the amount of manipulation, thus reducing the abrasion and flexure of the warp and weft yarns during fabric processing [13]. In addition to this, the characteristics of 3D orthogonal woven fabrics are that the warp and weft yarns are almost non-crimp in the fabric, the outer weft yarns are bound by the yarns passing through the thickness direction (Z-binder yarn), which can significantly improve the mechanical properties in the thickness direction of the composite [14].
Although the 3D orthogonal weaving method makes the yarn reduce the damage caused by the loom motion and the friction between yarns, its structure parameters will cause the bending damage of the Z-binder silicon nitride yarns, as illustrated in Figure 1. The z-binder’s major role in the mechanical behavior of the 3D composite is found to be associated with transverse reinforcement, coupled with significant out-of-plane effects which are strongly related to progressively evolving failure patterns [14]. Therefore, the damage of Z-binder yarn will seriously affect the mechanical behavior and failure modes of composite materials.

Fibrillation formed by bending on the surface of 3D orthogonal Si3N4 fabric.
The objective of this investigation is to simulate and quantify the bending damage of Z-binder Si3N4 yarn during 3D orthogonal fabric forming process. So far, only a small amount of research has been conducted on the bending damage of inorganic high-performance yarns. Schoppee and Skelton [15] developed a bending–breakage test method, and the test results showed that break occurred in bending of a glass fiber when the surface strain reached 7.3% and in carbon fibers at 1.4 and 2.8% respectively. The rupture is a brittle fracture due to tensile extension, but occurs at values slightly greater than the breaking strain in tensile tests because the effective length is much lower. Dasilva et al [16]. compared the fracture faces of several commercially available carbon fibers produced after failure under flexural deformation, most of the tests were attempted with Type O knots method. Naito et al. [17]. evaluated the flexural behavior of polyacrylonitrile (PAN) and pitch based single carbon filaments by using a three-point bending test at various span lengths ranging from 200 to 1500 μm, the fracture characteristics on both tensile and compression sides have been characterized by scanning electron microscope (SEM).
In addition to the research on yarn damage evaluation, there are also a number of recent studies to investigate the damage behavior of yarn in the weaving process through experimental simulation methods. Tourlonias [18] simulated the friction and wear of carbon yarn during weaving by installed a pair of specific yarn carriers on pin-on-disk tribometer, the yarn fibrillation was characterized by using optical fibrillation meter, a numerical image processing was employed to analyze the number of broken fibers from the yarn assembly. Our group has established a series of experimental simulation methods for studying yarn damage according to the contact and movement characteristics of the yarn during weaving process, including the abrasion between warp and weft yarns [19] and between warp yarn and reed dent [20] in the beating stage. The quantitative characterization of yarn damage was examined by their residual tensile properties and surface fibrillation analysis after friction test.
Yarn damage caused by friction has been studied in depth, but until today, there has been no experimental simulation research on bending damage of high-performance yarn during weaving process. In the present work, a high accuracy three-point bending device has been developed to reproducing the Z-binder yarn bending damage during the 3D orthogonal fabric forming. The effect of weft density, yarn tension and fabric thickness on the bending damage of Z-binder yarn can be simulated by adjusting the radius of curvature and altitude of the loading pin, the span of supporting pins and the tension of test yarn. The fibrillation distribution and the residual tensile strength analysis are employed to quantify the degree of yarn damage. The bending fracture probability calculation method of monofilament is established with the help of beam bending stress formula. The calculated and tested fracture probability results are compared and analyzed. Finally, the fracture morphology of Si3N4 filaments subjected to tensile and flexural test are characterized by SEM.
Experimental
Materials
The Si3N4 yarn used in this study was provided by Xiamen University. The density of the Si3N4 yarn was 2.2 g/cm3, the linear density was 156tex, and the average diameter of the filaments within the yarn was 14 μm. All specimens were conditioned in a standard atmosphere of 60 ± 2% R.H. and a temperature of 25 ± 2 °C during testing. Epoxy resin JL-155 was used for cross-section sample preparation, which was purchased from Changshu Jiafa Chemical Co., Ltd.
Bending experiment
The aim of the experiment was to simulate the movement of Z-yarns in the 3D orthogonal forming process in terms of bending damage. A photograph of the experimental set-up is shown in Figure 2. The main capability of the device was through two-point supporting and one-point loading pin pressing down, the yarn could be formed into the similar bending state as the Z-binder yarn in the actual 3D orthogonal fabric under constant tension.
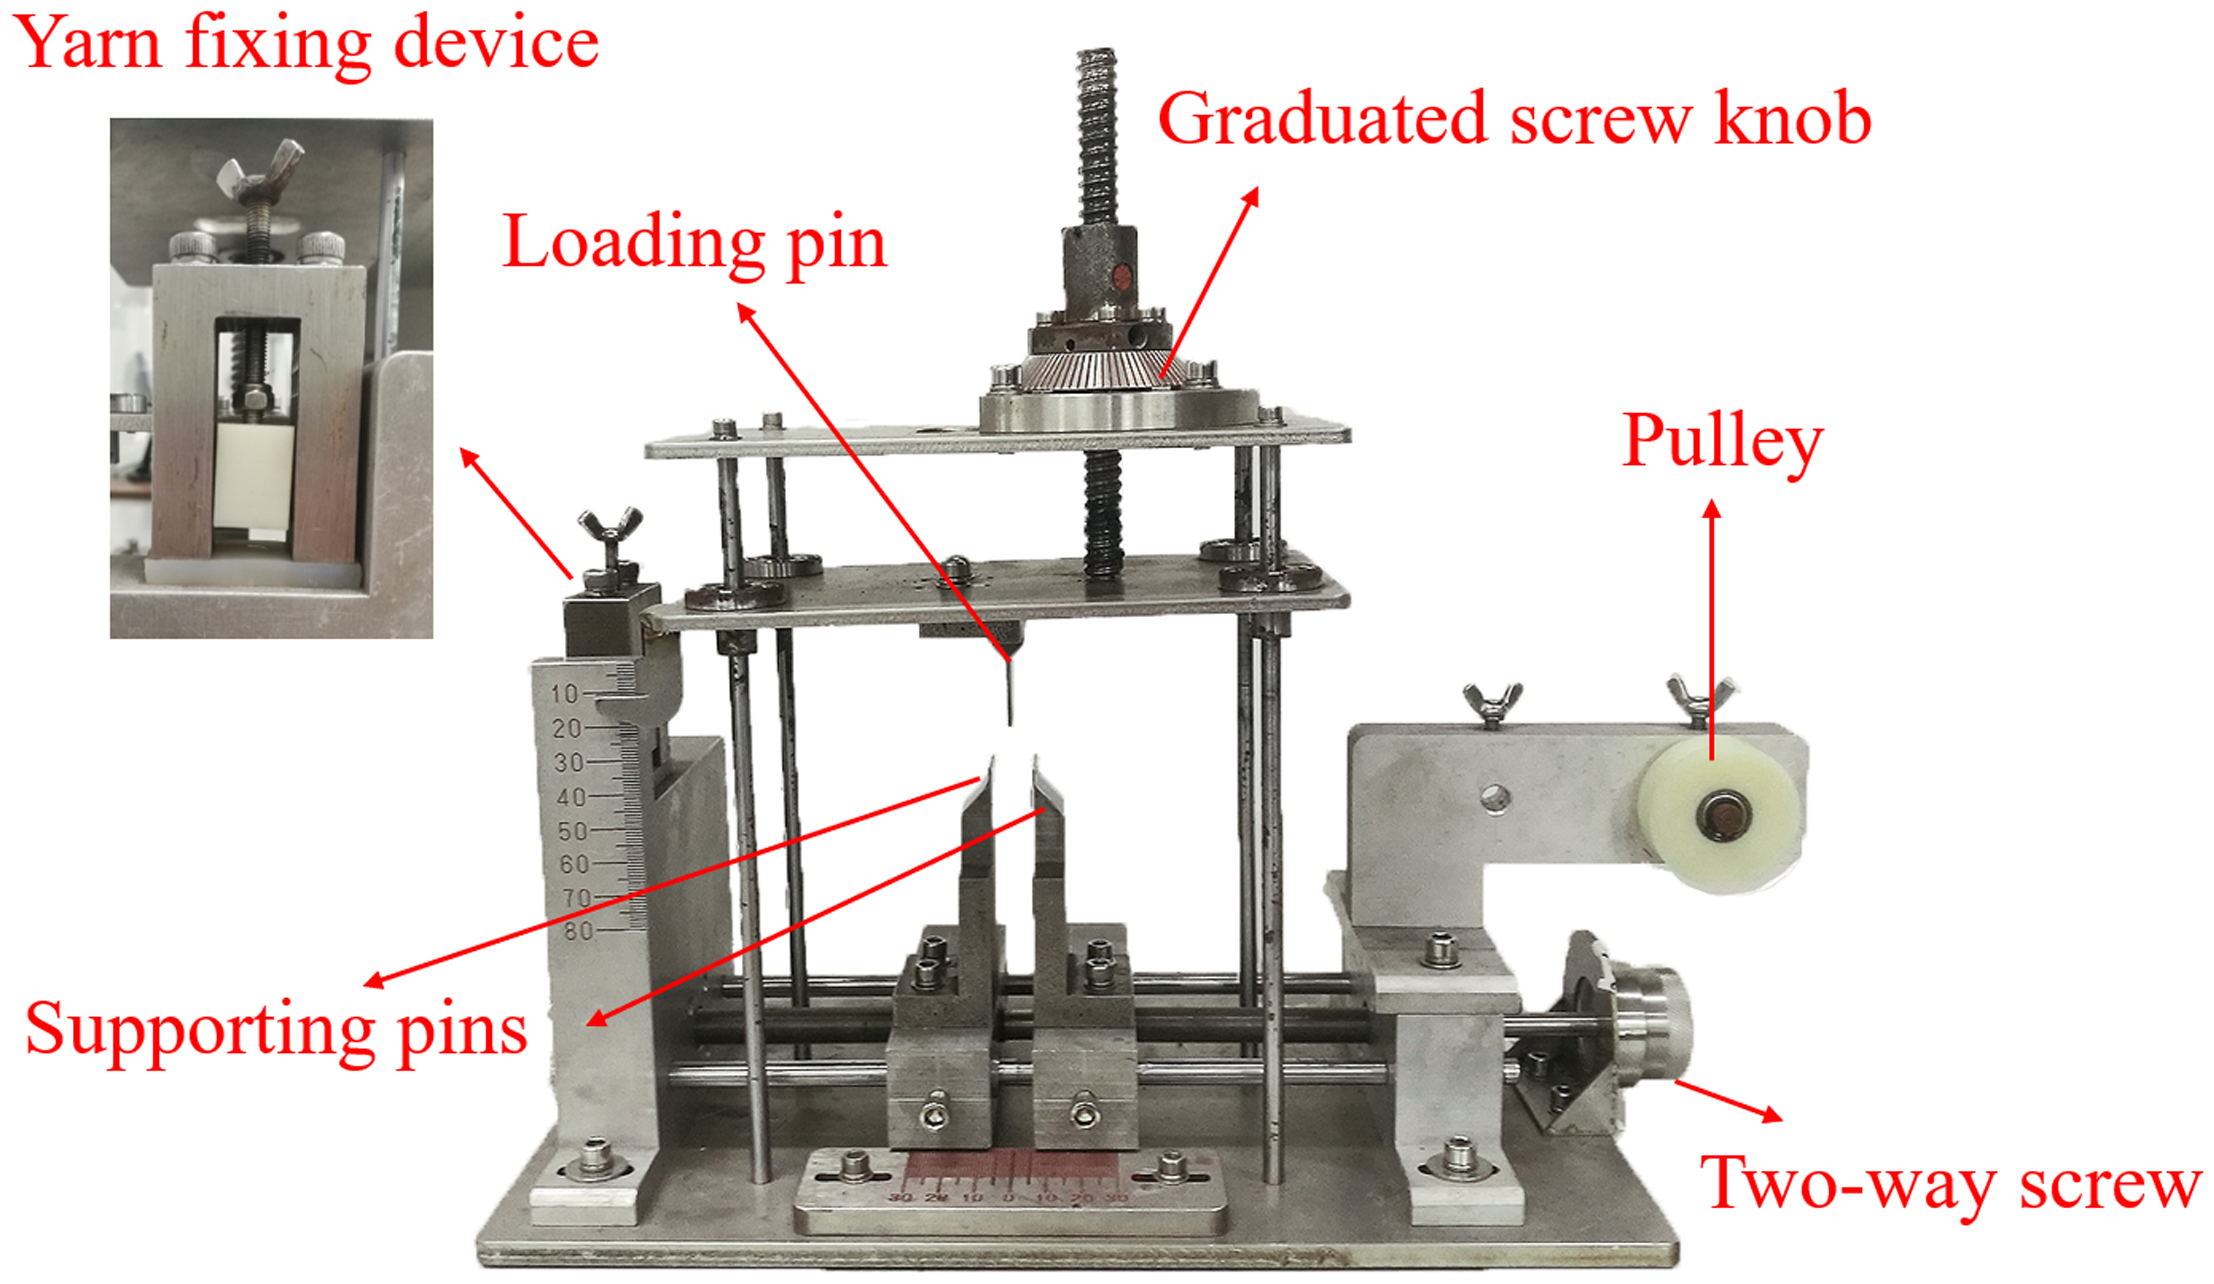
Photograph of high accuracy three point bending test device.
In the testing process, an appropriate length (about 300 mm) of yarn was firstly cut from the roll, one end of the yarn was fixed by the yarn clamping fixture and then positioned to rest on two supporting pins and a plastic pulley. Then the other end of the yarn attached to the weight with the aid of nylon thread and plastic tube. The vertical lifting movement of the loading pin was adjusted by rotating the graduated screw knob, the transmission accuracy of the screw thread was 0.1 mm. The horizontal reciprocating motion of the two supporting pins were controlled by rotating the two-way screw. Unlike the three-point bending test of plastics and composites, this method was to first move the loading pin down to the set height by rotating the graduated screw knob clockwise, and then move the two supporting pins to reach the set span by rotating the two-way screw clockwise, as reviewed in Figure 3. The movement sequence was derived from the actual fabric forming process.

Schematic of yarn bending experiment process.
The preselecting of bending experimental parameters
The bending parameters of the Z-binder yarns during 3D orthogonal fabric forming are mainly influenced by the weft density and fabric thickness. In order to simulate bending damage of Z-binder yarn, we need to preselect a reasonable range of bending experimental parameters first. These parameters include loading pin radius, pressing depth and supporting span. Therefore, a group of 3D orthogonal woven fabric samples were prepared. The parameters to be measured in the pre-screened samples are marked in Figure 4, ‘R’ is the bending radius of the Z-binder yarn, ‘L’ is the span between two adjacent peaks, ‘H’ is the fabric thickness. Each parameter was measured 10 times and averaged. The designed fabric parameters and morphology of Z-binder yarn cross-sections are shown in Table 1, where P01, P02, P03 are fabric samples with different weft densities and P01, P04, P05 are fabric samples with different thicknesses. As can be seen from Table 1, the increase in weft density leads to a decrease in the span between two adjacent peaks and the bending radius of Z-binder yarn. An increase in fabric thickness also led to a decrease in the bending radius of Z-binder yarns, but had no effect on the span between two adjacent Z-binder yarn peaks.
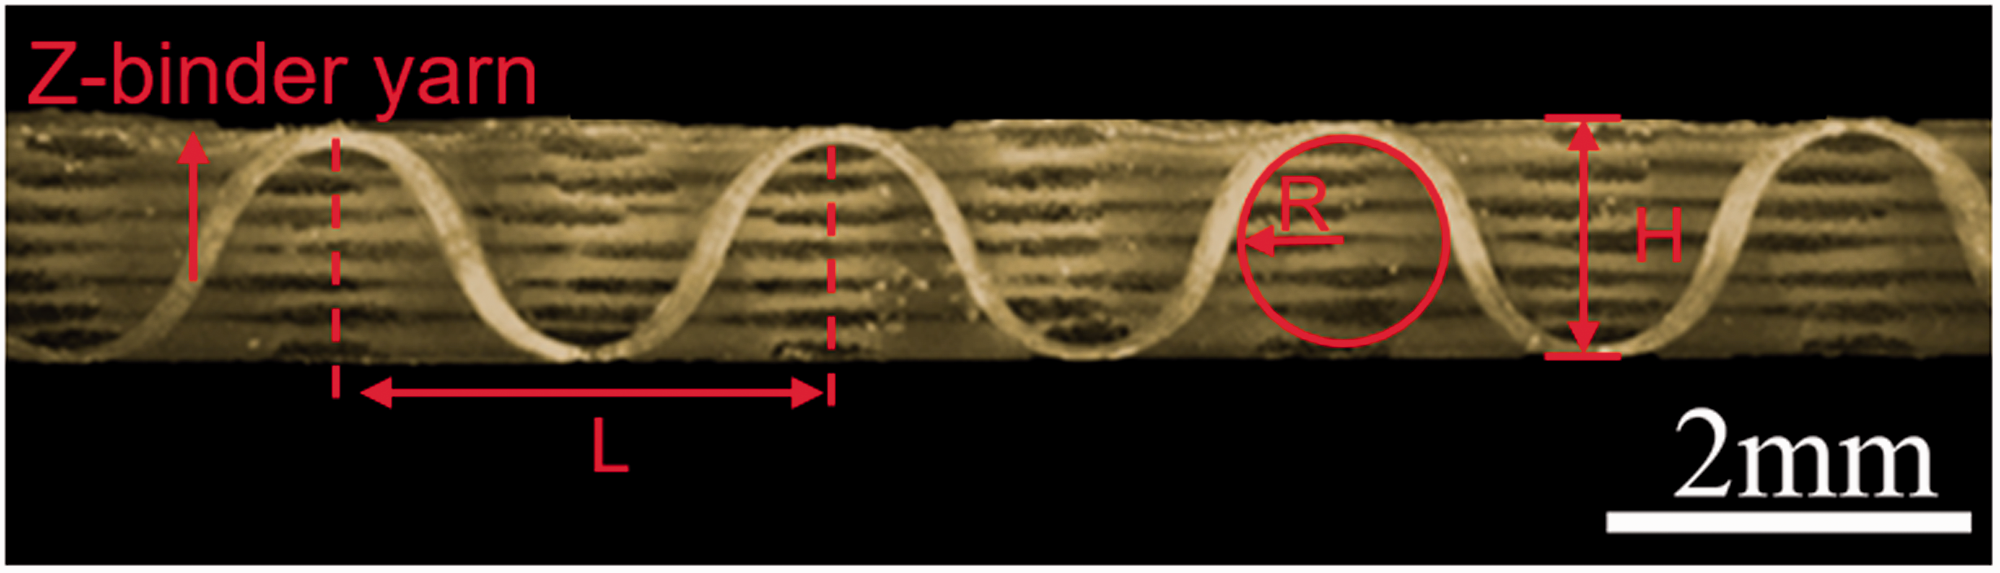
Schematic diagram of Z-binder yarn parameter measurement.
Preselected Z-binder yarn bending feature parameters.

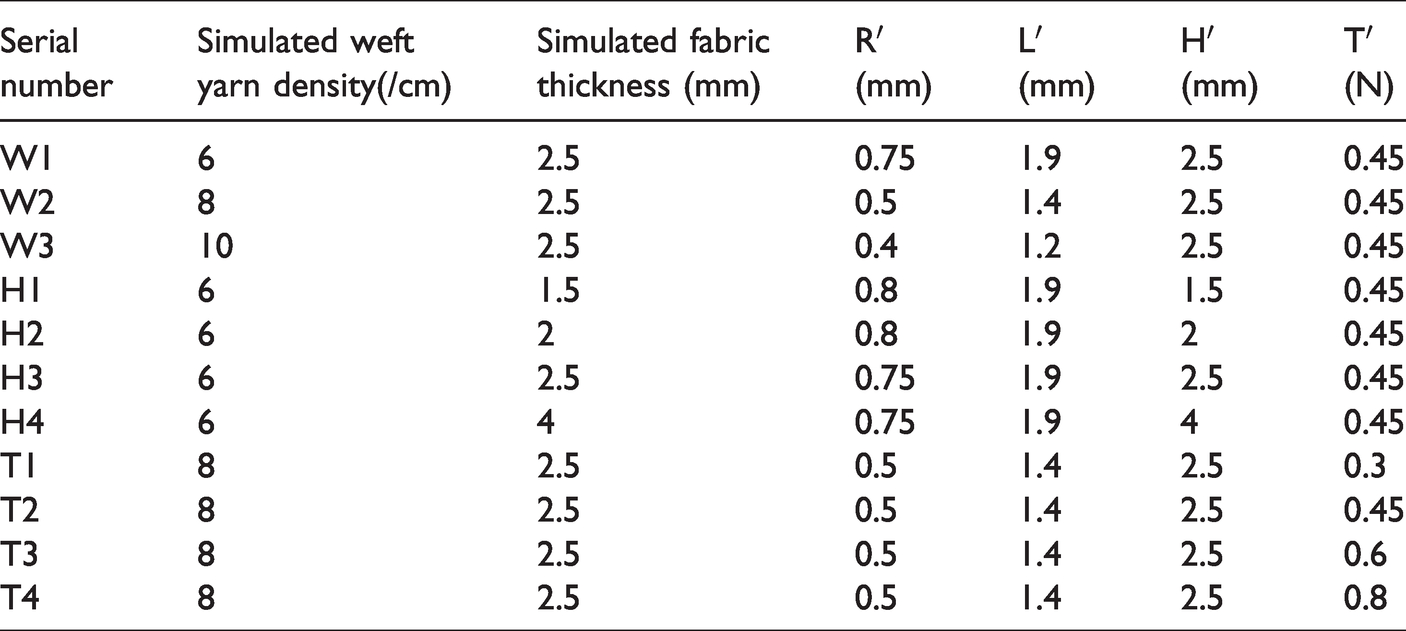
The bending experiment parameters in Table 2 were designed to simulate the effect of weft yarn density, fabric thickness, and yarn tension on Z-binder yarn bending damage during 3D orthogonal fabric forming. The selected radius of curvature (R’) and the bending span (L′) in this experiment were determined according to the R, L values obtained in Table 1. The applied yarn tensions (T′) were selected according to the actual ordinary Z-binder yarn tension (0.3–0.8 N) on the 3D weaving loom [21]. The vertical depression depths (H′) depends on fabric thickness.
Bending experiment parameters.
Characterization
The schematic diagram of fibrillation statistical process is shown in Figure 5. There were three steps: step 1, taking a sideview picture of the yarn sample under each bending test, as revealed in Figure 5(a), step 2, employing an image processing software (ImageJ 1.46r) to highlight the fibrillation of yarn (Figure 5(b)), step 3, enlarging the fibrillation area and measuring the total area of fibrillation and the fibrillation length (Figure 5(c)). Due to the resolution of the microscope, the processing of images using this method may cause the absence of a small number of very fine fibrillation, which can give rise to some errors. The fracture morphology of single Si3N4 filament was examined through scanning electron microscopy (SEM, S-4800, Hitachi Ltd., Japan).
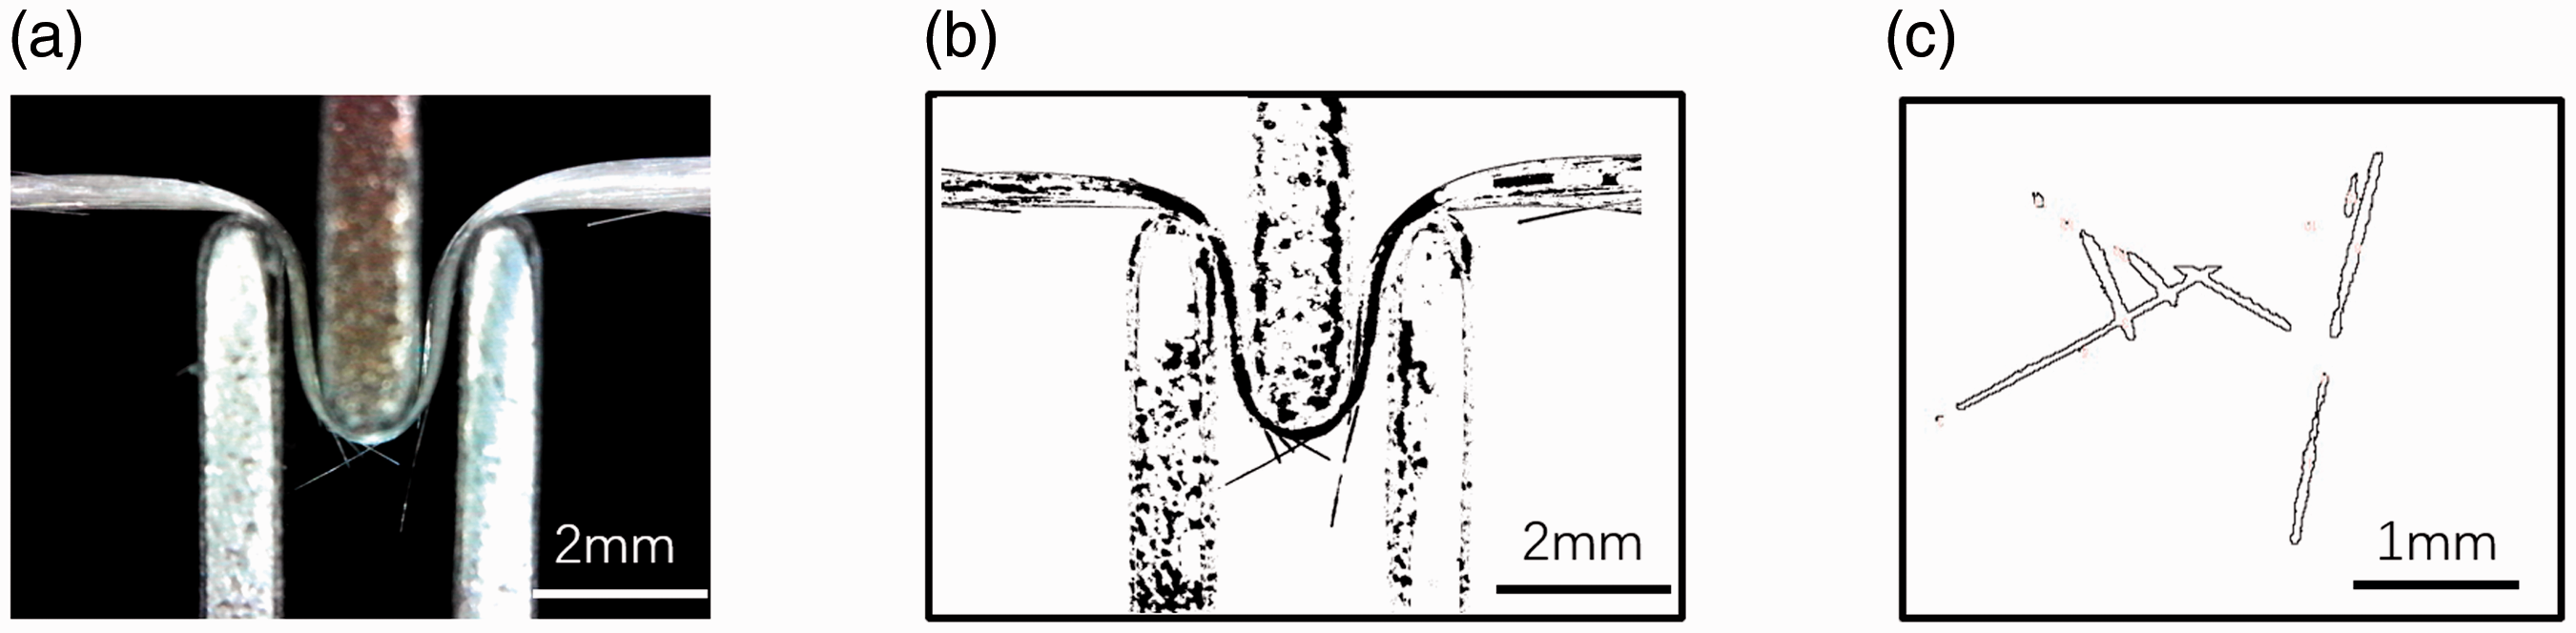
Schematic of statistical method for Si3N4 yarn fibrillation. (a) Photograph of Si3N4 yarn after bending test. (b) Processed image. (c) Enlarged fibrillation.
The bending damage of the Si3N4 yarns was also examined by testing the tensile strength. The tensile strength was determined according to the ASTM D2343 method [18]. All tests were done under the condition of 25 ± 2 °C and 60 ± 2% relative humidity with an universal testing machine (SHIMADZU AGS-J) on twenty samples for each group. The tensile strength distribution 
The single filament tensile testing was carried out with YG001A Electronic Single Fiber Strength Tester by moving the upper capstan at a constant rate 1 mm/min in accordance with standard ISO11566:1996 [22]. The tensile strength of single filament was determined from the maximum applied breaking force by using the equation:
The Young’s modulus of single filament (
Results and discussion
The analysis of fibrillation distribution
The effect of weft density, fabric thickness and yarn tension on the fibrillation distribution and morphology of the Si3N4 yarns as measured under the bending tests are displayed in Figure 6. Figure 6(a) corresponds to the sample groups of W1, W2, and W3 in Table 2. It can be seen from Figure 6(a) and Table 2 that as the weft density increased, the fibrillation area is increased while the uniformity of fibrillation distribution gradually become narrower. When the simulated weft density come up to 10 yarns/cm, the number of fibrillation increased by almost three times compare with the case of 6 yarns/cm, however, there are almost no fibrillation longer than 1.2 mm, which indicates that a larger weft density tends to generate shorter fibrillation. The increase in the density of the weft yarn causes a decrease in the radius of curvature and bending span. The change in these two factors leads to an increase in the curvature of the yarn and an increase in the length of the yarn involved in the bend, which ultimately results in an increase in the fibrillation area.

The effect of simulated fabric parameters on the average fibrillation area and fibrillation length distribution. (a) weft density; (b) fabric thickness; (c) yarn tension.
Figure 6(b) corresponds to the sample groups of H1, H2, H3 and H4 in Table 2. As is shown in Figure 6(b),when the depression depth is less than 2.5 mm, only a small amount of fibrillation is generated on the yarn surface, especially the fibrillation area is almost equal at the thickness of 2 and 2.5 mm, but when the depression depth reaches 4 mm, the fibrillation area is increased significantly. It should be noted that the reason for ignoring the 3 mm thickness parameter here is that the hairiness data measured at this parameter are essentially similar to those at 2 mm and 2.5 mm. Experiments have shown that significant bending damage occurs in yarns with a thickness parameter of 4 mm at this span, so the results obtained with this parameter have been chosen for analysis. The hairiness area of the yarn goes from holding steady to increasing rapidly as the depression depth increases from 2 mm to 4 mm. This is attributed to the fact that many of the filaments in the yarn exceed the critical curvature value for bending fracture when the depression depth reaches 4 mm. In addition to this, it is worth noting that the fibrillation ratio in the range of 0.9–1.2 mm in length increases significantly with the increase of the depression depth, which means the Z-binder yarn surface of thicker fabrics (≥4 mm) is more likely to produce longer fibrillation.
Figure 6(c) corresponds to the sample groups of T1, T2, T3 and T4 in Table 2. It can be seen from Figure 6(c) that the fibrillation area increases with the increase of the yarn tension, but it does not result in a monotonous variation in the fibrillation length distribution. This is most likely due to the fact that the increase in yarn tension also leads to an increase in the tensile stress of the monofilament, which in turn increases the probability of filament fracture.
According to the analysis results in Figure 6, the fibrillation length produced by the yarns is mostly distributed within the range of 0.3 to 0.9 mm. The fibrillation area increases with the increase of the weft density, fabric thickness and yarn tension. The increase of the weft yarn density leads to an increase in the bending curvature of the yarn and a decrease in the bending span, which will cause more single filaments in the inner layer of the yarn to reach the bending fracture limit and cause fracture failure, resulting in a large number of shorter fibrillation. The increase in the thickness of the fabric leads to an increase in the bending deflection of the yarn, and at the same time the length of the yarn participating in the bending between the two supporting pins increases. Therefore, the increase in bending yarn length also increases the probability of longer fibrillation.
Tensile strength analysis of yarns after bending test with Weibull distribution
Cumulative probability distribution curves for the yarn tensile strength after bending are illustrated in Figure 7. The average tensile strength and Weibull modulus values of the yarns are listed in Table 3. As can be seen from Figure 7 and Table 3 that the tensile strength is decreased with the increase of weft density, fabric thickness and yarn tension respectively. The weft density had the most significant effect on yarn tensile strength. When the simulated weft yarn density came up to 10 yarn/cm (W3 in Table 3), the average tensile strength dropped by 17.2%. This result can be interpreted by considering that the increase of weft density caused an increase in the bending curvature of the yarn and a decrease in the bending span, both of the two factors tend to cause more severe damage to the yarn. Compared with the original yarn, the tensile properties are reduced by 2.5–5.4% when the simulated fabric thickness is below 2 mm, a similar yarn performance loss is obtained at the deflection of 2 and 2.5 mm. As the depression depth come up to 4 mm, the tensile strength fell about 14%. Table 3 also illustrates the effect of yarn tension (from 0.3 to 0.8) on the tensile performance of the tested yarns, the result shows the tensile strength loss rate is in the range of 3.8–13.5%.

Cumulative probability distribution plots for tensile strength of z-binder yarn at the different bending test simulation parameters. (a) weft density; (b) bending depths; (c) yarn tension.
Mean tensile strength and Weibull modulus values of the tested yarns.

The Weibull modulus of the Si3N4 yarns is calculated and listed in Table 3. The results show that the Weibull modulus decreases with the increase of weft density, but no obvious tendency with the increase of fabric thickness and tension. The Weibull modulus is attributed to the distribution of the defects, which are present in the yarns. Meanwhile, the tensile strength is assumed to be controlled by these defects, which are statistically distributed [23]. This result can be interpreted that larger weft yarn density caused more bending breakage of filaments which can result in a smaller actual number of continuous filaments is subjected to the maximum stress during the subsequent tensile test. In that case, the probability of having critical defects that contribute to failure is lower, leading to a lower Weibull modulus.
Bending fracture probability analysis
In order to better understand the conditions under where the monofilament breaks inside the yarn, we calculated the probability of monofilament breakage under different weft yarn densities with the help of beam bending stress formula. The tested average tensile strength of single Si3N4 filament is 1.3 ± 0.3 GPa and the average elastic modulus is 135 ± 15 GPa.
According to the curved beam model, as shown in Figure 8, the bending strain 


Single filament bending parameters.
For single filament, the position of the neutral axis would be shifted due to the difference in the values of the filament's compressive elastic modulus and tensile elastic modulus, which cause the variations of strain on the outside of filament. This analysis model is established on the assumption that the bending and tensile elastic modulus are equal.
Figure 9 shows the stress distribution on the cross-section of single filament. As revealed in Figure 9, the stress distribution of the filament cross-section is the superimposed result of the stress caused by the pure bending of the filament and yarn tension.

Stress distribution on the cross section of single filament. (a) pure bent (b) tension stress distribution (c) superimposed stress distribution.
In the calculation of bending stress, we consider it as pure elastic deformation, and the cross-section stress distribution expressed as:

The bending radius of the Z yarn determines the maximum number of weft yarns per unit length. It means the weft density 
The probability of filament breakage (
By substituting equations (7) to (9) into equation (10), the relationship between 
Figure 10 illustrates the measured average tensile strength loss rate, average fibrillation area and the calculated average fracture probability from equation (11) against weft density. The comparison between tensile strength loss rate and fibrillation area curve turns out that they share the similar trend. Here, the percentage of tensile strength loss varies from an average of 5.3% at 6 yarns/cm to 17.2% at 10 yarns/cm and the fibrillation area varies from an average of 0.04 mm2 at 6 yarn/cm to 0.11 mm2 at 10 yarn/cm. This result proves that the growth rate of the fibrillation and the loss rate of yarn tensile performance are similar. It can be also observed from Figure 10 that these two indicators are much smaller than the calculated average probability of single filament breakage. This is probably attributed to the fact that not all of the filaments are regularly oriented to the length direction of the yarn [24], the bending curvature of the irregularly oriented filaments are significantly smaller than the oriented filaments, as the green filament schematic is shown in Figure 11. Therefore, the decrease of bending curvature reduces the probability of bending damage.
Comparison of single filament fracture probability, tensile strength loss rate and average fibrillation area of yarn.

Schematic diagram of oriented and irregularly oriented filaments during bending test.
Characterization of the fracture morphology
The fracture morphology of these Si3N4 filaments subjected to tensile (a-c) and flexural (d-f) tests are shown in Figure 12. Note that the Si3N4 filaments reveal a classical brittle fracture. As can be seen from Figure 12(a) to (c), the tensile breaks perpendicular to the fiber axis. Evidence from the block peeling structure in Figure 12(a) and pit structure in Figure 12(c) shows that the crack growth starts from surface flaws of filament. The observation of fracture morphology of Si3N4 filament in Figure 12(b) reveals an aggregated granular structure. It is supposed that some weaker grain boundaries reaching the surface are responsible for the crack initiation.
Fracture morphology of the damaged filaments after tensile test (a–c) and after three point bending test (d–f).
Unlike the tensile fracture section, the bending test breaks at an angle to the fiber axis and the roughness of the cross-section is significantly increased, as reveals in Figure 12(d) to (f). It is possibly because of the unbalance of stretching and compression stresses of the filaments during bending test. It can be seen from these images that each bending breakage starts from a small mirror region, and then spreads to form wedge-shaped fracture, protruding block fracture or other irregular morphologies. This can be explained by the fact that on the tensile side of the filament, the crack initially propagated perpendicular to the fiber axis and subsequently formed a bifurcation or branching failure structure until it reached the neutral axis of the filament. Beyond the neutral axis, because the change in stress field at the crack tip, protruding block fracture was produced [25].
Conclusion
A specific experiment has been developed in order to reproduce the bending damage phenomena of Z-binder Si3N4 yarns that occurs during the 3D orthogonal fabric forming process. The evolution of tensile strength and fibrillation have been studied by simulating the experimental parameters: weft density (6–10 yarns/cm), fabric thickness (1.5–4 mm) and yarn tension (0.3–0.8 N). The increase of weft yarn density, fabric thickness and yarn tension enhance yarn bending damage. The variation range of the yarn tensile property loss rate caused by the experimental parameters is 2.5–17.2%. The Weibull modulus analysis shows larger weft density reduced the performance fluctuations between measured samples. The statistical fibrillation increases with the increase in weft yarn density, fabric thickness and yarn tension. Fibrillation length distribution is in the range of 0–1.2 mm, which mostly distributed within the range of 0.3 to 0.9 mm. The average fracture probability of single filament is significantly higher than the actual bending damage of the yarn, which is probably caused by the irregular orientation of the filaments in the yarn. The fracture surface analysis shows that the Si3N4 filament exhibits typical brittle fracture characteristics.
Footnotes
Declaration of conflicting interests
The author(s) declared no potential conflicts of interest with respect to the research, authorship, and/or publication of this article.
Funding
The author(s) disclosed receipt of the following financial support for the research, authorship, and/or publication of this article: This work was supported by the Key Scientific Research Projects of Tianjin Education Commission (No. 2019ZD03), The Aviation Science Fund of China (No. 2019290M2001), Tianjin Higher Education Innovative Team Training Program (No. TD13-5043).