
Abstract
The effect of normal load on the frictional and wear behaviour of carbon fiber is investigated by simulating the tow-on-tool friction relevant to the beating-up motion of three-dimensional (3 D) weaving process. The true number of contact filaments over a range of normal loads is calculated by characterizing the cross-section parameters of carbon tow. The real contact area is calculated on the basis of the filaments amount by Hertzian contact model. The friction force values obtained from multiplying the real contact area with shear strength are closely with the measured results. The coefficient of friction increases with the increase of normal loads. When the normal load is 250, 400 and 600 mN, the tensile loss rate of the carbon tow after friction test is 6.3%, 23.2% and 42.4% respectively. The filaments reveal multiple fracture damage patterns which are caused by stretching, shearing and compression during the weaving process.
Introduction
3D woven fiber composites have appeared as a new type of light-weight material that has advantages in tensile, compression, interlaminar fracture toughness and low-velocity impact damage tolerance [1–5]. These advantages of 3 D woven composites lead to their growing applications in the fields of aerospace, aviation, maritime, biomedicine, and infrastructure [6,7].
Carbon tows have to undergo many mechanical stresses such as stretching, bending, twisting and shearing during the weaving process [8–10]. Compared to 2 D weaving situation, 3 D weaving causes greater friction and wear to carbon tows [11]. For example, in the beating stage of 3 D orthogonal weaving process (Figure 1(a)), since multilayer weft yarns need to be introduced all at a time for each beating, it is necessary to apply a larger beating force than 2 D weaving process. Figure 1(b) illustrates the photograph of 3 D fabric after beating-up. It can be seen from Figure 1(b) that many hairiness appears on the surface of fabric. Archer et al. [8] and Lee et al. [9] investigated the effect of 3 D weaving on the tensile performance loss of carbon tows. The results showed that 3 D weaving damage reduces the tensile strength of carbon tow by 9–12%.

(a) Schematic of 3 D orthogonal weaving process. (b) Photograph of the fabric surface after beating-up.
Fibrous materials exhibit a special tribological mechanism due to the soft matter characteristics of porous and highly deformed structure.Researchers have proposed many friction theories and calculation methods based on the physical performance of fiber assembly. Unlike hard materials, the Coefficient of Friction (COF) of fibrous materials varies with applied normal load, and they do not conform with Amontons' first law: F = μW [12]. Where F is friction force, W is normal load, µ is COF and remains constant. In order to describe friction behavior of fibrous material, a more general accepted relation between the normal load and the frictional force was proposed: F = kWn [13]. Where k and n are experimentally determined proportionality constants. This relationship is equally applicable to experiments on individual fiber filaments [14–17], just like experiments on fiber tows [14,17–21]. Bowden and Tabor [22] developed the ‘constant interface strength’ model of friction, they announced that the friction force F is determined by the product of the interfacial shear strength τ of the contacting materials with the real contact area Ar: F = Arτ. In this model, the real contact area almost determines the friction behaviour of the material. For multifilament arrangements, Cornelissen et al. [19] proposed a method for investigating the real contact area of fiber tow in tow-tool situation. The real contact area between single filament and the counterface is calculated by Hertzian line contact model, the amount of contacting filaments for each tow material was estimated from observations of the contacting tow shape [23].
Normal load is considered to be the critical factor affecting the real contact area. Gupta and Mogahzy [24] established an improved structure model that getting insight into relationship between normal load and real contact area. The model suggested normal load acting on tows Ntow and real contact area Ar fitted to the power law, namely: Ar = kNtow n (It should be pointed that Ntow shares the concept with normal load W in the above paragraph), where k and n are constants defining the nature of the relationship. Other than this, Cornelissen et al. [25] and Mulvihill et al. [20] respectively studied the friction behaviour about tows over a range of normal loads and found friction force increased as normal load. An explanation provided by them for the result was that an increase in the contact area led adhesion to be stronger, which in turn resulting in an increase of friction force.
The establishment of fibrous contact theory models and experimental methods provide a basis for studying the friction and wear behaviour of carbon tows under complex working conditions. In recent years, some experimental simulation methods in tow-on-tow contact under 3 D weaving conditions have been developed, the influence of weaving process parameters on the friction behaviour of carbon tow was discussed [15,26–28]. Despite the surging interest in the scene of tow-on-tow friction test simulation, only limited attention has been given to the influence of tow-on-tool friction during 3 D weaving process. The purpose of the present study is to simulate the friction phenomena between warp tows and reed dent with an experimental set-up, which consists of a reciprocating motion similar to the beating-up movement. An experiment device developed in this study made it possible to simulate the frictional process parameters and obtain the friction force and COF value. Another device developed to prepare samples for characterizing cross-sectional profiles of carbon tow under different normal loads. Based on the characterization results, we combined carbon tow cross-sectional area analysis and Hertz contact model to investigate the relationship among normal load, real contact area and friction force in tow/reed dent contact by loading on tows over a limited range of normal loads. In addition, the variation law of COF affected by normal load was examined. Except the friction analysis, the wear behaviour of carbon tow and filaments in the case of tow/reed dent friction were also examined by video microscope and SEM characterization.
Experiment
Materials and equipment
This study was carried out on 6 K carbon yarn (M55JB) manufactured by Toray. That means there are 6000 filaments of carbon per yarn section. The average filament diameter was measured at 5 µm, and its elastic modulus was 540 GPa. The employed reed dent obtained from the reed manufactured by Huihe reed co. LTD, which was made by 430 stainless steel, the surface roughness (Ra) was 0.26 µm, the elastic modulus was 210 GPa.
Unsaturated resin (UPR) LSP-8060B was used for carbon fiber cross-section sample preparation, which was purchased from Sino Composite co. LTD.
Friction measurements were performed by means of a UMT-TriboLab tribometer (Bruker Nano, Inc, Campbell CA, USA), the reciprocating motion mode and the sensor with range of 0-20 N were employed to carry out tests in this paper.
A new experimental device was developed for this friction test, as revealed in Figure 2. The main-body of this device was fabricated by 3 D printer (Raise 3 D N2, Inc, Shanghai, China). The detailed view of the upper test tool and lower sample carrier were shown in Figure 2(b) and (c). As can be seen in Figure 2(b), the upper test tool was a reed dent studded into the plastic carrier which was fixed onto the holder. The lower sample carrier, as shown in Figure 2(c), was designed to fix the carbon tow under a certain tension. Some ceramic and metal components such as slotted ceramic eyelets, nuts and sheet metals were studded or adhered onto the carrier. During sample fixation, two ends of the tow was hand screwed under a pre-tension. The screwed part of carbon tow was protected by plastic tube. The length between the two slotted ceramic eyelets was 35 mm.

(a) Photograph of experimental rig mounted on friction tester. (b) Upper test tool. (c) Lower sample carrier.
Frictional experiment
Figure 3 is a schematic about the reciprocating motion of the reed dent and carbon tow during the friction test. As can be seen from Figure 3, the grey rectangle represents reed dent, and the black rectangle represents carbon tow. During the friction test, the reed dent keeps still, tow moves forward and backward. The contact area (S) between carbon tow and reed dent is 4 mm. Friction force (F) is generated by the reciprocating motion. The force keeping carbon tows and the reed dent touching is normal load (Ntow).

Measurement configuration with the reciprocating movement between carbon tow and reed dent.
All experiments were done at the condition of 20 ± 2° temperature and 57 ± 3% relative humanity (RH).The specification of the investigated yarn was 6 K, according to the actual ordinary warp yarn tension on the 3 D weaving loom (0.5-0.9 N), a pretension of 0.7 N was applied on the discussed tow samples. The normal load was a parameter set at the beginning of one experiment and was recorded during the test. In the case of tow/reed dent friction experiments, the range of normal load was determined in terms of the extrusion force between carbon tows and reed dents in the warp count of 4 to 8 yarns per centimeter. Therefore, the normal load within the range from 250 to 600 mN was estimated. As for the different thickness of 3 D weaving fabric, the weaving speed was usually from 1 to 5 beatings per second. Therefore, the average frequency 3 Hz was selected for tests. Based on the angle is near 90 degrees between warp yarn and reed dent in the actual weaving process, the device leads to a friction happened between the carbon tow and upper reed dent with 90 degrees. The warp yarns subjected to weaving cycles during the time need to cross about 80 mm from the starting position of beating to the fabric, as the ‘friction area’ revealed in Figure 1(a). The reciprocate movement distance is 4 mm/cycle, which corresponds to about 640 cycles for a standard woven fabric with 4 weft yarns per centimeter.
Based on the working condition of the loom, the selected experimental parameters of tension is 0.7 N, friction frequency is 3 Hz, friction angle is 90 °C and cycles are 640. These parameters are constant in all experiments. The selected normal loads during the friction test are summarized in Table 1.
The friction samples with different normal loads.

Carbon tow cross-sectional characterization
The carbon tow cross-sectional characterization was employed to obtain the true number of filaments in contact between the carbon tow and the reed dent. An experimental device was developed to prepare the tow cross-section samples under different normal loads. As shown in Figure 4(a), the device was composed of two slide brackets, a resin bath carrier and a loading carrier adhered with reed dent. The carbon tow was fixed by the lower sample carrier, which was illustrated in Figure 2(c). The cross-section sample was accomplished by four steps: step-1, lifting the resin bath carrier filled with UPR until the upper edge of resin bath carrier contact with carbon tow; step-2, adding the weight on the loading carrier until come up to the designed normal load, then the carbon tow was pressed into the resin bath; step-3, after the resin was completely cured, separating the reed dent from weight carrier, as illustrated in Figure 4(b); step-4, after cutting the sample along the fiber cross-section and polishing the surface, then the cross-section sample was prepared for metallographic microscope observation, as shown in Figure 4(c). The profile of carbon tow cross-section and the distribution of filaments in a tow were characterized by upright metallographic microscope (Leica DM2700M).

Schematic of carbon fiber cross-section sample preparation process.
Wear characterization of carbon tow and filament
The morphologies of the worn carbon tows were characterized by video microscope (VIXEN PC-230, Japan). The analysis method was based on the principle of optical hairiness introduced by Bueno et al [29]. This method consists of taking a sideview image of the tow samples fixed on the lower carrier (Figure 2(c)) after each friction test, as revealed in Figure 5(a).
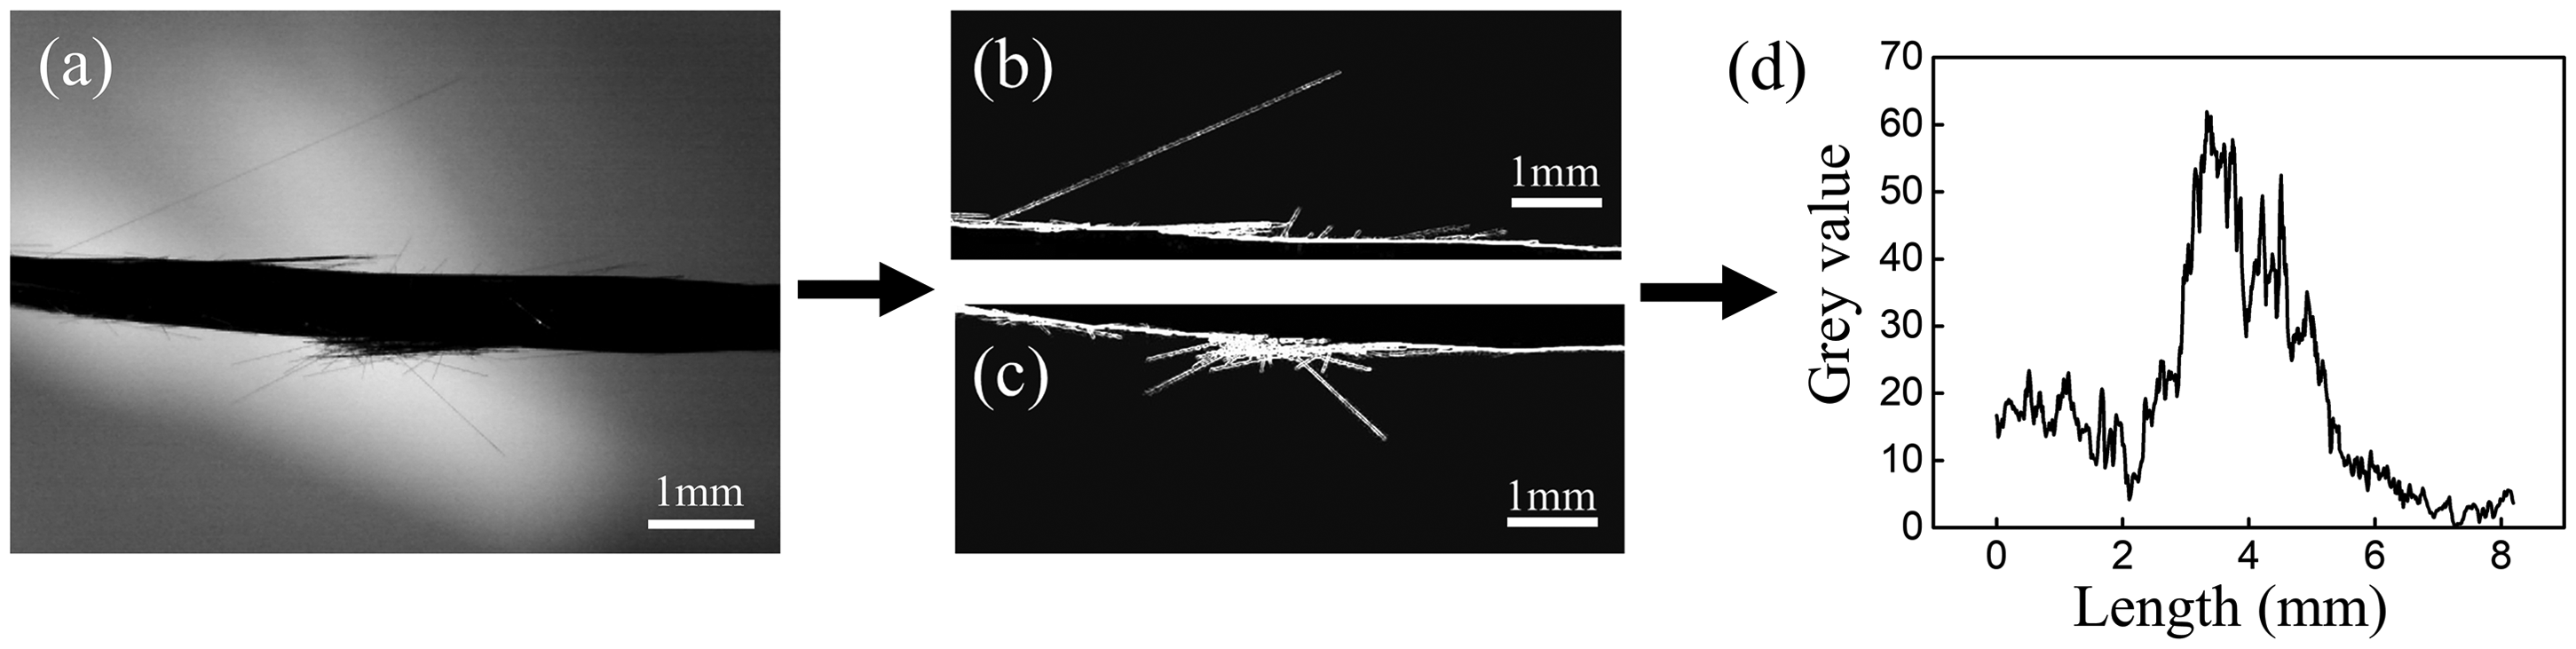
Schematic of statistical method for carbon tow hairiness. (a) Photograph of carbon after abrasion. (b, c) Software processed images. (d)Statistical graph of hairiness grey value.
An image processing was then applied to these pictures by ImageJ 1.46r software to highlight the hairiness of carbon tow (Figure 5(b) and (c)). It was then possible to obtain the grey value on selected zone which was linked to the number of broken fibers from carbon tow, as revealed in Figure 5(d).
The tensile strength of carbon tows before and after frictional process was tested according to ASTM D4018-99. This test was carried on universal Instron AG-250KNE manufactured by Shimadzu. The stretching speed was set to 2 mm/min. Five samples were tested and averaged for final results.
The damage patterns of filaments inside carbon tow after wear process were observed by scanning electron microscopy (SEM, Hitachi S4800).
Results and discussion
Correlation analysis of normal load, real contact area and friction force
Effect of normal load on friction force
Figure 6 plots friction force(F) versus normal load (Ntow). The trend of this graph shows the friction force increases with the increase of normal load from 250 to 600 mN. However, the friction force is not completely proportional to normal load. This finding is consistent with that of Howell and Mazur who obtained a clearer understanding of the F-Ntow relation, that is F = kNtown [13]. Therefore, F-Ntow curves could be fitted by power function. The mean values of the fitting coefficients k and n are based on the test results in Figure 6. The fitted k and n values are 0.148 ± 0.003 and 0.734 ± 0.029, respectively.

Friction force versus normal load for tow/reed dent contact.
The F-Ntow relation requires some explanation. Hence, we turn to the well-established adhesion theory of friction(F = Arτ) [22]. The shear strength τ is generally considered to be related to nature of material (i.e. a constant). Therefore, if adhesion theory of friction holds for carbon tows, the real contact area (Ar) between carbon tow and reed dent will determine the value of friction force (F). Thus, it is indispensable to study the variation law of Ar caused by the normal load.
The analysis of carbon tow cross-section
Figure 7(a) shows the cross-sectional profile of eight selected carbon tow samples with normal loads from 250 to 600 mN. The Horizontal and vertical longest distance of the cross-section are defined as the maximum contact width and maximum cross-section depth separately, which indicating the evolution of cross-sectional profile of carbon tows under different normal loads (Figure 7(b)). As shown in Figure 7(c), the maximum contact width increases along with the growth of normal load, while the maximum cross-section depth shows an opposite trend. Furthermore, normal load has no significant effect on cross-sectional area. This result may be explained by the fact that as the normal load increases, the filaments in the tow migrate from the middle of the cross-section to both sides, which leads to an increase in the number of filaments at the contact surface and a decrease in the number of filaments in the depth direction of the cross-section. At the same time, the normal load within 600 mN is not enough to affect the tightness between the filaments in a tow.

Analysis of cross-sectional profile dimensions of carbon tows. (a) Cross-sectional profile of carbon tows under different normal loads (250–600 mN). (b) Indicators showing variation of cross-sectional profile of carbon tows. (c) Evolution of cross-sectional area, maximum cross-section depth and contact width of carbon tows at different normal loads (these results are based on five repeat tests for each normal load).
In order to examine the distribution density of filaments inside different areas of carbon tow under compression force. Taking one of the M1 cross-sectional samples as an example, the sampling and statistical methods of the area occupied by filaments are shown in Figure 8(a) and (b). It can be seen from Figure 8(a) and (b), five equal size rectangular areas in a tow cross-section were selected for counting the number of filaments respectively. Figure 8(c) shows the average value of filaments coverage percentage acquired from different normal loads. It is evident from Figure 8(c) that the area percentage changes in the range of 35.5%–36%. which can be regarded that the average spaces between filaments are basically equal under the normal load range of 250–600 mN.
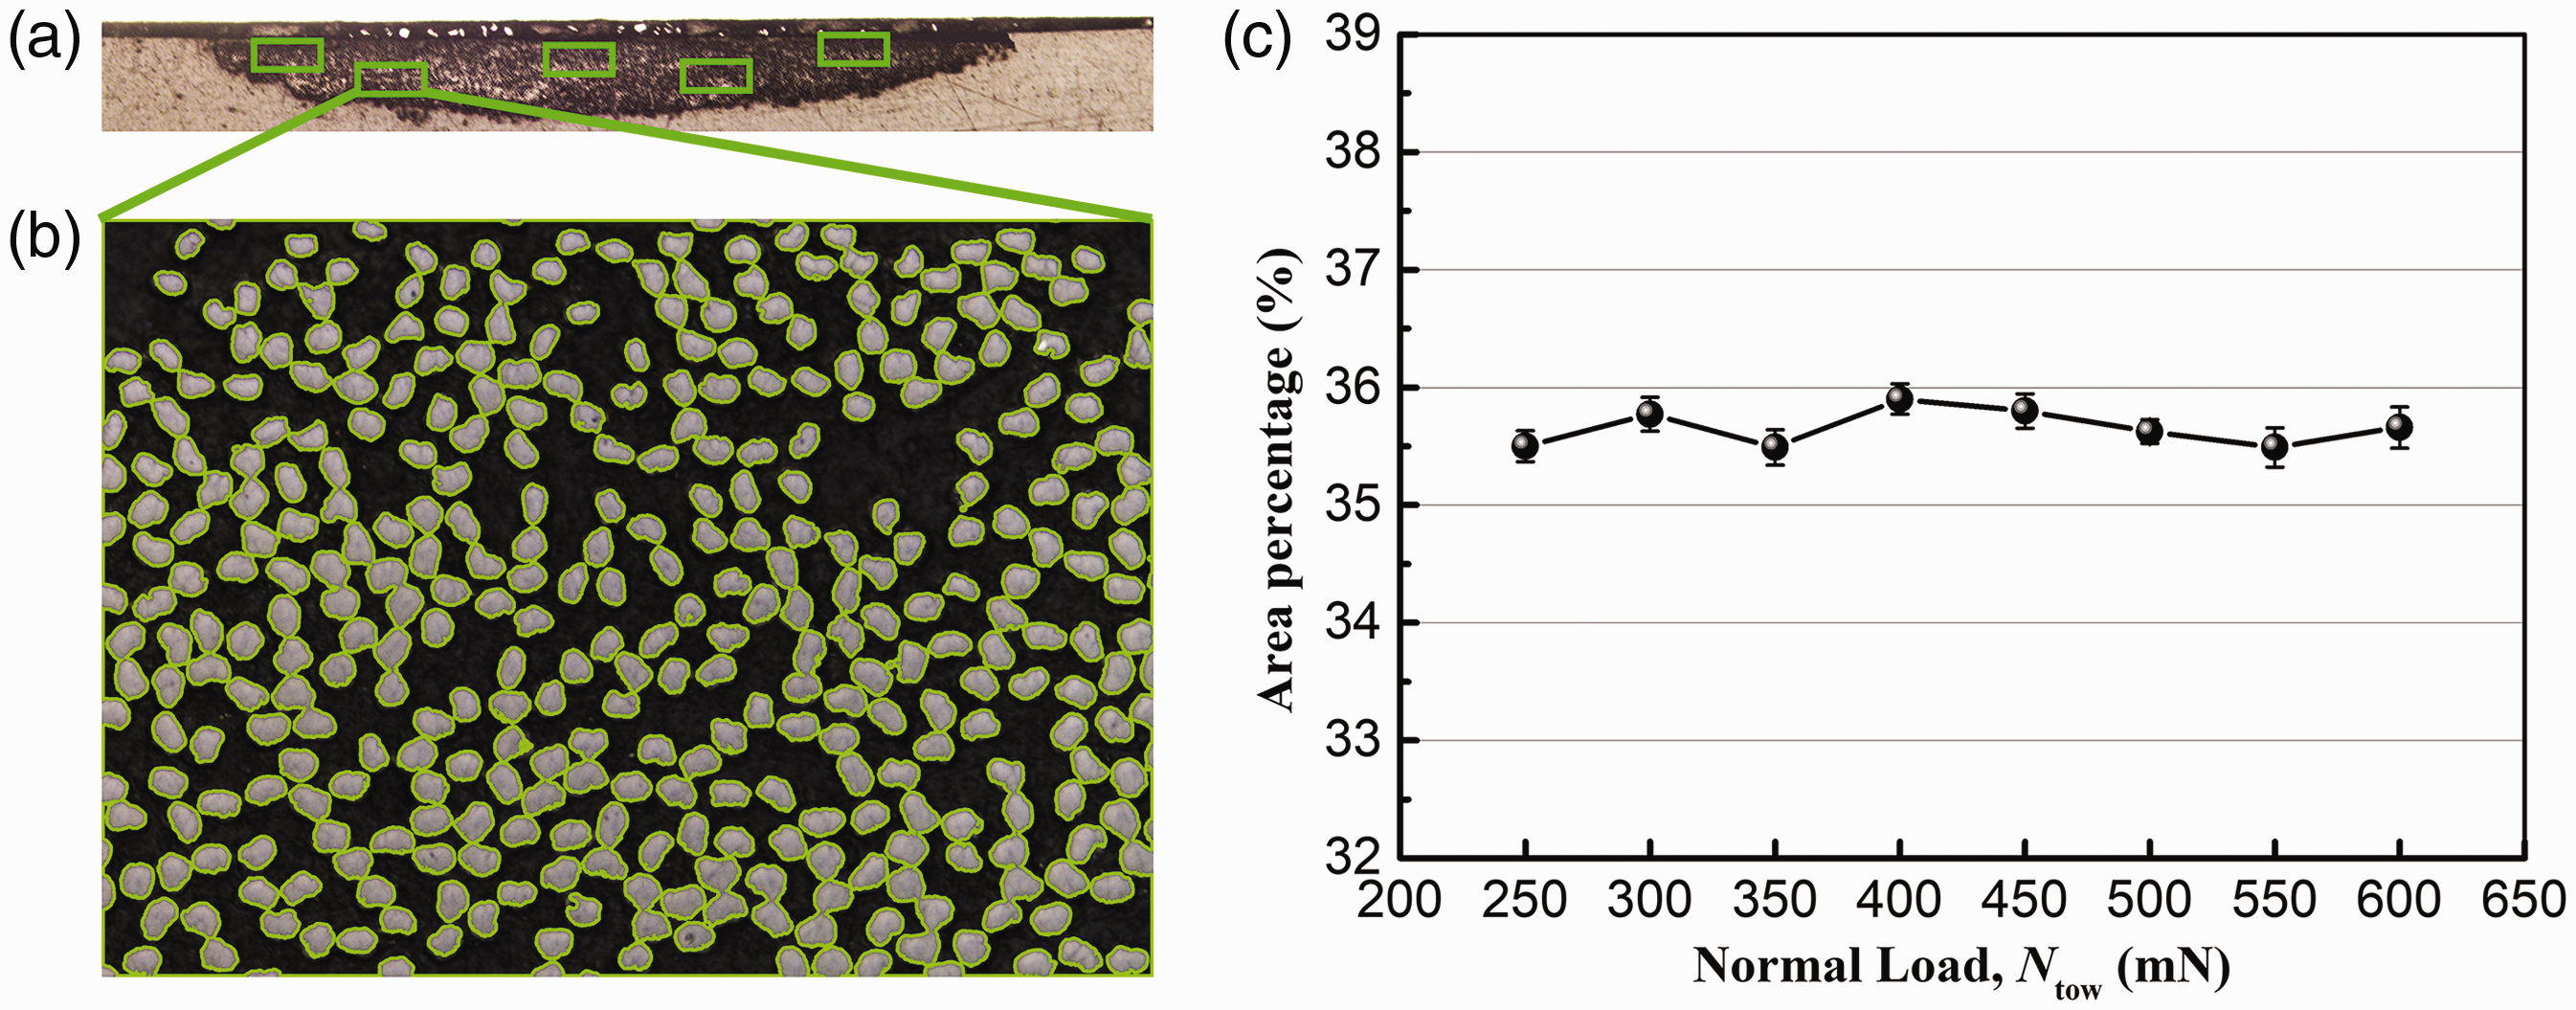
Distribution of filaments in the cross-section of carbon tow. (a, b) Metallographic microscope image of carbon tow cross-section. (c) Percentage of area occupied by filaments in the carbon tow cross-section.
The real contact area and friction force
From the geometrical analysis, if the maximum contact width of the carbon tow, the diameter of filament and the spacing between two filaments are known conditions, the number of filaments on the contact surface can be calculated. In this section, the contact area of single filament is calculated by using Hertz contact model. And then, the mathematical relationship between normal load and real contact area is established. On this basic, the real contact area between carbon tow and reed dent under different normal loads are calculated and discussed. The number of filaments directly contacting with the reed dent is defined as contact number 
The real contact area for individual filament/reed dent is estimated by Hertzian cylinder-on-flat contact model [30].
And
With
where a is the contact half-width, P0 is single filament contact stress, L is the width of reed dent (2 mm), ν1 is the Poisson's ratio of the carbon fiber (0.3), ν2 is the Poisson's ratio of the metal (0.3), E1 is the elastic modulus of carbon fiber(540 GPa), E2 is the elastic is the elastic modulus of the reed dent (210 GPa) and E* is the material equivalent elastic modulus (166.15 GPa).
Substituting Eq (4) into Eq (2):
Then
Substituting equation (5) into equation (6)
And
Substituting equation (7) into equation (8):
where Ai is the contact area between single filament and reed dent (unit is mm2), Ar is the real contact area between tow and reed dent (unit is mm2). Assuming filaments regular arrays on the top layer contact with the reed dent, the normal load on the stationary tow is transferred from upper layer to the lower one, as illustrated in Figure 9. The normal load on the individual filament inside tows then can be given as:

The schematic of Ntow distribution on filaments contacting with the reed dent counter-face (cross-sectional view of the tow).
where Ntow is the normal load acting upon the carbon tow (unit is mN), Nfil is the normal load acting on single filament (unit is mN), and ntow is the number of filaments inside carbon tows (6000 filaments per tow).
Substituting equation (10) into equation (9):
The real contact area-normal load curves (Ar–Ntow) calculated from constant idealized maximum contact width and evolving maximum contact width are compared in Figure 10. During the measurement of the cross-sectional parameters of the carbon tows, a total of five tows were tested. Select 8 positions on each tow to apply the normal loads in the range of 250∼600 mN, then preparing the cross section sample and counting the contact surface filaments for real contact area calculation. If we assume the idealized maximum contact width is independent on normal load acting on tows Ntow, then the contact number nfil remains constant and the real contact area Ar obtained is proportional to Ntow from equation (11) (dotted lines illustrated in Figure 10). However, if we include the evolving number of real contact filaments from Figure 7 in the calculations, the exponent n increases and the evolution of Ar values as shown by the solid curves in each graph of Figure 10.

Real contact area Ar versus normal load Ntow for carbon tow.
The coefficients are curve-fitted follow the Gupta and Mogahzy's structure model (Ar = kNtown) [24]. The mean values of k and n are respectively 0.00176 ± 5.5 × 10⁻⁵ and 0.73 ± 1.6 × 10⁻², which are calculated by the least squares fitting approach.
The averaged exponent of Ar–Ntow curves is very close to the mean exponent from F–Ntow curves. That means the only difference between F–Ntow and Ar–Ntow curves is depend on the constant factor. Therefore, the adhesion theory can be applied to calculate the friction force of carbon tow [20]. By multiplying the real contact area values in Figure 10 with a constant interface strength τ can get the predicted friction forces.
These τ value in each of the five tests separately are: 86.35, 83.3, 83.3, 83.95 and 82.99 Mpa, which reproducing a reasonable fit to the friction data. The averaged interface strength τ is 83.99 Mpa. Until now, the standard about interfacial shear strength τ of carbon tow has not been set. This can be seen in the case of previous literatures [19,31,32], whose value of τ is in range from 10 MPa to 100 MPa for carbon tows sliding against different counter-faces, so this τ value is within the reference range.
Figure 11 reveals both the measured friction force curves (i.e. F–Ntow) and the curves obtained from multiplying the real contact area Ar by a suitable constant τ (i.e. τAr–Ntow). Detail values of friction force from experimental test and τAr are analyzed by T-test. The value of P in each of five tests is 0.909,0.913,0.915,0.918,0.904, which are far more than 0.05. It means the difference between measured and calculated friction force is insignificant [33], which was expressed by almost overlap of their curves in Figure 11. Therefore, it can be concluded that under the contact conditions of this experiment, it is feasible to indirectly calculate the real contact area by cross-sectional analysis.
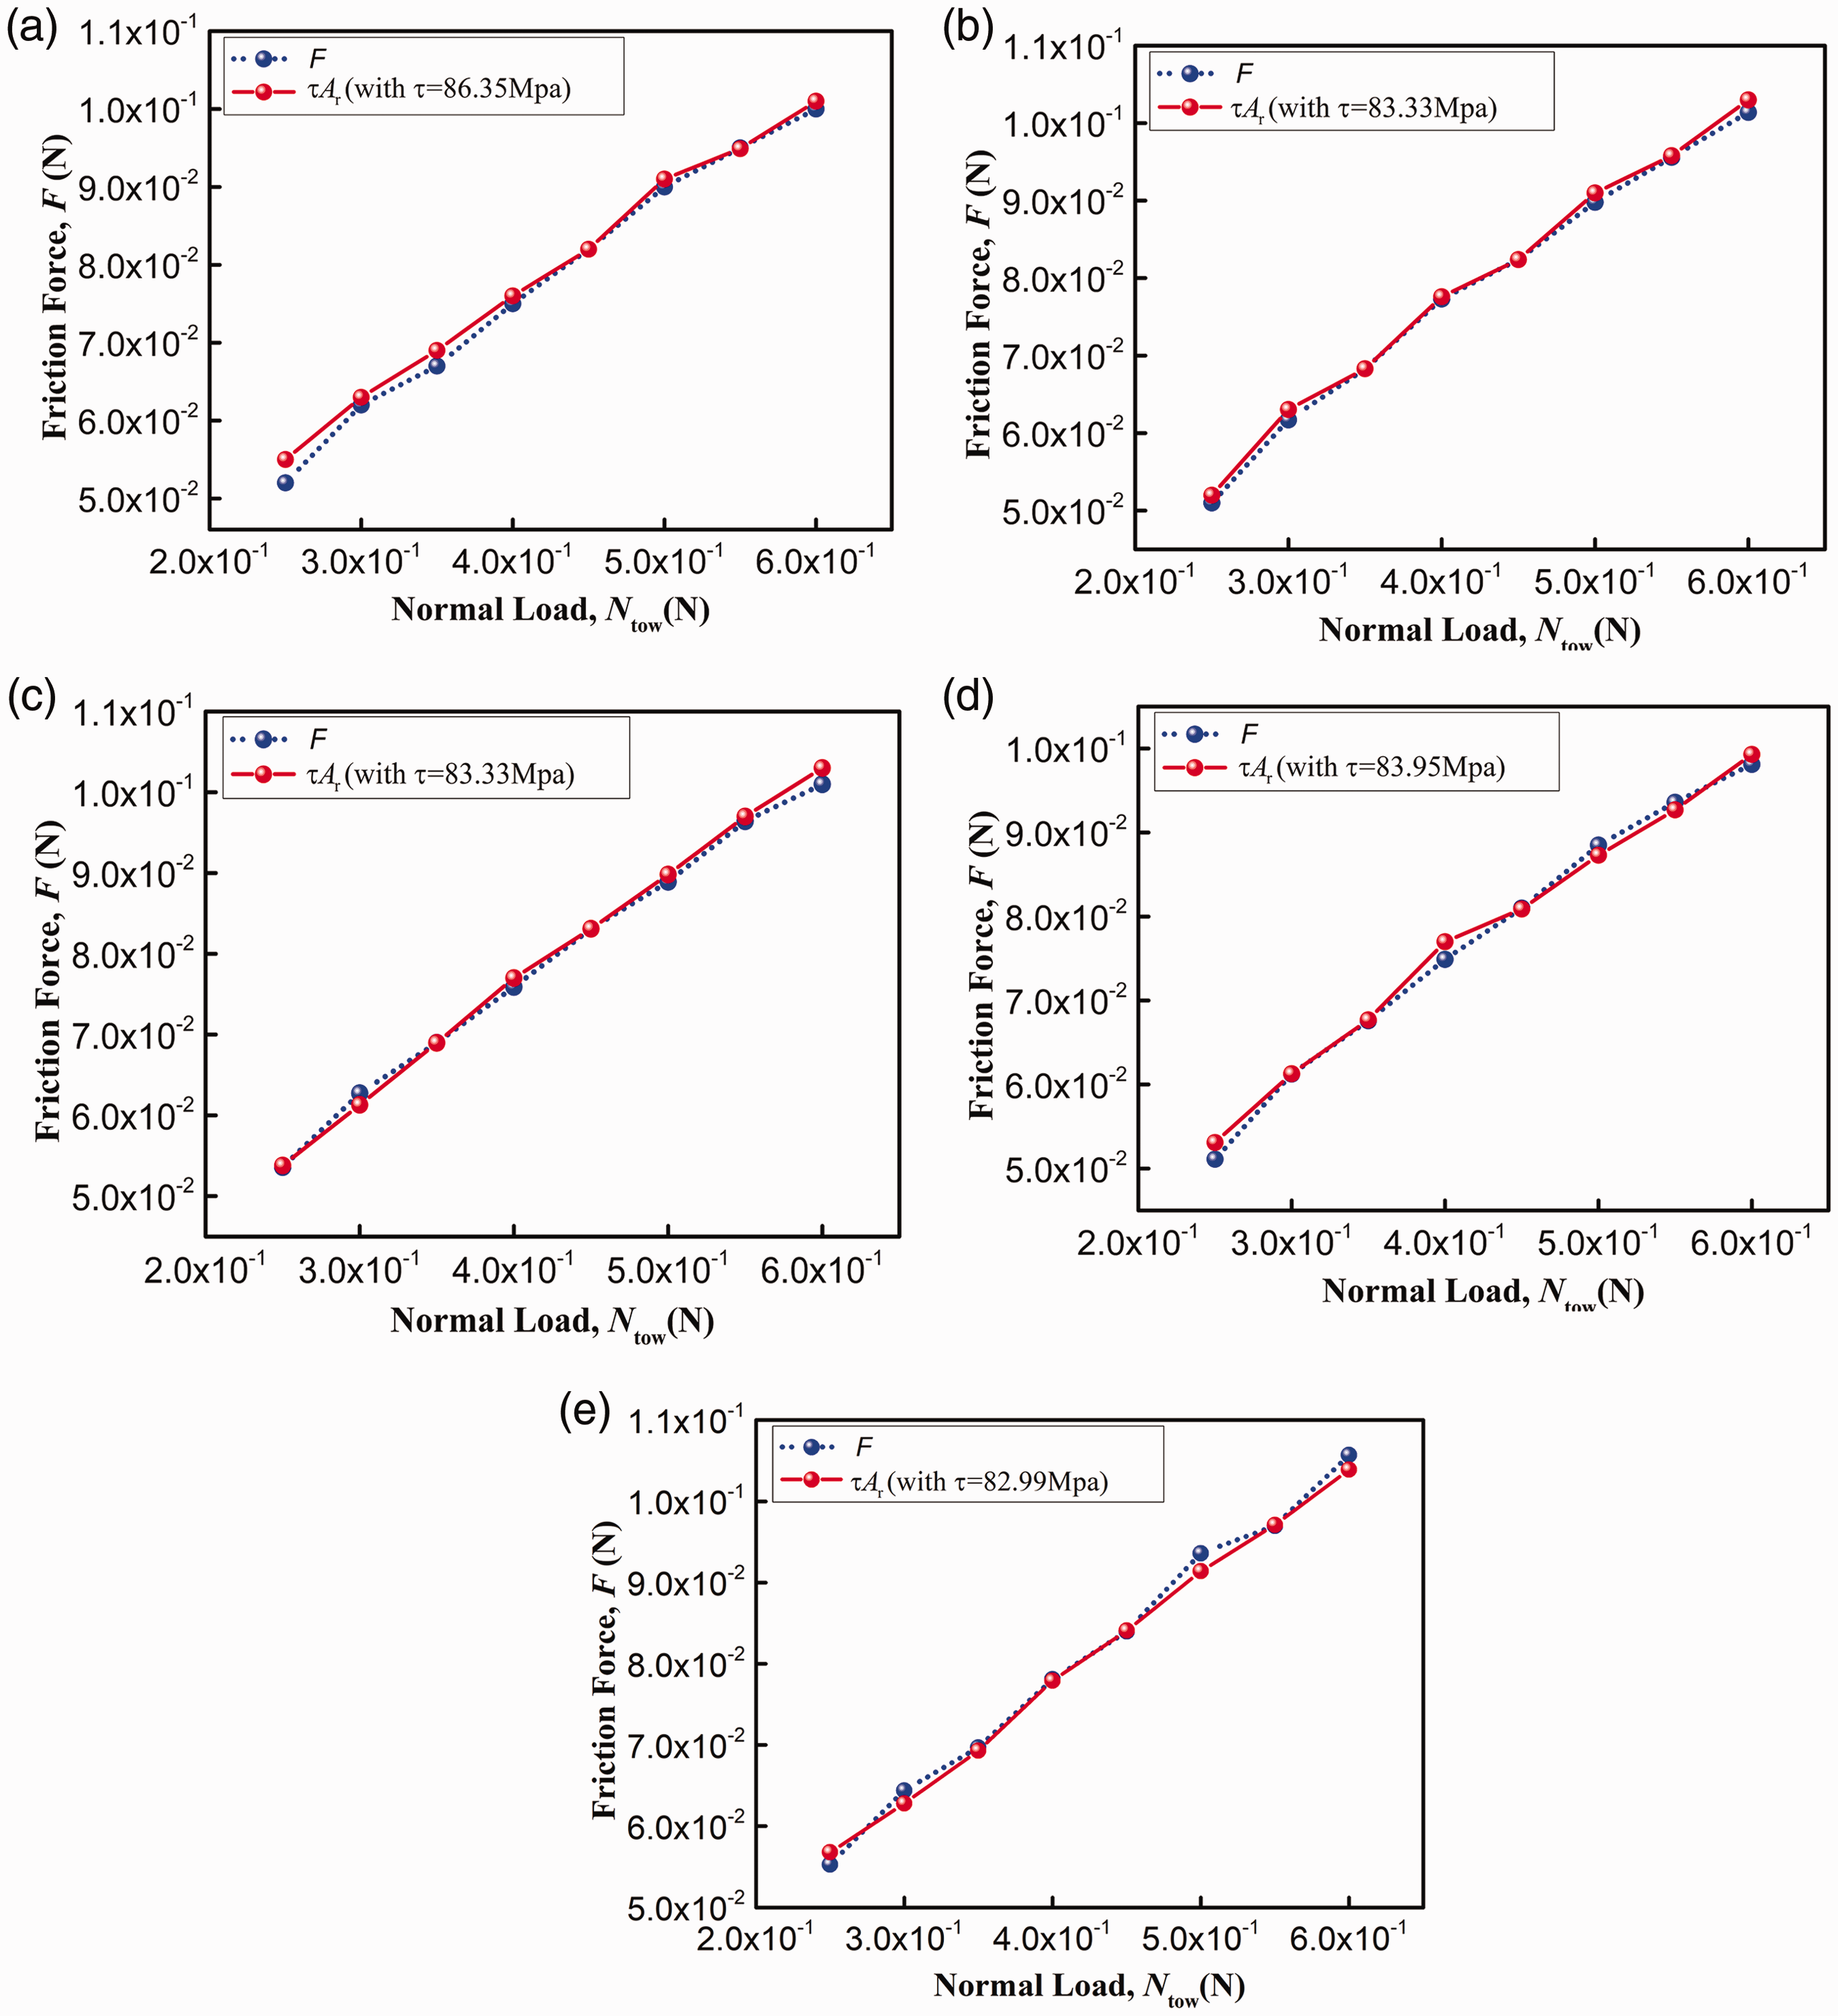
Measured friction force F versus normal load Ntow. Real contact area Ar (from Figure 8, based on maximum contact width) times a suitable shear strength τ yields a curve which closely overlays the measured friction force F. Figures (a-e) show the five repeat tests on carbon tows (a new tow specimen was used for each test).
Evolution of friction coefficient
Figure 12(a) illustrates the evolution of the COF for one cycle test at the normal load of 250 mN, 400 mN and 600 mN. It can be seen from Figure 12(a) that the COF increases as the normal load increase, an obvious fluctuation of COF appears at both ends of the three curves. This fluctuation is caused by the momentary pause of the tow in changing the direction of motion, which results in a sharp drop of COF. In addition, it is interesting to note from Figure 12(a) that the evolution of the COF forms the quasi-symmetric cycle. That means the COF of tow is basically consistent in both directions of the round trip, which proves the friction test has good repeatability. Figure 12(b) shows the evolution of COF value with the normal load of 250,400 and 600 mN from 0 to 640 cycles. It is evident from Figure 12(b) that the average value of COF rises with the increase of normal load. This outcome is contrary to some previous studies [20,34], which shows the COF value decreases with the increase of normal load. There are several possible explanations for these two opposite trends. As the research of Mulvihill et al. [20], for example, the plate-friction experiment conducted by Mulvihill et al. on tow/tool restrains both upper and lower filaments inside carbon tows, which improves the parallel of filaments inside tows and raise smoothness of tows as normal load increases. In the case of our test, the reed dent only contacts with the upper surface of the suspended carbon tows, as shown in Figure 2(a). It is evident from Figure 7 that the increase of normal load leads to the growth of real contact number of filaments. Meanwhile, it nearly could not change the filaments distribution density, as revealed in Figure 8(c). This means the increase of real contact area almost do not change the contact surface smoothness. Therefore, it can be concluded that the increase in COF value is attributed to the growth of real contact area. In addition to this, an upward sloping trend appears in the COF curve under the normal load of 600 mN near 485 cycles, as the zoomed image illustrated in the red square of Figure 12(b). A possible explanation of this trend may be a large amount of hairiness generated in this area which causes the increase of the contact surface roughness [35].

(a) Evolution of the COF for one cycle friction test and (b) 640 cycles friction test at the normal load of 250 mN, 400 mN and 600 mN, respectively (In the Figure 12(b), each set of samples is measured five times and averaged, and the darkest curve represents the average).
Wear behaviour of carbon fiber
The hairiness and tensile performance of carbon tow after wear
Figure 13 compares the wear of carbon tows under different normal loads. It is evident from Figure 13 that an increase in normal load not only leads more filaments breakage but also causes a disorder of the fractured filaments in orientation. Figure 14 illustrates the evolution results of carbon tow damage by using hairiness statistics and tensile performance analysis. Figure 14(a) shows the statistical curves of gray value of carbon tow hairiness under different normal loads. The average gray value obtained under 250, 400 and 600 mN are 3690, 22331 and 44581 respectively, the average value is calculated by testing five samples of each parameter. It is worth noting that at the case of 600 mN, the amount of hairiness in the non-friction area (–4∼–2 mm and 2∼4 mm) is more than that in the friction area (–2∼2 mm). It may be that broken fibers are pushed by reed dent to margin of tow during the reciprocating friction process. This phenomenon is similar with the accumulation of hairiness at the beating-up positions of warp and reed dent during 3 D weaving process (Figure 1).

Images of carbon tow damage observation after 640 cycles.

Carbon tow damage evaluation. (a) Grey value as function of length for hairiness at different normal loads. (b)The effect of normal loads on the tensile performance of carbon tows after friction. (c) Comparison of growth rate of hairiness and performance loss rate of the carbon tows.
Figure 14(b) compares the tensile breaking force of carbon tows after friction under different normal loads. As can be seen from Figure 14(b), compared with the undamaged carbon tow sample, the tensile loss rate of the worn carbon tows obtained under the normal loads of 250,400,600 mN is 6.3%, 23.2% and 42.4%, respectively. In order to investigate the correlation between the amount of carbon tow hairiness and the loss rate of tensile performance, a set of contrast curve was illustrated in Figure 14(c). It can be seen from Figure 14(c) that after friction, the growth rate of the hairiness and the loss rate of carbon tow tensile performance are similar. From this result, it can be verified that both of the two methods above are feasible in evaluating the degree of carbon tow wear.
The damage patterns of carbon filaments
The morphology of the damaged carbon filaments after friction was presented in Figure 15. As can be seen from Figure 15(a) and (b), many strips appear on the surface of the filaments. These strips are considered to be the sizing agent scratching filament surface. It may be caused by shear and friction stresses between carbon filament and reed dent [36].

SEM pictures of the damaged carbon filaments after friction tests.
From Figure 15(c) and (d), we can see some shallow and deep cracks perpendicular to the filament axis appear on the filament surface. This finding is consistent with that of Ansell [37] who agreed the shear strength should be responsible for the occurrence of these cracks, and macro-cracks starting from micro-cracks tended to cause the complete breakage of filament due to repeated stress.
Figure 15(e) shows a typical brittle fracture morphology, which is also reported in the Ref. 26. A V-notch breakage model shown in Figure 15(f) is a typical result of tensile failure. The tensile on the filament causes plastic yielding. Then, it leads the initial flaw to appear. When initial flaw has grown to a critical size, V-notch occurs over the remaining cross-section [38].
As can be seen from Figure 15(g) that the filament fracture resembles a mushroom. This phenomenon occurs mostly in the fracture of organic filaments. Once organic filaments rupture under enough heat softened fracture, then collapsing into the mushroom cap [39,40].
Conclusions
In this investigation, the aim was to understanding the carbon tow friction phenomena that occurs in the beating-up stage during the 3 D weaving process. An experimental simulation device was developed to reproduce this reciprocating friction between carbon tow and reed dent.
The effect of normal load on this tow-on-tool friction and wear behaviour has been investigated. The friction force F versus normal load Ntow curves followed power law descriptions (F = kNtow n ), F being proportional to Ntow0.734 for the investigated carbon tow. The real contact area could not be measured directly, but was calculated by combining the statistics on the number of contact surface filaments and Hertzian cylinder-on-flat contact model. In the real contact area equation (Ar = kNtow n ), the mean value of the exponent n is 0.73 which agrees closely with the mean exponent from the measured F–Ntow curves (approximately 0.734). The numerical verification results of F-Ntow curves show that the calculation method of the real contact area proposed in this paper is reasonable.
The COF increases with the increase of normal loads. As the normal load come up to 600 mN, fiber damage causes a sudden increase in the coefficient of friction near 485 cycles. The increase of normal load enhances the wear of carbon tow. Under the normal loads of 250,400,600 mN, the tensile loss rate of the carbon tow was 6.3%, 23.2% and 42.4%, respectively. The complex forces of the friction process cause the filaments to produce multiple damage patterns.
Footnotes
Acknowledgements
We gratefully acknowledge the assistance of Leica Microsystems technical support in characterizing the cross section of carbon tow.
Declaration of conflicting interests
The author(s) declared no potential conflicts of interest with respect to the research, authorship, and/or publication of this article.
Funding
The author(s) disclosed receipt of the following financial support for the research, authorship, and/or publication of this article: This work was supported by the Key Scientific Research Projects of Tianjin Education Commission (No. 2019ZD03), Major Science and Technology Projects in Shanxi Province (20181102022), Tianjin Higher Education Innovative Team Training Program (TD13-5043).