
Abstract
The internal geometry of composite material is one of the most important factors that influence its performance and service life. A new approach is proposed for the prediction of internal geometry and tensile behavior of the 3 D (three dimensional) woven fabrics by creating the unit cell using mathematical coding. In many technical applications, textile materials are subjected to rates of loading or straining that may be much greater in magnitude than the regular household applications of these materials. The main aim of this study is to provide a generalized method for all the structures. By mathematical coding, unit cells of 3 D woven orthogonal, warp interlock and angle interlock structures have been created. The study then focuses on developing code to analyze the geometrical parameters of the fabric like fabric thickness, areal density, and fiber volume fraction. Then, the tensile behavior of the coded 3 D structures is studied in Ansys platform and the results are compared with experimental values for authentication of geometrical parameters as well as for tensile behavior. The results show that the mathematical coding approach is a more efficient modeling technique with an acceptable error percentage.
Introduction
3D Woven composites have gained attention and demand in the industry due to their unique properties like high strength to weight ratio, stiffness, and high fracture toughness. These unique characteristics make them highly tolerable to damage. These materials are used for impact applications and multi-directional load-bearing properties because of the advancements made in the technology of 3 D weaving. Some of the researchers in recent years in design and analysis explore the development of new modeling techniques for understanding the mechanical behavior property of 3 D woven preform and their composites [1–9].
There are several different forms in 3 D such as solid, hollow, profiled, aerodynamic, and many other modified architectures in each of these basic forms [10]. 3 D solid structures are commonly produced with three broad multilayer patterns as orthogonal, warp interlock, and angle interlock woven textiles [11]. In all these 3 D constructions, weave architecture plays important role in deciding the mechanical performance of the fabrics and composites produced from them [12,13]. Dash and Behera [10] investigated the behavior of the structure-property relationship of 3 D woven composites and found that these novel 3 D structures have superior knife penetration resistance, impact resistance, and dynamic mechanical behavior as compared to UD (uni-directional) and 2 D structures. Wang [14] investigated the mechanical properties, failure modes of 3 D textile composites affected by the fabric structures, and these composites were reinforced with 3 D woven fabric, 3 D braid, and 3 D woven fabric with twisted yarn. Lomov et al. [15] used the concept of minimum bending energy of the yarn to deduce a parameterized function that can model the yarn path and shape at an elementary level.
Some researchers [16] developed the composites from orthogonal fabric with enhanced auxeticity and found the impact energy absorption of the developed composites. Green composites were also developed using a novel 3 D woven preform and investigations were made for the mechanical performance by changing the weave pattern [17], optimization [18], and variation in Z-yarn binding [19]. Out-of-plane stress components can be controlled with regard to fatigue loading, thick fabric/laminate, impact load dynamic effects, and stress concentration by using 3 D woven structures [20]. Park and Park [21] performed impact damage analysis and investigated the residual strength of flax composite-based automobile bonnet. Chu et al. [22] produced and analyzed four layers 3 D warp interlock fabric. This research [23] presents the experimental investigation on the mechanical behavior of 3 D multilayer woven composite by the influence of interlocking patterns. Several researchers have done geometrical modeling of 3 D woven solid structures, hollow structures, and honeycomb structures for estimating the fiber volume fraction and areal density from their respective unit cell [24–27]. In all this research, the whole reinforcing fabric is described by the unit cell and the entire composite behavior is represented by the characteristics of the repeat unit.
The research area for the modeling of 3 D woven fabrics is subdivided into several domains, each structure has its difficulties and challenges – some of the challenges are already solved and also implemented in software, while some of the structures are still waiting for their solution. The coding of weave matrix for 3 D fabrics was proposed by Chen and Potiyaraj [28–31] which focused on technological issues like lifting plan, loom shedding, etc. Two programs were developed by Chen on the Microsoft Windows platform to implement the algorithms and models for orthogonal and angle interlock structures. These programs provide a user-friendly interface, but they cannot predict complex phenomena like tensile behavior. Chen [28] created a suite of CAD (Computer Aided Drawing) software at the University of Manchester which was based on the mathematical description and modeling for the prediction of different architectures of 3 D woven fabrics to support its design and manufacture. The CAD suite includes Hollow CAD, Weave Engineer, GeoModeller, Structra, and UniverWeave. Weave Engineer is used for the designing and manufacturing of 3 D solid fabrics. The Weave Engineer suite has various modules for orthogonal, angle-interlock, multi-layer, backed, and single layer fabrics and has been proven to be quite effective for basic analysis.
Scientists have made many attempts to mathematically model the tensile behavior of 3 D woven fabrics. The analytical modeling approach was developed by Davis J.M [32] developed to predict the stiffness of laminated composites of 3 D orthotropic structures. The results demonstrate that the Analytical model which is sufficient as well as computationally efficient gives an accurate prediction that can be compared with experimental data and some existing models. High computation power that comes with recent technological developments gives more promise for more advanced computer programs with pinpoint accuracy at a lower cost. This gave birth to more advanced Finite Element Modeling Techniques that yielded greater accuracy and reliability in predicting mechanical behavior. Researchers [33] used meso-finite element (FE) modeling to determine the conditions of damage initiation which stimulate the development of stress concentration sites that propagate and ultimately result in deterioration of the homogenized mechanical properties of the composite.
Modeling of the mechanical performance of the textile composites begins with the unit cell geometry of textile by using a special pre-processor such as Wise Tex [34,35] or Texgen [36,37]. Three attributes are required to build a model of the unit cell of textiles in Texgen which are namely yarn cross-sections, yarn paths, and yarn repeats with a domain. In this research paper [1] mechanical modeling of 3 D woven composites considered the unit cell geometry and python scripting was used to create the simulated geometry in the Texgen model by which FE models can be generated for the conversion of deformation model geometry. Texgen was used to characterize and modeling of the complex textile geometries [38]. Analysis of permeability, structure, and micro-mechanical property by the integration of the software wisetex which is a virtual textile composite software [35]. The generalized description of the internal structure of unit cell of textile reinforcement implemented by the software package WiseTex which was integrated with the mechanical models of the deformed and relaxed state of 3 D and 2 D woven [39–42], non-crimp warp knit [43] stitched fabrics and laminates [44], and two and three axial braided [45] structure. Numerical modeling was also carried out for the impact behavior of 3D woven solid structures [46] and compression behavior of 3D woven hollow composite structures [47] using FEM analysis. This research describes the different models which used a unified description of the geometry of unit cell reinforcement. This current research study tries to make use of this recent high end computing power and coding capabilities to explore and innovate new software programs that can be used as an accurate prediction tool for industrial manufacturing and testing of complex 3 D woven structures.
Materials and methods
Material and fabrication
3D fabrics have been produced from 600 tex of E- glass tow supplied by owens corning. The mechanical and physical property of E-Glass tow is given in Table 1.
Properties of E-glass tow.

All 3 D woven fabrics were produced on a modified weaving machine for comparing and validating the results obtained through mathematical coding. The modified weaving machine shown in Figure 1 is a customized rapier weaving machine. This machine is attached to four beam arrangement system with independent take-up and let-off mechanism for each warp beam. This machine is capable to release a particular length of fabric of appropriate tension and also has good synchronization between let-off and take-up mechanism. The machine has 24 heald shafts equipped with electronic dobby to produce a different variety of fabrics like multi-layer solid structure, spacer fabric, and honeycomb fabric with the help of an inbuilt CAD system. The new weaving loom was designed to produce various 3 D woven preform fabrics. Construction parameters for different fabrics are given in Table 2. The developed 3 D fabric samples namely orthogonal, warp interlock, and angle interlock are shown in Figure 2 with their peg plan and yarn architecture.

Customized 3 D weaving machine.
Construction parameters of different fabric.


3 D fabric samples images with their peg plan and yarn architecture in the cross-section (a) 3 D orthogonal (b) 3 D warp interlock (c) 3 D angle interlock (B: binder yarn, S: stuffer yarn).
Tensile testing method
Tensile testing was performed with Zwick/Roell universal testing machine using 50 kN load-cell according to ASTM-D 5035. Pneumatic grips were used in the UTM as this helped in maintaining air pressure even when the fabric underwent crimp. Both experimental and predicted results were then compared and the error percentage was calculated.
Development of 3 D woven orthogonal fabric
3D orthogonal woven preforms consist of three yarns such as warp, weft, and z-yarns. All these yarns are interlaced to form the 3 D structure. In these sets of yarns, warp yarns are longitudinal and others are orthogonal. Double picks were formed by inserting the filling yarns between the warp layers The z-yarns are used to bind the other sets of yarn and provide the structural integrity required to hold together this 3 D structure. The Unit cell of this structure has been modeled geometrically in Solidworks as shown in Figure 3. Mathematically, the unit cell has been modeled using html and javascript code. The 3.js (java script) library was used to create the 3 D structure.
3 D orthogonal fabric structure modeled in Solidworks.
Composites made of 3 D woven orthogonal structural fabric have high strength and stiffness in the in-plane direction because of less or no crimp in that direction both in warp and weft yarns.
Development of 3 D warp interlock fabrics
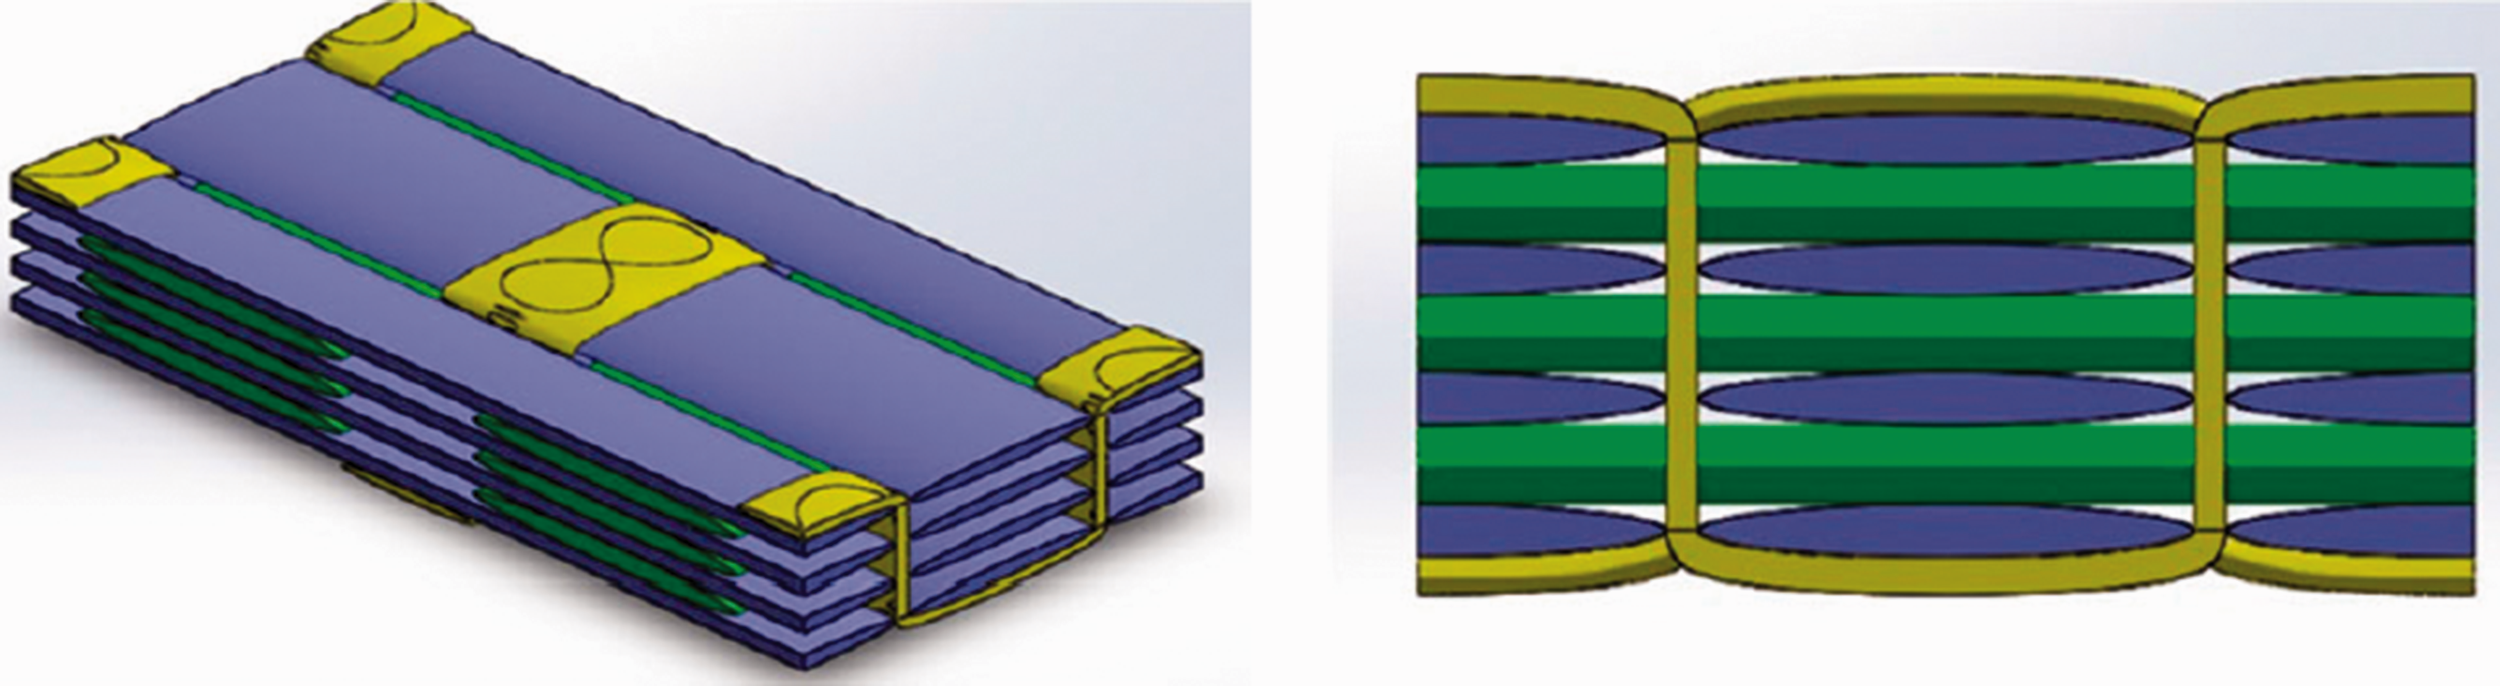
A 3 D Warp Interlock fabric is formed by the two sets of yarns (warp and weft) which were inserted perpendicularly. Three weaving steps are performed on a loom: the shed opening, the weft insertion, and the reed beating. Mathematically, the warp and weft yarns criss-cross in the XYZ 3 D plane. The first direction represents the evolution of weft yarn in a cross-section view of warp yarns. The second direction represents the evolution of warp yarn in a cross-section view of weft yarns. The third direction perpendicular to the woven structure represents the surface evolution of weft and warp yarns of the fabric pattern. The Unit Cell of 3 D Warp Interlock Fabric was modeled in Solidworks for better visualization of the structure before developing the mathematical model for the same and is shown in Figure 4.

3 D Warp Interlock fabric modeled in Solidworks.
The representation of the binding mode of weft and warp yarns can be geometrically represented by a woven pattern where Ci warp yarn represents each vertical column and Tj weft yarn represents each horizontal row. The interlacing position of a Ci warp yarn with respect to a Tj weft yarn is represented by Ii,j. Two positions are possible: The selection of the Ci warp yarn corresponded by up, in the upper position relative to the Tj weft yarn; the Ii,j cell of the pattern is geometrically full and numerically equal to 1. The selection of the Ci warp yarn corresponded by down, in the lower position relative to Tj weft yarn; the Ii,j cell of the pattern is geometrically empty and numerically equal to 0.
Development of 3 D angle interlock fabrics
Two layers of warp yarns run along the X direction crisscrossing the weft yarns. The weft yarns run along the Y direction. The binder warp yarn interlocks and wraps the weft yarns by following a path along the XZ plane. This detailed and complicated orientation of this 3 D Angle Interlock Unit Cell was modeled in Solidworks to provide better clarity through visual depiction (Figure 5). This unit cell repeats itself to form one thick preform. These thick preforms have been shown to exhibit enhanced shear and delamination resistance due to their interlaced construction. The improved shear and delamination resistance accounts for enhanced impact damage tolerance in operating conditions. The interlaced construction has also been shown to distribute heat equally in high heat generating frictional applications.

3 D Angle Interlock fabric modeled in Solidworks.
The weft yarns remain straight in the Y direction while the warp yarns interlace along with the thickness of the preform. The arrangement of weft is in the form of a grid manner and the warp yarns traverse at an angle around the several rows of weft. The warp yarns travel in a way to interlock the weft and keep it in place. The warp yarns are stacked parallel to each other. The path of individual warp yarns could be either through the thickness of the fabric or from layer to layer.
Microsoft Visual Studio is used to create a graphical structure that will be subject to further analysis and prediction. So the Python code was not used to generate the structure. The python code was only used for the prediction of tensile properties and other parameters for this structure. The fabric models as shown in Figures 3 to 5 were modeled in solid works for visualization purposes. Further, HTML coding was responsible for creating the nodal points in a virtual Euclidean coordinate system.
Development of code
A 3 D-woven textile structure can be coded by following an ordered sequence of operations which includes the development of weave topology using matrix coding of the weave and then determining the yarn paths, which is most complex for 3 D structures and then using them to build the geometrical model of the structure. The first step in the process is relatively easier as compared to the process of determining the yarn paths. In order to predict the internal geometry of the fabric correctly, it is important to analyze different fabric properties which include yarn crimp, compression, and bending behavior of the warp and weft yarns and also the spacing of the warp and weft yarns, which can be non-uniform. These input data will help us define the shape of the yarns with the help of mathematical equations which is a very crucial step and most of the errors in the formulation of the geometrical model of the structures correspond to this process. The topological coding of a multi-layered weave is based on the warp yarns paths.
A python code was developed to predict the various geometrical parameters of the structural model. The cross-sectional shape and aspect ratio(AR) of the filler, binder, and stuffer tows were incorporated into the model. A user interfaces as shown in Figure 6 have been created on Microsoft Visual Studio.

Main window of the software.
C# (C Sharp) was used to make the interface responsive to take in input parameters from the user interactively which is shown in Figure 7.
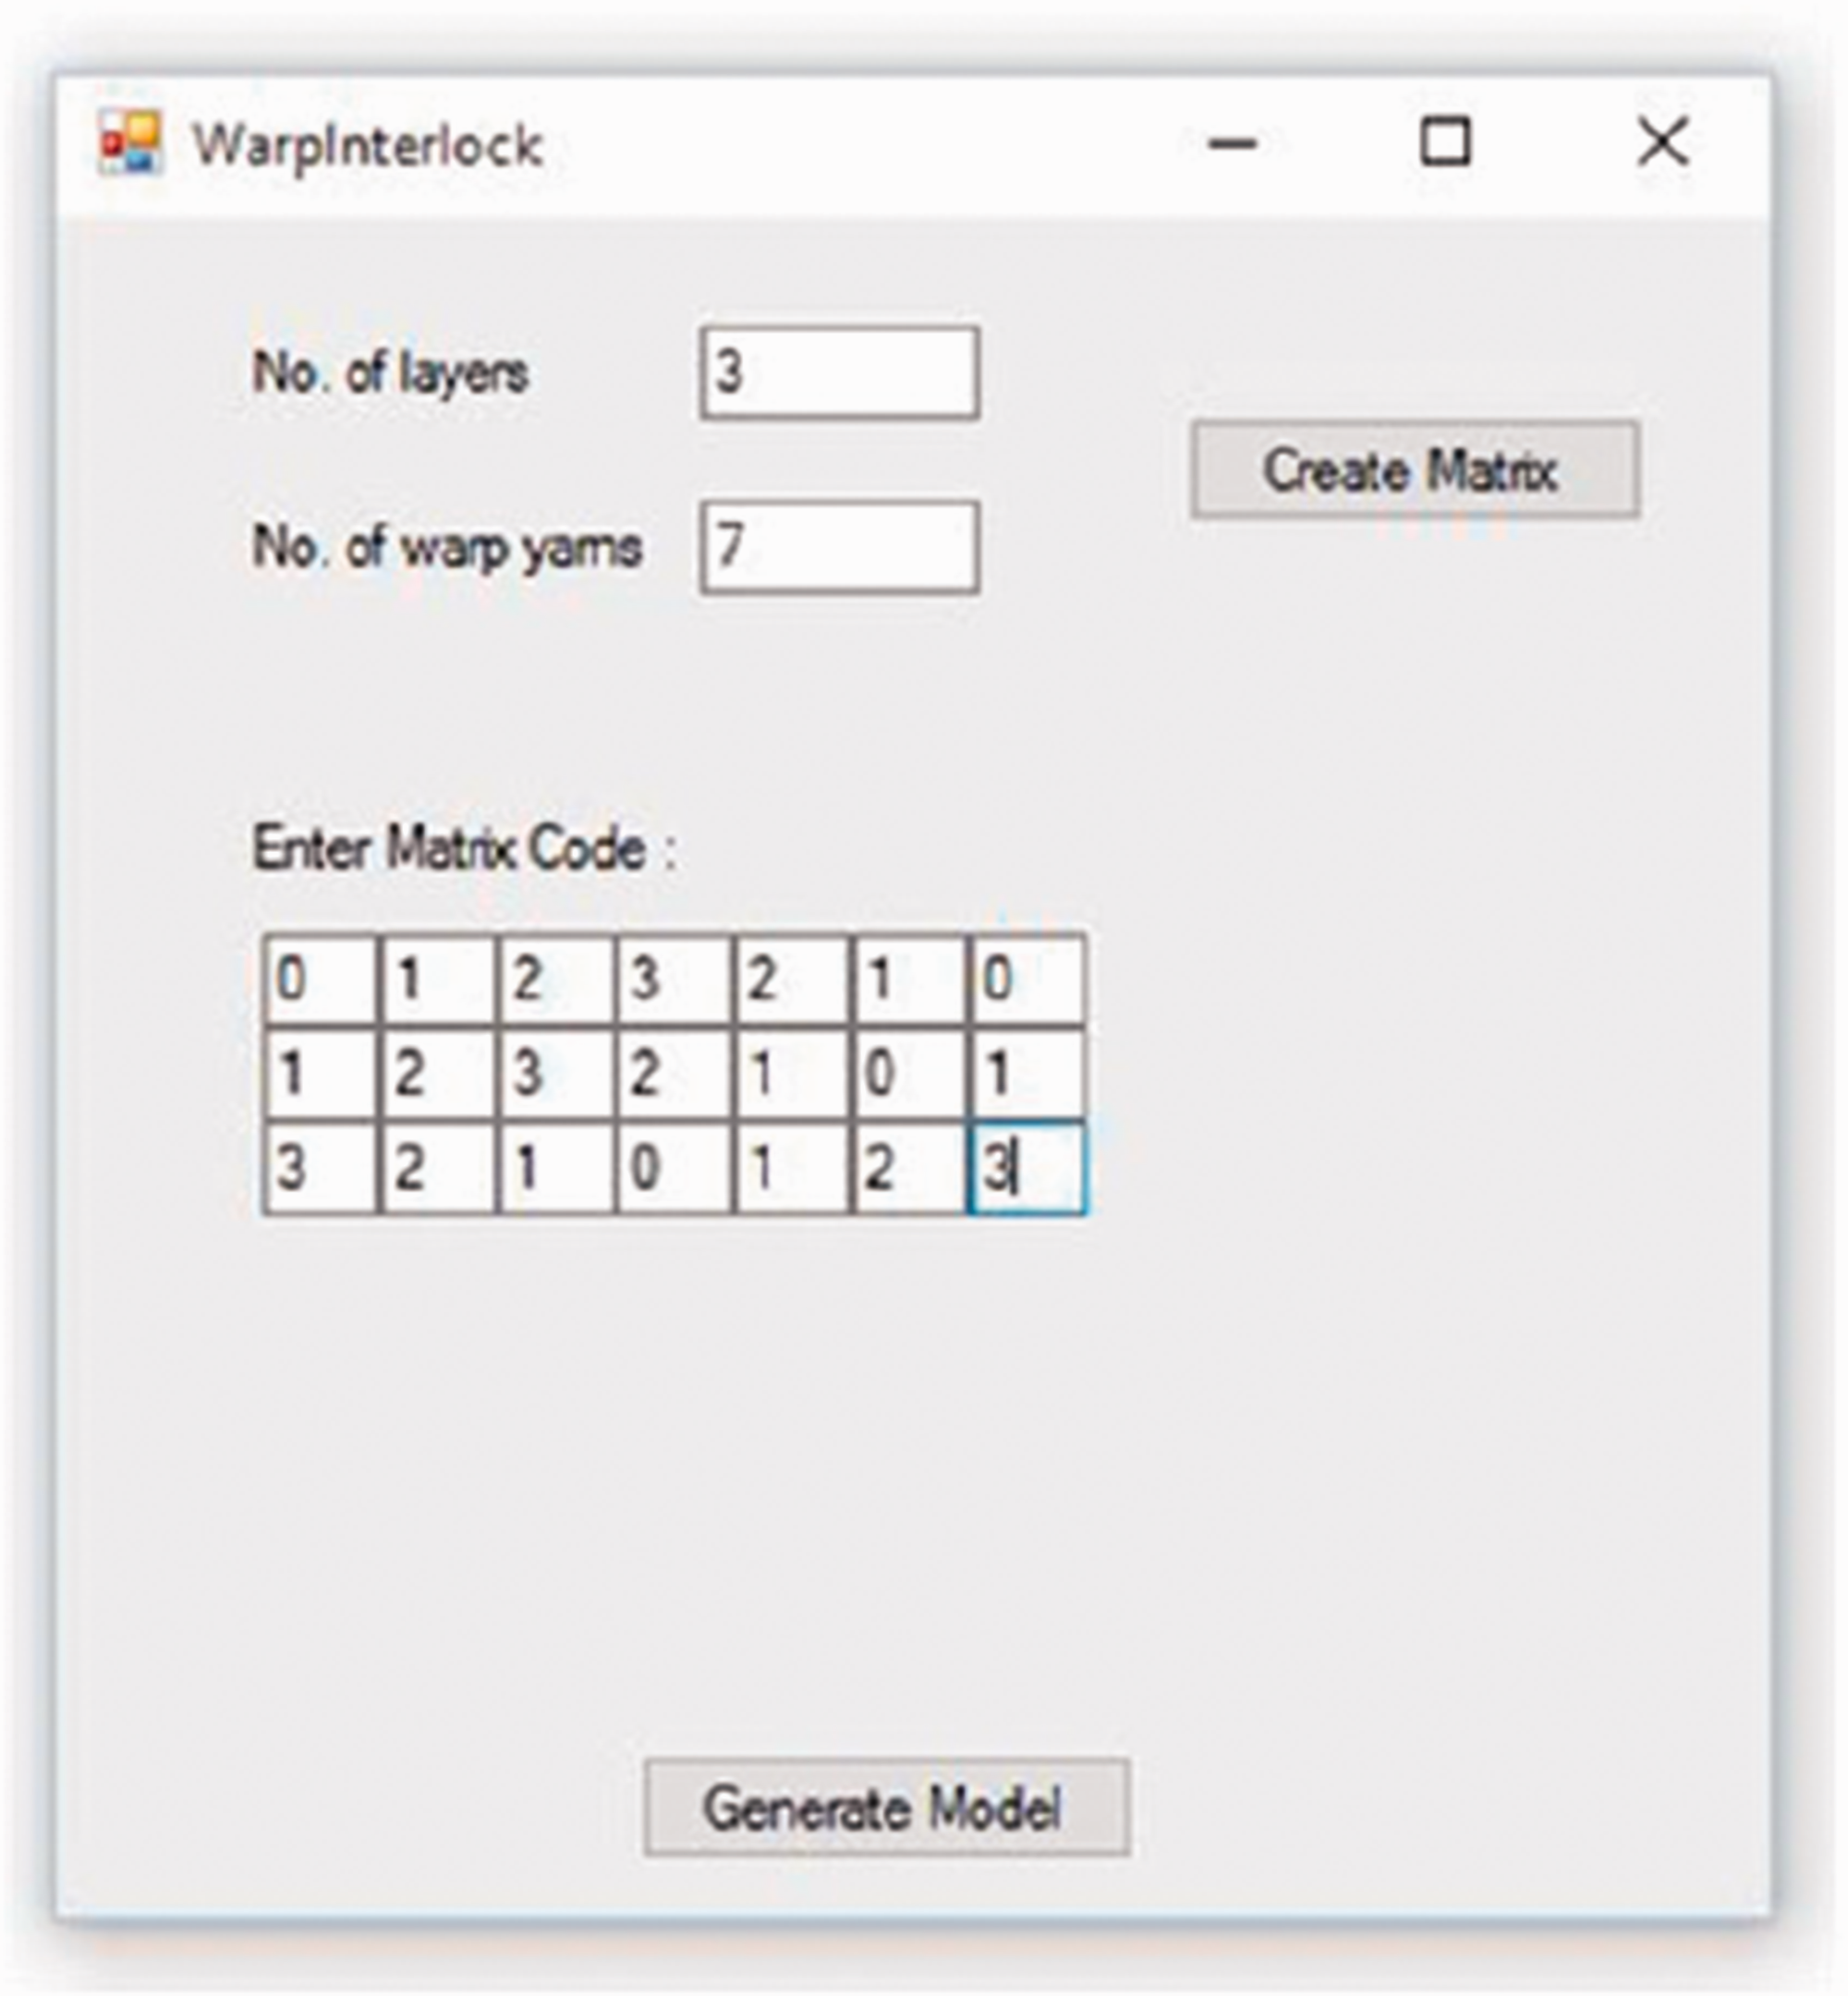
Input window of the software.
The C# console is used to establish and implement the correct sequence of equations to be computed for the accurate prediction of geometrical properties. The specifications for the theoretical prediction of tensile behavior is preprogrammed into the console to mimic the real life tensile test. The theoretical model also takes into account the dynamic air pressure gradient at the jaw interface through equations embedded in the console. The flowchart for the development of code is shown in Figure 8.

Flowchart showing the development of code.
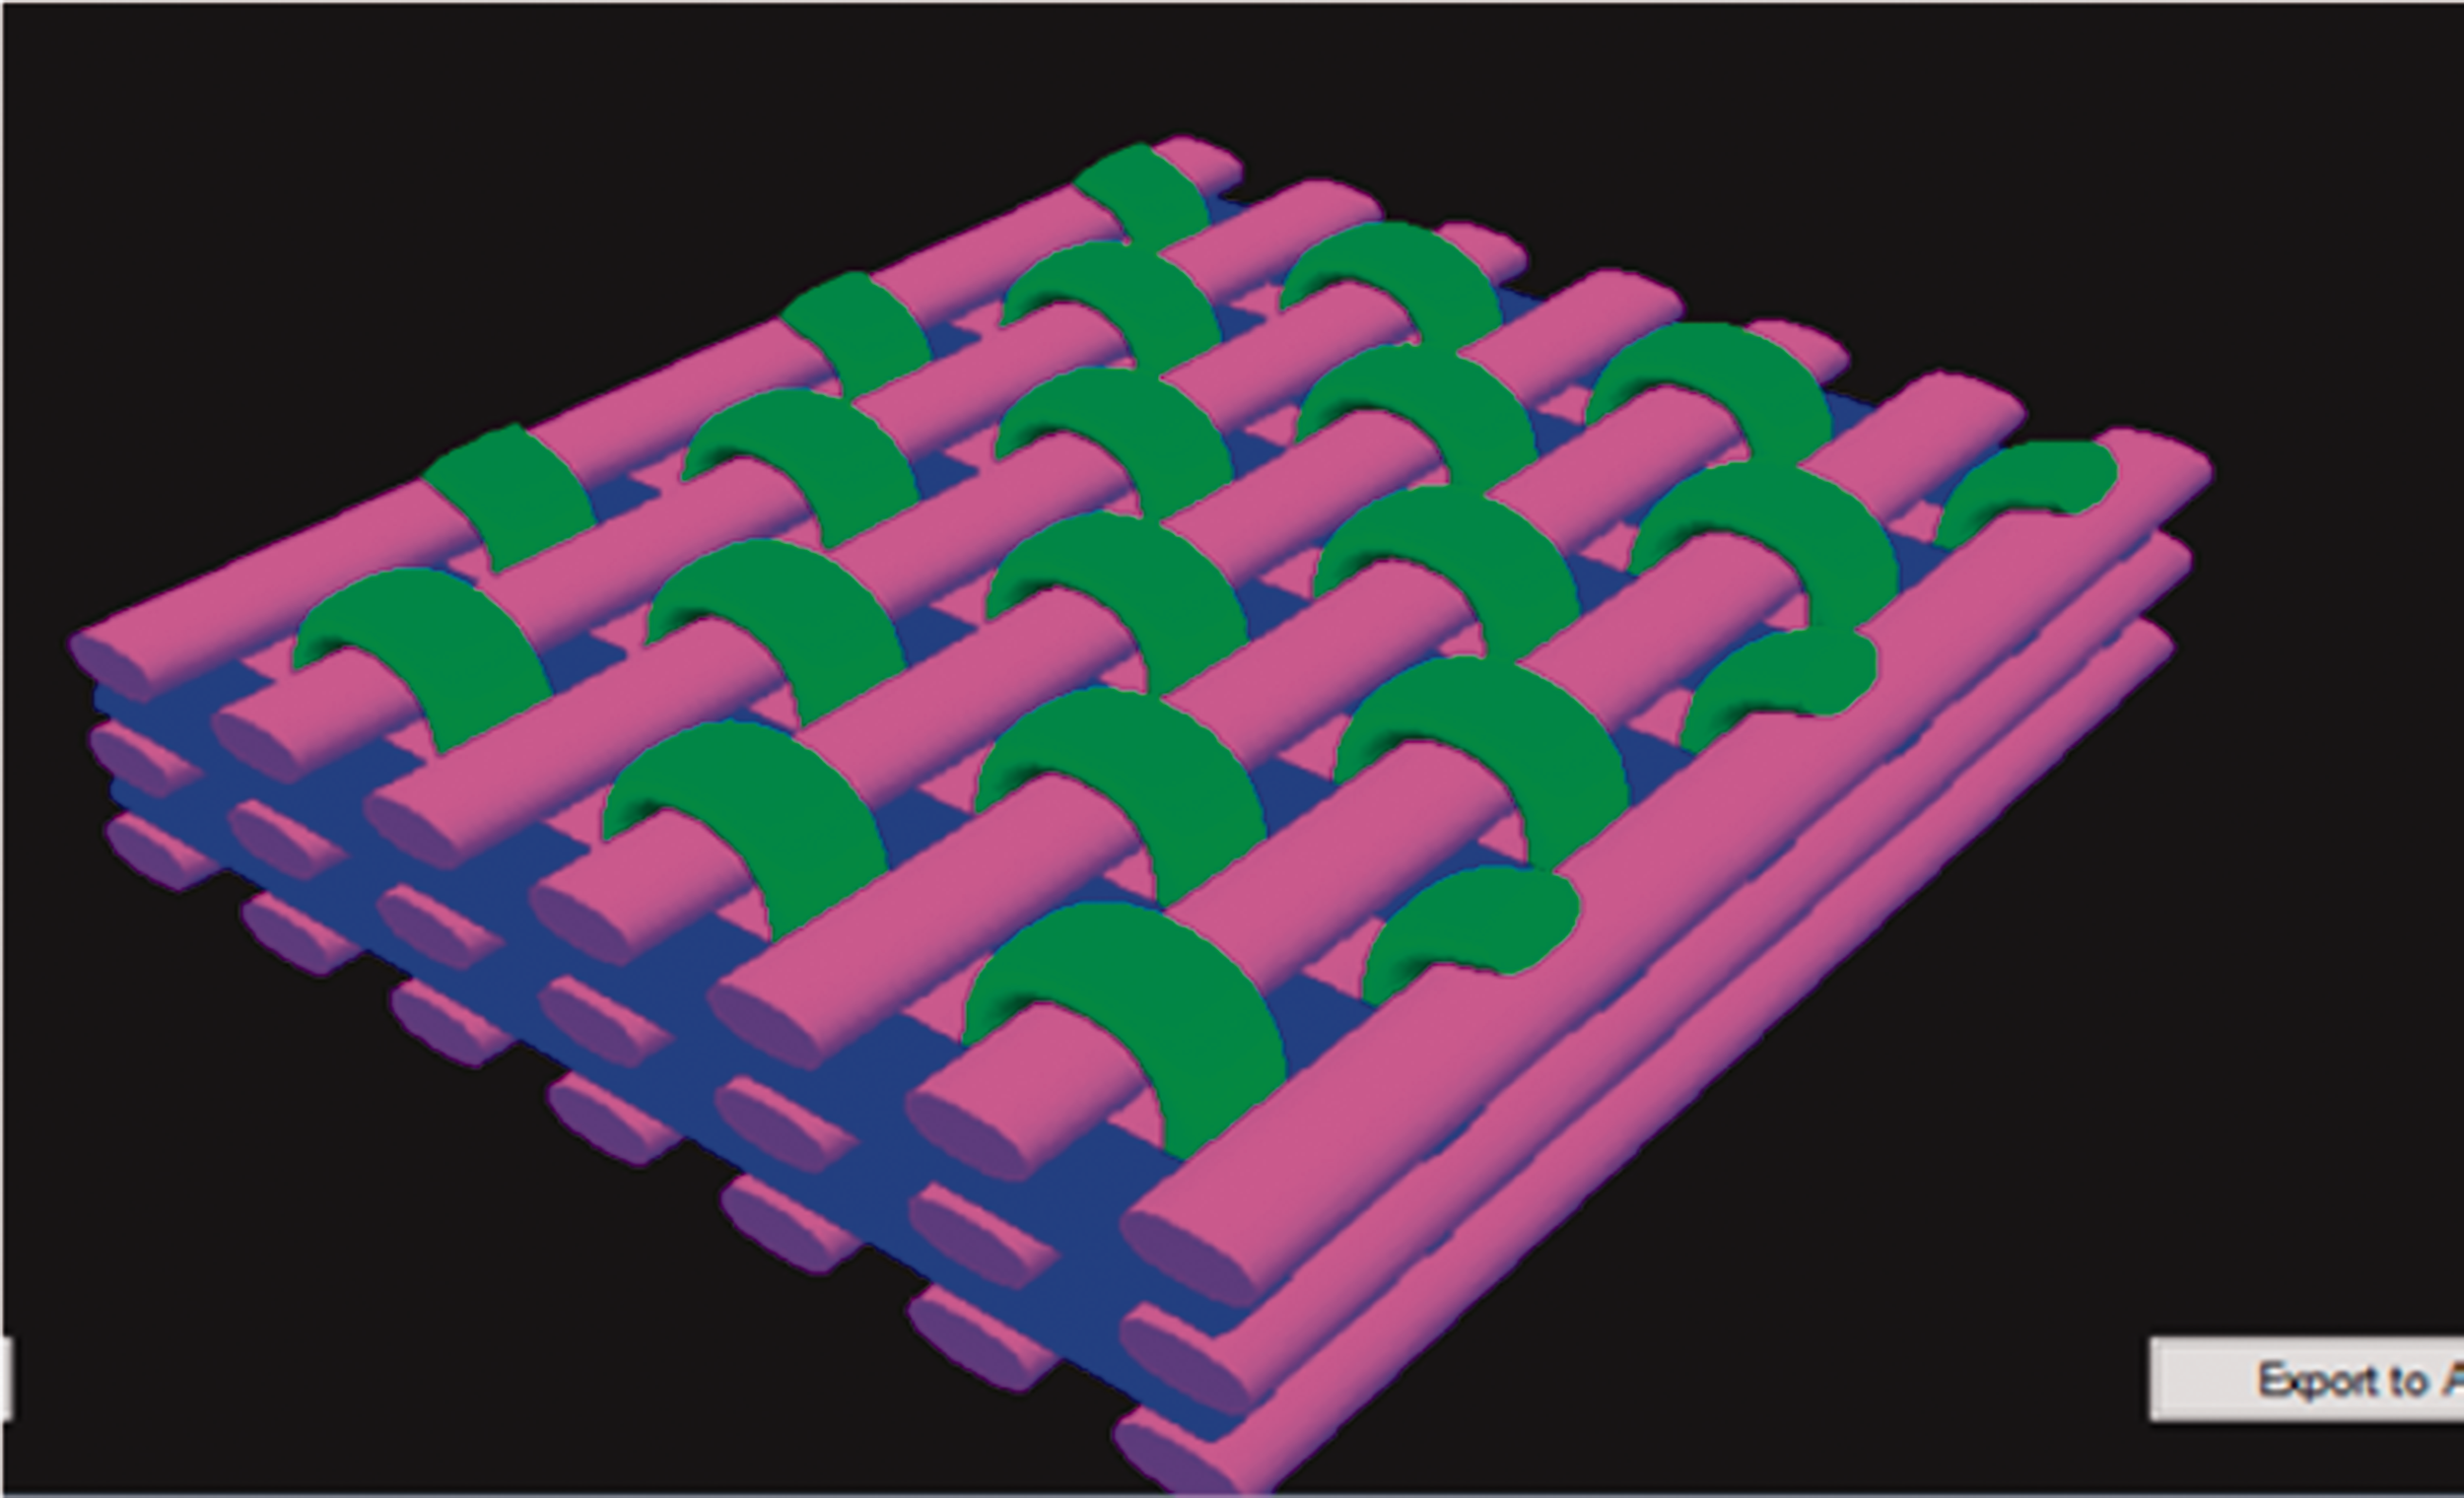
The computer program was written in Html and JavaScript (js) to create the unit cell. The code was used in three.js library to create the 3 D structures (Figures 9 to 11). Html coding is mainly responsible for creating the application while JavaScript coding gave the structure its final details.
Unit cell of 3 D orthogonal fabric.

Unit cell of 3 D Warp Interlock Fabric.

Unit cell of 3 D Angle Interlock Fabric.
Modeling approach
The mathematical model was developed by implementing equations into the Python code. The program has been developed to accept user-defined input variables from the user. The equations embedded into the algorithm then perform the calculations and gives output parameters as the result.
Input parameters
The following input parameters are user-defined and can be inputted into the program
μf, μs, μb Linear density of the filler stuffer, and binder tows (kg/m).
ρ Density of filler stuffer, and binder tows (kg/m3).
nucs Number of stuffer yarns along the direction of weft (Y) per unit cell.
nucf Number of filler yarns along the direction of warp (X) per unit cell.
nucb Number of binder yarns along the direction of weft (Y) per unit cell.
λf, λs, λb Number of fillers, stuffers, and binders per unit length perpendicular to tow direction (f/m, s/m, and b/m).
nf, ns, nb Number of filler, stuffer, and binder layers in the unit cell.
ARf, ARs, ARb Aspect ratio of filler, stuffer, and binder tows respectively.
Output parameters
The following output parameters will be calculated by the program
hf, hs, hb Thickness of filler, stuffer, and binder tows (m).
H Thickness of the unit cell (m).
lf, ls, lb Length of one filler stuffer, and binder tow per unit cell (m).
Lf, Ls, Lb Total length of filler, stuffer, and binder tows per unit cell (m).
Vf, Vs, Vb Total volume of filler, stuffer, and binder tows per unit cell (m3).
Lx, Ly Length of the unit cell in X and Y directions (m).
Muc Mass of unit cell (kg).
Suc Areal density of the unit cell (kg/m2).
FVF Fibre Volume Fraction of the unit cell.
Equations embedded into the algorithm
The thickness of the tows was calculated using equation (1). The linear density of the yarns used was known. The tow which is present in the filaments was circular and hence 100% packing factor is not possible. Therefore the packing factor of a tow (P) is incorporated.
P = π/4 ≈ 0.7854 (for rectangular packing array)
μi = Linear density of filler, stuffer or binder (kg/m)
ρ = Density of filler, stuffer and binder tows (kg/m3).
AR = Aspect ratio of filler, stuffer, and binder tows respectively
By incorporating the thickness of the filler, stuffer, and binder tows, the thickness of the consolidated unit cell (H) was determined by using equation (2):
hf hs, hb = Thickness of filler, stuffer, and binder tows (m)
The length of one layer thread in each of the filler, stuffer and binder tows has been expressed as by equations (3) to (6):


nucs = Number of stuffers along the direction of weft (Y) per unit cell
λf, λs = Number of fillers and stuffers per unit length, perpendicular to tow direction (s/m,f/m)
hf = Thickness of filler (m)
ARf = Aspect ratio of filler tows
H = Thickness of the unit cell (m)
Figure 12 shows the dimensions of the unit cell, where Ly and Lx are equal to lf and ls, respectively. The total length and subsequent volume have been formulated from the calculated lengths of individual filler, stuffer, and binder tows, where the subscript i is exchanged for each of the representative values for subscripts f, s, and b respectively:

Dimensions of unit cell.
The cross-sectional area (Ai) of each tow is
ρ= Density of filler, stuffer and binder tows (kg/m3)
P = Packing Factor
Total volume (m3) of each tow is calculated by equation (9)
The mass of the unit cell Muc (kg) has been calculated by the aggregation of all the linear masses
The areal density Suc (kg/m2) has been calculated as
The overall FVF has been calculated as
H = Total thickness of the consolidated unit cell (m)
These equations have been implemented and integrated into the Python Code and then executed within the Microsoft Visual Studio environment with the help of C#.
Challenges in coding 3 D structures
The challenges that are involved in the coding of 3 D structures include the correct prediction of the shape of the yarns based on their compression and bending behavior. Other information that has to be related to the yarn i.e, the yarn crimp and the spacing of yarns, also predicting the shape of the yarn cross-section are some of the major challenges in coding 3 D structures.
Tensile behaviour
The unit cells of 3 D Orthogonal, Warp Interlock and Angle Interlock structures were converted into .iges (Initial Graphics Exchange Specification) format with the help of the Python compiler module in ANSYS Macros. This enabled the structures to be analyzed for Tensile strength in the ANSYS environment. The tensile behavior of the fabrics was predicted by simulation and these results were compared with experimental values obtained on Universal Testing Machine (UTM).
The tensile property prediction was not based on geometrical parameters. The python code for tensile prediction was embedded into the Microsoft Visual Studio graphical workspace as a Macro. Macros are instructions given to software to carry out certain tasks. In this case, the computer was instructed to do a tensile test. The simulation can then perform a tensile test in a virtual Euclidean coordinate system and calculate the properties with acceptable accuracy. The accuracy depends on the Python coding implemented for the Macro program and also the Visual Studio Interface.
ANSYS simulation
ANSYS has pioneered the development and application of simulation methods to solve the most challenging engineering problems. ANSYS simulation software enables us to confidently predict how the products will operate in the real world. At the same time, it is a cost-effective and time-saving technique for carrying out experimentation. The model of the 3 D structure was developed in the ANSYS Workbench to carry out simulation in static structural model. The fiber properties i.e. its density, Young’s modulus, Poisson’s ratio and compression and tensile strength, etc. are fed through the engineering data tool on ANSYS. A meshing tool is used to mesh the modeled structures. It is the process of converting complex structures into thousands of finite elements. For finding out the solution of the structure the boundary condition is applied. Finally, the generation of a mathematical simulation model was carried out and the solution was obtained in the solver module by selecting the required output.
The Macro programs used in this analysis are based on the Ansys Parametric Design Language APDL which provides the designer with the versatility to perform a wide range of personalized testing according to specific user-designed boundary conditions and settings that are not possible to define using Ansys Workbench. The Ansys Workbench itself is a Graphical User Interface GUI that is based completely on APDL. Hence, while working with macros requires more effort and skill, it provides the user with a lot of versatility to simulate and analyze any kind of specialized design which is not possible using the Ansys workbench.
To execute the macro, first, the modeled specimen has to be meshed. This was done using the quadratic element PLANE183. The macro needs two text files as input. The first text file contains the coordinate points of nodes that define the structure of the unit cell. To establish continuous meshing and also accurate analysis, a maximum number of coordinate points have to be fed into the file. This text file consists of 3 columns to represent the x,y,z coordinates for each of the yarns, namely warp, weft and filler. The second text file is for defining the material properties and the tensile behavior of the unit cells. The macro conducts the simulation in several load steps. At each load step, the reaction force and elongation are written into the output log file. The computation is based on finite element equations that are pre-programmed into the Ansys APDL suite. The true strain at each load step is calculated based on the instantaneous values of the length and deformation at each element in the mesh. At the end of the simulation, these true strain values from each of the elements are summed up to obtain the final elongation.
Results and discussion
Geometrical parameters
A computer program was developed to predict the various geometrical parameters for the unit cell as shown in Figure 13.C# was used to develop the interface to view the results for the Mathematical Code written in Python. The equations (1) to (12) stated above have been integrated into the algorithm and then implemented into the Python console. This algorithm is responsible for computation.

Geometrical parameters calculated through Python code.
Parameters For Orthogonal:
Fabric thickness: 1.672676 mm Fabric areal density (GSM): 1.420626 kg/m2 Fibre volume fraction (FVF): 0.331763
Parameters for Warp Interlock:
Fabric thickness: 2.230235 mm Fabric areal density (GSM): 2.387480 kg/m2 Fibre volume fraction (FVF): 0.418166
Parameters for Angle Interlock:
Fabric thickness: 1.486823 mm Fabric areal density (GSM): 0.939294 kg/m2 Fibre volume fraction (FVF): 0.320503
Comparison of geometrical parameters with measured data
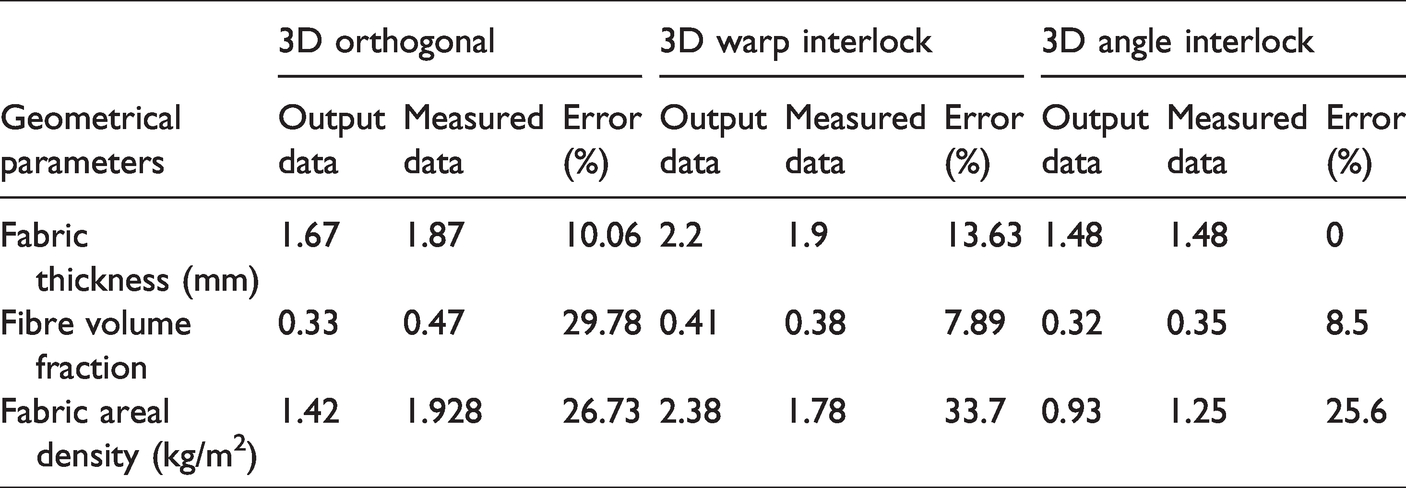
The parameters of the fabricated specimen namely thickness, volume fraction, and areal density were experimentally measured to validate the Computer Program. The theoretical and experimental values for all three fabrics are shown in Table 3. The results indicate that there is a difference of 26.73, 33.7 & 25.6% in fabric areal density. This is because the code computes fabric areal density based on theoretical equations that ignore a lot of practical imperfections like tension in the yarn and crimp which may lead to high error in fabric area density calculation.
Comparison of theoretical and experimental results of all 3 D fabrics.
Tensile behavior
The load extension curve has for all three fabrics, namely orthogonal, warp interlock and angle interlock have been generated as shown in Figure 14. In Figure 14, it can be seen that the load extension curve for the angle interlock and orthogonal fabrics have the same pattern i.e, the load/extension first increases slowly, and then it starts increasing steeply while the maximum load observed at breakage is less for the latter than the former and it is least for the warp interlock structure. The graphs obtained areas observed, the load/extension first increases slowly and then steeply and finally comes to the breaking point, in case of angle interlock and orthogonal fabrics while in case of warp interlock it increases almost steadily.

Load-Elongation curve for (a) Orthogonal and (b)Warp Interlock structure (c) Angle interlock.
Comparison of tensile behavior with measured experimental data
The fabricated specimen with the same specifications as the coded specimen was subjected to experimental tensile testing using the Universal Testing Machine (UTM) to validate the results obtained from the Computer program. The predicted and measured values of tensile behavior are given in Table 4. It may be observed that the difference is more in predicted & measured extension values as compared to load values. This is because the predicted extension is based on idealistic assumptions of material behavior under load. The code is implemented based on the assumption that the material behaves ideally following Hooke’s law at all nodal points. However, this is not the case in reality. The practical behavior is adversely affected by fabric specific properties such as crimp. The mathematical model implemented in the code did not take into account the effect of crimp.
Comparison of tensile behavior of 3 D fabric.
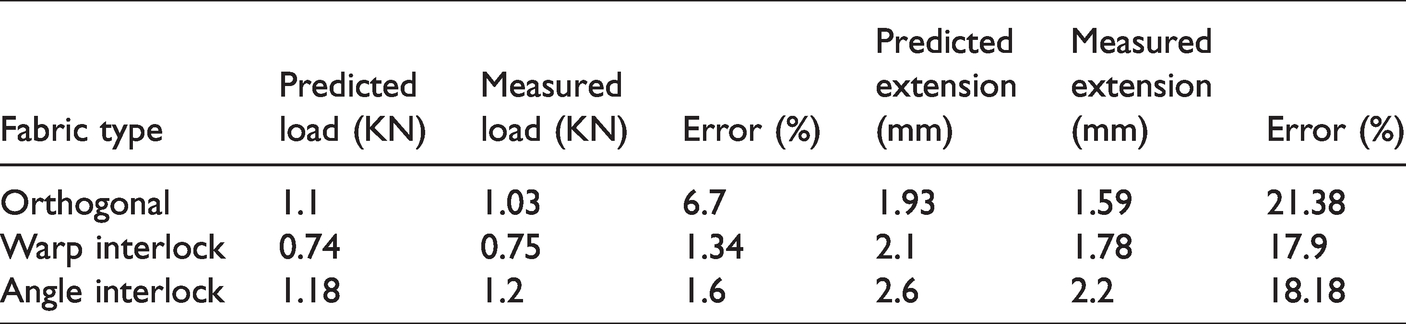
3D angle interlock is showing the highest load and extension values as compared to the others. This is attributed to the long and zig-zag passage of binder thread in 3 D angle interlock fabric which exerts resistance force as well as stretchability in two components namely the x component (horizontal) and y component (vertical). Orthogonal and warp interlock structures owing to their comparative straight yarn path do not exert that additional resistance force. The 3 D angle interlock fabric due to its unique structure is able to unfold itself during stretching. The binder yarns that are aligned at an angle is able to almost completely unfold itself horizontally during tensile testing. The higher extension of angle interlock in stuffer yarn direction is due to longer yarn length for a given fabric dimension compared to warp interlock and orthogonal fabric.
Conclusion
The internal geometry and tensile behavior of 3 D woven orthogonal, warp interlock, and angle interlock structures were predicted by mathematical coding. Unit cells of all 3 D fabrics were generated with the desktop application by changing weaving parameters and then exported into Ansys format to predict the tensile behavior of the fabrics by simulation. This approach was found more efficient than other modeling techniques as coding is a faster method of computing the results. This application is proposed to serve as a prediction tool to analyze and test different orientations of 3 D fabric structures in the virtual simulated environment without actually fabricating the structures thus saving time and money in the process.
Footnotes
Declaration of conflicting interests
The author(s) declared no potential conflicts of interest with respect to the research, authorship, and/or publication of this article.
Funding
The author(s) disclosed receipt of the following financial support for the research, authorship, and/or publication of this article: The project team sincerely acknowledges the Ministry of Textiles, Government of India for sponsoring this project to Focus Incubation Centre of 3D Fabric and Structural Composite.