
Abstract
Experimental methods have been successfully utilized in the textile industry for understanding the compression and recovery behavior of needle-punched nonwoven textiles under dynamic loading. However, these methods can only be performed after commercial production of textiles. An analytical approach is presented to estimate the Jeffery’s II model parameters and to simulate the compression and recovery behavior of needle-punched nonwoven textiles under dynamic loading before commercial production. These parameters are estimated by a viscoelastic model that explains the compression and recovery behavior according to ISO 2094. The model consists of a combined linear spring and a dashpot set parallel to each other and then connected to a linear dashpot in series. Using the Fourier transform, the periodic excitation is converted to the sum of harmonic forces and differential equations of the system motion are analytically solved. The predicted results of this analytical approach for the compression and recovery behavior of nonwoven textiles in dynamic loading showed the average error of 5.68% and 9.41%, respectively when compared to the experimental results. Therefore, the linear Jeffery’s II model is able to predict the compression and recovery behavior of needle-punched nonwoven textile under dynamic loading with high accuracy before commercial production of textiles.
Keywords
Introduction
Nonwoven textiles have various applications in the industry, such as making household goods, automotive floor-covering [1], filters [2,3] and geotextiles [4]. As estimated, 300000 tons of tufted and nonwoven fabrics and 56000 tons of tufted and nonwoven floor mats were used in 90 million cars and light vehicles [1]. The nonwoven textiles are subject to different forces and their deformations (i.e. compression and loss of thickness) are highly affected by their compression behavior. Therefore, compression and recovery after load removal are the significant factors in durability of these textiles.
In recent years, several researcher have been studied on the compression and recovery properties of textile materials under dynamic loading. Sengupta et al. [5] found that once the ratio of the reinforcing material weight to the layer weight was decreased, the loss of thickness was reduced in dynamic loading. Kothari and Das [6] investigated the effect of dynamic loading on the compression properties of three types of fabrics: polyester needle-punched spun-bond, polypropylene needle-punched surface calendared spun-bond, and polypropylene thermally bonded spun-bond fabrics. They observed that polyester needle-punched spun-bond fabrics underwent the highest reduction in thickness. It was followed by needle-punched surface calendared spun-bond and thermally bonded spun-bond fabrics. The effect of dynamic loading on jute and jute-polypropylene blended needle-punched nonwoven fabrics was investigated by Sengupta et al. [7]. As they observed, an increase in the cycles of dynamic loading, the loss of thickness increased. It was also found that the loss of thickness decreased with an increase in punch density, depth of needle penetration and area density.
Debnath and Madhusoothanan [8] studied the effects of fabric weight, fiber cross-sectional shapes and reinforcing materials on the compression properties of polyester needle-punched nonwoven fabrics including initial thickness and the rates of compression, thickness loss and compression resilience. Their results showed that the initial thickness, compression, and thickness loss are higher in fabrics with no reinforcing materials. Das et al. [9] investigated the effects of certain parameters on the compression properties of needle-punched nonwoven fabrics. The studied parameters included fabric mass per unit area, needling density and the proportion of shrinkable acrylic fibers in blends. It was shown that needling density and mass per unit area had significant effects on the compression, recovery and resilience of needle-punched nonwoven fabrics, but the proportion of shrinkable acrylic fibers had no significant effect before steam treatment. After steam treatment; however, this proportion had a significant effect on those parameters. Bariagi et al. [10] investigated the compression property of nonwoven fabrics under different pressures. They showed that the rates of compression and recovery for 1 kPa to 9 kPa loads were higher than those of 1 kPa to 5 kPa loads in all the samples. This was due to the higher compactness and packing fraction after the first-step loading.
Ceilk and koc [11] investigated the loss of thickness in Wilton-type carpets with different pile materials (e.g. wool, acrylic and polypropylene) under dynamic loading. Through statistical evaluations, it was shown that pile materials and the number of impacts had significant effects on the mean thickness and the thickness loss of those carpets. For all the samples, it was observed that an increase in the number of impacts led to a decrease in the mean thickness. Also, compared to the other types, acrylic carpets were found more capable of recovery after the removal of dynamic loads. Vuruskan et al. [12] examined the influence of pile density and pile height on the loss of thickness in carpets exposed to dynamic loading under different impacts. It was found that both pile density and pile height have significant effects on the compression properties of carpets. In another study, Praveen Kumar and Shunmuga Sundaram [13] designed an optimum energy absorber for automobiles by examining the axial crushing characteristics of glass/kenaf/epoxy composite-wrapped capped cylindrical tubes. Also, the axial crushing and energy absorbing characteristics of hybrid aluminum/composite-capped cylindrical tubes under static and impact loading conditions were investigated by Praveen Kumar [14].
Different mechanical models were introduced to describe the compression and recovery behavior in the textiles. A rheological model was developed by Krucinska et al. [15] explaining the behavior of nonwoven fabrics under a compression load. A linear viscoelastic model was presented by Jafari and Ghane [16] to show the recovery behavior of machine-made carpets after a brief static loading. Different combinations of spring and damper systems were used to modeling the mechanical behavior of carpets. There was a reasonably good agreement between the experimental results of their study and the Jeffery’s model. It was concluded that a linear standard model has poor regression for the recovery properties of cut pile carpets after static loading. Khavari and Ghane [17] used three different models to investigate the compression, decompression and recovery of cut pile carpets under a constant rate of compression. Maxwell mechanical model and linear and nonlinear three-element models were used to simulate the compression and recovery behavior of the carpet samples. The results showed that a three-element model consisting of a Maxwell body paralleled with a non-linear spring could explain compression and decompression behavior more accurately than Maxwell and linear models.
Analytical modeling provides an approach to understand processes that might otherwise be outside the scope of humans. Furthermore, it also helps to avoid actual experimentation, which can be costly and time-consuming [18]. In this study, an analytical investigation based on mass-spring-dashpot is presented to predict the compression and recovery behavior of needle-punched nonwoven textiles under dynamic loading. To the best of author knowledge, this is the first analytical investigation of the compression and recovery behavior of nonwoven fabrics. Since this method can be used before the commercial production of the fabric, it is beneficial to the fabric industry by saving production cost and time.
Mechanical model
To investigate the compression and recovery behavior of nonwoven fabrics, a mechanical model known as Jeffery’s II model is used in this section. It consists of a Voigt-Kelvin unit that is placed in series with a linear dashpot. In the presented model (Figure 1), there should be a viscose element series with Kelvin model. The viscose element shows the effect of the exerted force on permanent compression of the fiber and the Kelvin element shows the effect of this force on transient behavior of the fiber. Therefore, elastic behavior of the fiber modeled in Kelvin part of the model. By removing the exerted force, length change of this part of the model (Kelvin part) is tend to zero over the time. Jeffery’s II model has all this sub elements and is suitable for modeling the dynamic behavior of this type of fabrics.
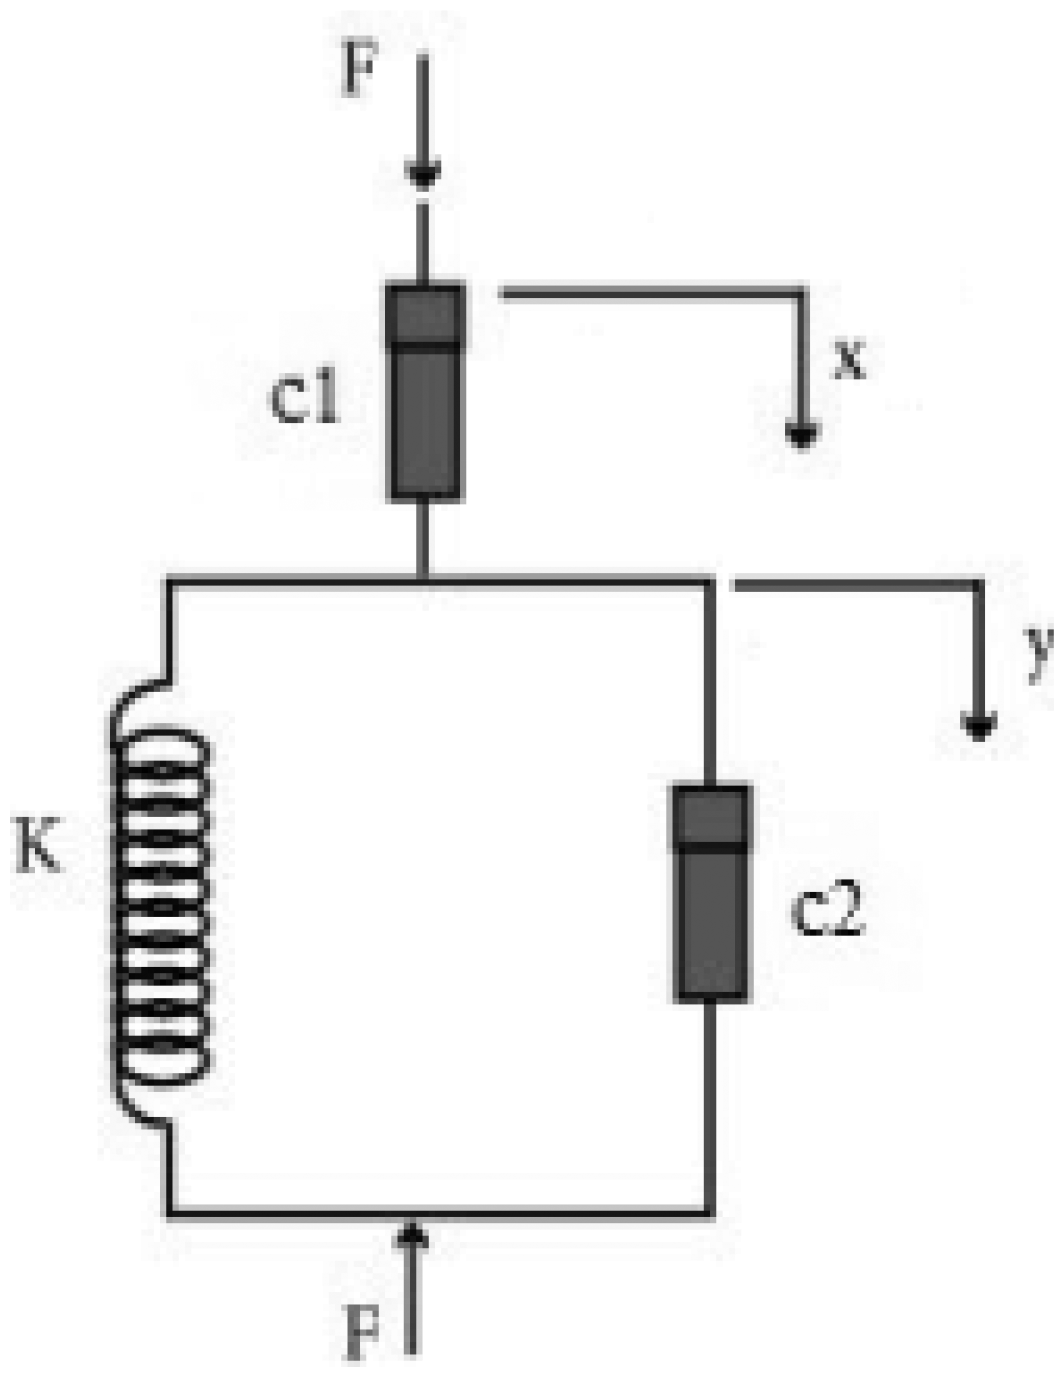
Schematic diagram of the linear Jeffery’s II model.
In Linear Jeffery’s II model (Figure 1), F is the compressive force applied to the model,


Where x and y are the textile and Voigt-Kelvin unit displacement, respectively.
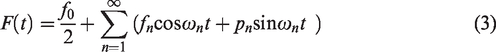
During dynamic loading, force F is a periodic impact force (Figure 2). Therefore, it can be expressed in the form of a Fourier series expansion with a set of harmonic forces in accordance with equation (3) [19]:

Force F acts as a periodic impact force during dynamic loading.
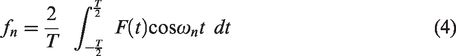
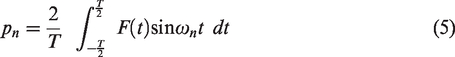
In which:


Also, equation (8) can be obtained by the substitution of equations (4) and (5) in equation (3) as follows:

Compression
According to equation (8), force F consists of three parts including the constant force
Compression in terms of constant force
By the substitution of the constant force


As equations (9) and (10) are solved, the textile displacement x is determined as follows:

Compression in terms of
Once the cosine terms are substituted in equations (1) and (2), the following expressions are achieved:


Where:
The textile displacement for this case can be obtained by solving equations (12) and (13) as follows:

Compression in terms of
By the substitution of the sinusoidal terms in equations (1) and (2), the following expressions can be achieved:


In which:

If parameter ‘y' is calculated from equation (16) and the response to equation (17) is substituted, the displacement of the textile can be derived as follows:
The responses of equations (1) and (2) to periodic excitation (3) can be obtained by the superposition of responses (11), (15) and (19) as follows:

Where constants A and B can be determined using the initial conditions, i.e.
Recovery
Displacement was plotted versus time to show a schematic presentation of compression under dynamic loading and the corresponding recovery curve (Figure 3). The dynamic load is removed after time


The compression and recovery behavior of the nonwoven fabric during loading and after its removal.
Where
The solution of the Jeffery’s viscoelastic model in the recovery mode was found to be [20]:

Where

According to Figure 3,
By the substitution of the initial conditions of the recovery mode (


Where
Considering

And from equation (24),

The recovery behavior in dynamic loading is taken into consideration after 1000 impacts. Since the interval of each impact is 4.3 seconds, the total time is 4300 seconds.
Estimation of the excitation force amplitude
The maximum compression of the textile occurs when the velocity of the weight becomes zero. In this state, dashpot force become zero and so was deleted from the Jeffery’s II model.
To estimate the parameter

The devised model to estimate the parameter
The principle for the energy conservation of the system between the mass releasing time and the end time of impacts can be written as follows:
Parameter x can be calculated through solving equation (29) as follows:

The impact force is calculated by

Some technical data were used for the estimation of the amplitude of the excitation force
Technical data used for estimation of

Materials and methods
The Polyester fibers were obtained from Zarifmosavar company [21] were used to produce needle-punched nonwoven fabric. Their average specifications and the test methods for the measurement of fiber characteristics are presented in Table 2. Ten measurements were conducted to determine these parameters.
Characteristics of fibers used for nonwoven.

To produce needle–punched nonwoven fabrics with average mass per unit area 600 g/
The needling parameters.

The initial thickness of the samples under a static pressure of (2

Digital thickness gauge.
All the experiments were performed under the standard conditions of 20
The thickness reduction of the nonwoven samples was measured in dynamic loading. In order to measure the thickness reduction rate in dynamic loading, the samples were placed under dynamic loading in accordance with the Standard ISO 2094 [30]. This standard specifies a method to determine the thickness loss of textile floor coverings under dynamic loading. According to ISO 2094, the weight-piece of a total mass (beater) 1279 g ± 13 g falls freely under gravity from a height of 63.5 mm ± 0.5 mm on to the specimen every 4.3 s ± 0.3 s. The thickness measurements are made at intervals of up to 1000 impacts.
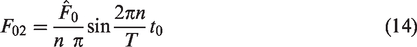
A laboratory dynamic loading device made by Nasjsanj company from Iran, was used to simulate the application of dynamic loading (Figure 6). The samples were placed between two jaws and subjected to 50 impacts. Then, the sample thickness in the two places was measured immediately. The loss of thickness in the samples under 50-100-200-300-500-700-1000 impacts was also measured. After the load was removed, the thickness of the samples was measured up to 24 hours. The images of the samples before and after the test are presented in Figure 7.
Dynamic loading device.

Sample used in the study (a) before loading and (b) its deformation after loading.
In this study, the compression and recovery behavior of needle-punched nonwoven textiles after dynamic loading were investigated. Equations (20) and (22) were then adapted to the experimental data using the best curve fitting. The best fit has been achieved using Meta heuristic method based on imperialistic competitive algorithm (ICA) with programming in MATLAB software [31].
Results and discussion
Five samples were tested, and the average results were recorded based on the displacement value and the coefficients of variation (CV) of the measurements (Tables 4 and 5).
Displacement of the nonwoven samples in dynamic loading.

Displacement of the nonwoven samples after the removal of the dynamic loading.

Determination of the best fit equation allowed the extraction of the linear Jeffery’s II model parameters. The parameters are presented in Table 6.
Linear Jeffery’s II model parameters.
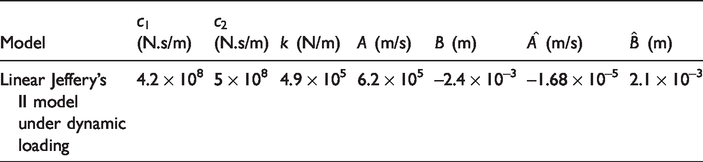
Figure 8 shows the changes of force and displacement versus time on a larger scale under four impacts. Due to the low simulation time, the nonlinear behavior of the system cannot be seen here.

Force and displacement versus time on a larger scale under four impacts (n = 1000).
Compression behavior of the samples were shown by plotting displacement versus time (Figure 9). Due to the zoom-factor, no individual loading can be seen here.

Compression behavior of the nonwoven samples.
The experimental data and the results obtained from the linear Jeffery’s II model for the compression (equation (20)) and recovery behavior (equation (22)) of the nonwoven samples after the exertion of 1000 impacts under dynamic loading were summarized (Figure 10).

Comparison of the experimental data and the results obtained from the linear Jeffery’s II model for the compression and recovery behavior of nonwoven textiles under dynamic loading.
The experimental data and the results obtained from the linear Jeffery’s II model for the compression and recovery behavior for difference height of the weight-piece (h = 45 (mm), h = 55 (mm) and h = 63 (mm)) are shown in Figures 11 and 12. These figures show that the increase in height from 45 (mm) to 63 (mm), increases the displacement of the nonwoven samples in dynamic loading.

The experimental data and the results obtained for the compression for difference heights. (h = 45(mm), h = 55(mm) and h = 63(mm))

The experimental data and the results obtained for the recovery for difference heights (h = 45(mm), h = 55(mm) and h = 63(mm)).
The mean absolute error and the R-square value between analytical and experimental results for the compression and recovery behavior under dynamic loading for h = 63 (mm), h = 55 (mm) and h = 45 (mm) are presented in Table 7.
The mean absolute error and the R-square value for difference heights (h = 45 (mm), h = 55 (mm) and h = 63 (mm)).

The results show that the rate of the average errors in the linear Jeffery's II model under dynamic loading for h = 63 (mm) are 5.68% and 9.41% for compression and recovery behavior, respectively. In order to determine the predictive capability of the obtained model, the regression coefficients (R-square) were obtained. The R-square values are 0.910 and 0.896 for compression and recovery behavior under dynamic loading. Comparison of the results presented in Table 7 shows that the linear Jeffery’s II model can be explained the compression behavior of nonwoven textile more accurately and acceptably in comparison to the recovery behavior.
Conclusions
In this study, the linear Jeffery’s II model was used as a mechanical model to predict the compression and recovery behavior of needle-punched nonwoven textiles under dynamic loading. The Fourier transform was used to transform the periodic dynamic loading to the sum of the harmonic excitations. The loss of thickness of the studied textile samples was measured for a certain number of impacts. The measurements were performed for each sample under 50, 100, 200, 300, 500, 700 and 1000 impacts. Through solving the governing equations of the model, the system parameters were estimated by fitting the experimental data and the theoretical responses. The regression coefficients (R-square) of the theoretical and experimental diagrams were obtained to predict the compression and recovery behavior of nonwoven fabrics under dynamic loading. Based on the results presented in this study, the following conclusions can be made: The mean absolute error and the R-square value show that Jeffery’s II model is able to predict the compression and recovery behavior of nonwoven fabrics under dynamic loading. Developed model can predict compression behavior of the nonwoven fabric better than their recovery behavior. With an increase in the height of the weight-piece, the mean absolute error between analytical and experimental results increase for compression and recovery behavior.
Footnotes
Declaration of conflicting interests
The author(s) declared no potential conflicts of interest with respect to the research, authorship, and/or publication of this article.
Funding
The author(s) received no financial support for the research, authorship, and/or publication of this article.