
Abstract
Three-dimensional woven spacer composites have great potential for use in different parts of automobiles and construction application due to their better mechanical performance. In literature, time-dependent compression and recovery behavior of three-dimensional woven spacer composites was not studied. In this study, three-dimensional woven spacer composites (three thickness levels) were evaluated under static and dynamic (time-dependent) compression and recovery. The static compressive strength of composites was reduced with the increase in sample thickness. Also, the highest amount of energy was absorbed during the fracture of 4 mm (Comp4) thick composite, followed by 10 mm (Comp10) and 20 mm (Comp20) thick composites. Compressibility (%) and resiliency (%) was highest in Comp4 but recovery (%) was a bit lower as compared to the Comp10 and Comp20, while recovery (%) was highest in 10 mm thick composite as compared to the 4 mm and 20 mm thick samples. Moreover, higher value of permanent deformation in thickness with time was observed in Comp20 showing higher creep followed by Comp4 and Comp10. Furthermore, Comp4 showed the highest values of work done during cyclic compression loading–unloading testing, presenting highest toughness.
Keywords
Introduction
The three-dimensional (3D) spacer composites can offer high skin-core debonding and impact resistance, excellent durability and superior integrity, high stiffness, excellent thermal insulation, acoustic, and damping. The application prospects of these products are in automobiles, locomotives, aerospace, marine, windmills, building, and other industries [1]. These structures are ideal for the applications, where weight is an important consideration. The reduction in weight gives many advantages such as higher speed, larger pay loads, less consumption of engine power, and better working economy [2]. Bio-resins can be used in structural and automotive applications like dash board, bumpers, and door panels for being biodegradable and renewable resources [3,4].
Conventional spacer structures are made of core material having low density and facesheets of high modulus such as honeycomb and foam. These are joined together with an adhesive to produce the lightweight panels [5]. The surface area available for bonding at the face–core interface is very limited for this kind of structures, which can cause the delamination at the bonding interface. Due to this reason, it has turned into the primary area of concern with the traditional spacer structures under external impacts [6]. There is an extreme reduction in compressive strength due to core damage and delamination in case of low and intermediate velocity [7,8]. To tackle the deficiencies in spacer structures, different substitute methods i.e. stitching [2] and Z pinning [9,10] are used. Both stitching and pinning particularly showed the impact damage tolerance. But both approaches would certainly decrease the in-plane properties [11]. Nowadays, different 3D fabric structures are used, because of their cost effectiveness, improved mechanical properties, and design range [12,13].
Mono-spacer fabric composite panels showed improved compressive (flat) and drum-peel strength [13–15]. They revealed that the pile yarns played an important role on the flat compression and shear properties [1]. Furthermore, the mono-spacer fabric composites failed under flat compressive load due to the broken or slanted piles, and would be optimized 80°–90° pile angle. Whereas piles cracked at its endpoints under shear load, while during compression (edgewise) they failed due to the facesheet wrinkling. Damage and fracture of the composite was increased with the increase of core heights (5 mm, 10 mm, 15 mm, 20 mm, 25 mm, 30 mm) while absorbed energy and flat compressive strength were decreased. Load–displacement curves during flat compression exhibited obvious elastic, plasticity plateau, and densification stages [16,17].
Quasi-static compression of glass/ethoxylene 3D spacer composite showed tilting of fiber piles initially, which lead to the simultaneous deformation of the cores by compression [18,19]. Mountasir et al. [20–22] revealed that the compression properties of composites were improved by reducing the yarn damage in the noncrimped layers of the woven structures. Additionally, the specific flatwise compressive strength of multifacesheets 3D spacer composites was higher than monospacer fabric composites and joined facesheets [23]. Ashir et al. [24] also produced the spacer structures with steel wires and carbon rovings.
Furthermore, numerical methods were also used to investigate the compression behavior of 3D spacer fabrics [25,26], syntactic-foam/glass fibre [27] composites, and core properties [28] of pile and foam-filled composites under compression and shear.
The process of moderating the design comprises different considerations, including the shape of the structure, which affects load transmission during impact, and the capacity to absorb elastic energy, which controls rebound [29]. 3D Spacer fabric structures due to their excellent compression strength, durability, insulation, recyclability, pressure distribution, energy absorption capacity, fire retardancy, and anti-bacterial properties are used in multiple high performance areas e.g. cycle helmets, firemen helmets, body armours, boot soles, marble reinforcements, boat structures, surfboards, train body parts and baseplate, tanks, wound care dressing, orthopedic support bandages, compression therapy goods, and different parts of car body parts such as, body panels, door panels, trunk, wheel covers, headliners, dashboards [30,31].
Dependence of pile height on dynamic compression/recovery behavior of 3D woven spacer composites has not been reported in literature. The objective of this work is to investigate the static and dynamic (time dependent) compression and recovery properties and energy absorption during compression of spacer composites.
Material and methods
Materials
Three-dimensional woven spacer fabrics made of glass filament yarn (34 tex linear density) were used as reinforcement. Top and bottom facesheets and vertical pile yarns in the central portion are shown in Figure 1. The arrangement of warp, weft yarns in X and Y directions respectively, and pile yarns in Z direction (making S shape) of 3D woven spacer fabric is also highlighted in Figure 1. In warp direction, 8-shaped pile was made by the combination of two S-shaped piles, while in weft direction I-shaped pile was formed. This fabric was obtained from Qinhuangdao Taidao Trade Co., Ltd, China.
Yarn arrangement in 3D woven spacer fabric.
3D woven spacer fabric specifications.

Composite fabrication
Three-dimensional woven spacer fabrics i.e. 4, 10, and 20 mm were fabricated into their corresponding composites using the hand lay-up technique and were named as Comp4, Comp10, and Comp20, respectively. Green epoxy resin CHS-EPOXY G530 (two-component) was used during composite fabrication and manufacturing cycle of epoxy resin is given in Figure 2. The resin was supplied by Spolchemie Pvt. Ltd Czech Republic. Degradable content in the green epoxy resin was 28%.
Production cycle of green epoxy.
On average, 39 ± 0.5% fiber volume fraction of composite plates was achieved. Warp- and weft-wise cross section of 3D spacer composites is shown in Figure 3(a) and (b), respectively.
Cross-section of composites: (a) warp direction; (b) weft direction.
Characterization
The 3D woven spacer composites were investigated under static and dynamic (time-dependent) compression and recovery. For static flat compression of 3D woven spacer composites, ASTM C365 was used having a sample 76 mm long and 76 mm wide. Dynamic (time-dependent) compression and recovery behavior was investigated under single- and multi-cycle (five cycles) levels. For single and cyclic compression and recovery test, ASTM F36 was followed having a sample 76 mm long and 76 mm wide. The Universal Testing Machine (Z100 All-round, Zwick) having a capacity of 100 kN was used for both static and dynamic compression testing.
Results and discussion
Flat compression properties
Experimental setup and compressive stress–deformation (%) curves for 3D woven spacer fabric composites with three different thickness levels, under flatwise compressive loads, are shown in Figure 4(a) and (b) respectively. The behavior of composites under flat compression test was ductile although composites were made of E-glass, which has brittle nature. Because of the glass filaments in the fabric, which could only bear load when they are flattened and are under tension at the same time glass in the piles bears small bending moments; and the resin surrounding the glass piles played the major role during flatwise compression. That is why it can be said that the mechanical performance of 3D woven composite was improved by increasing the resin ratio at a certain level [28].
(a) Compressive testing setup; (b) compressive stress versus deformation (%) curves of 3D woven spacer fabric composites.
Figure 4(b) and Table 2 show that flat compression properties varied with the change in core height. Compressive stress was decreased from 4 mm (Comp4) to 20 mm (Comp20) thick composite samples and very low compressive stress was found in 20 mm (Comp20) thick composite sample. Curves showed a linear elastic behavior until a stress peak was achieved. As the stress peak was reached, the sound of piles cracking could be heard, and the cracks were firstly detected at the joining point of piles with top and bottom facesheets, slanting of piles and then finally fracture was occurred. Piles in 4 mm thick sample were first tilted/slanted from the vertical position until the fracture was observed at its joining point with the facesheets, while piles in 10 mm thick sample and above were deformed, tilted, and buckled that causes material failure, as shown in Figure 5(a) to (c), similar results were discussed by Li et al. [1]. For further clarity, the fracture behavior of piles as highlighted in Figure 5(a) to (c) can be illustrated as shown in Figure 6.
Fracture morphologies of: (a) Comp4; (b) Comp10; (c) Comp20. Fracture morphologies of: (a) Comp4; (b) Comp10; (c) Comp20. Flat compressive testing results of composites.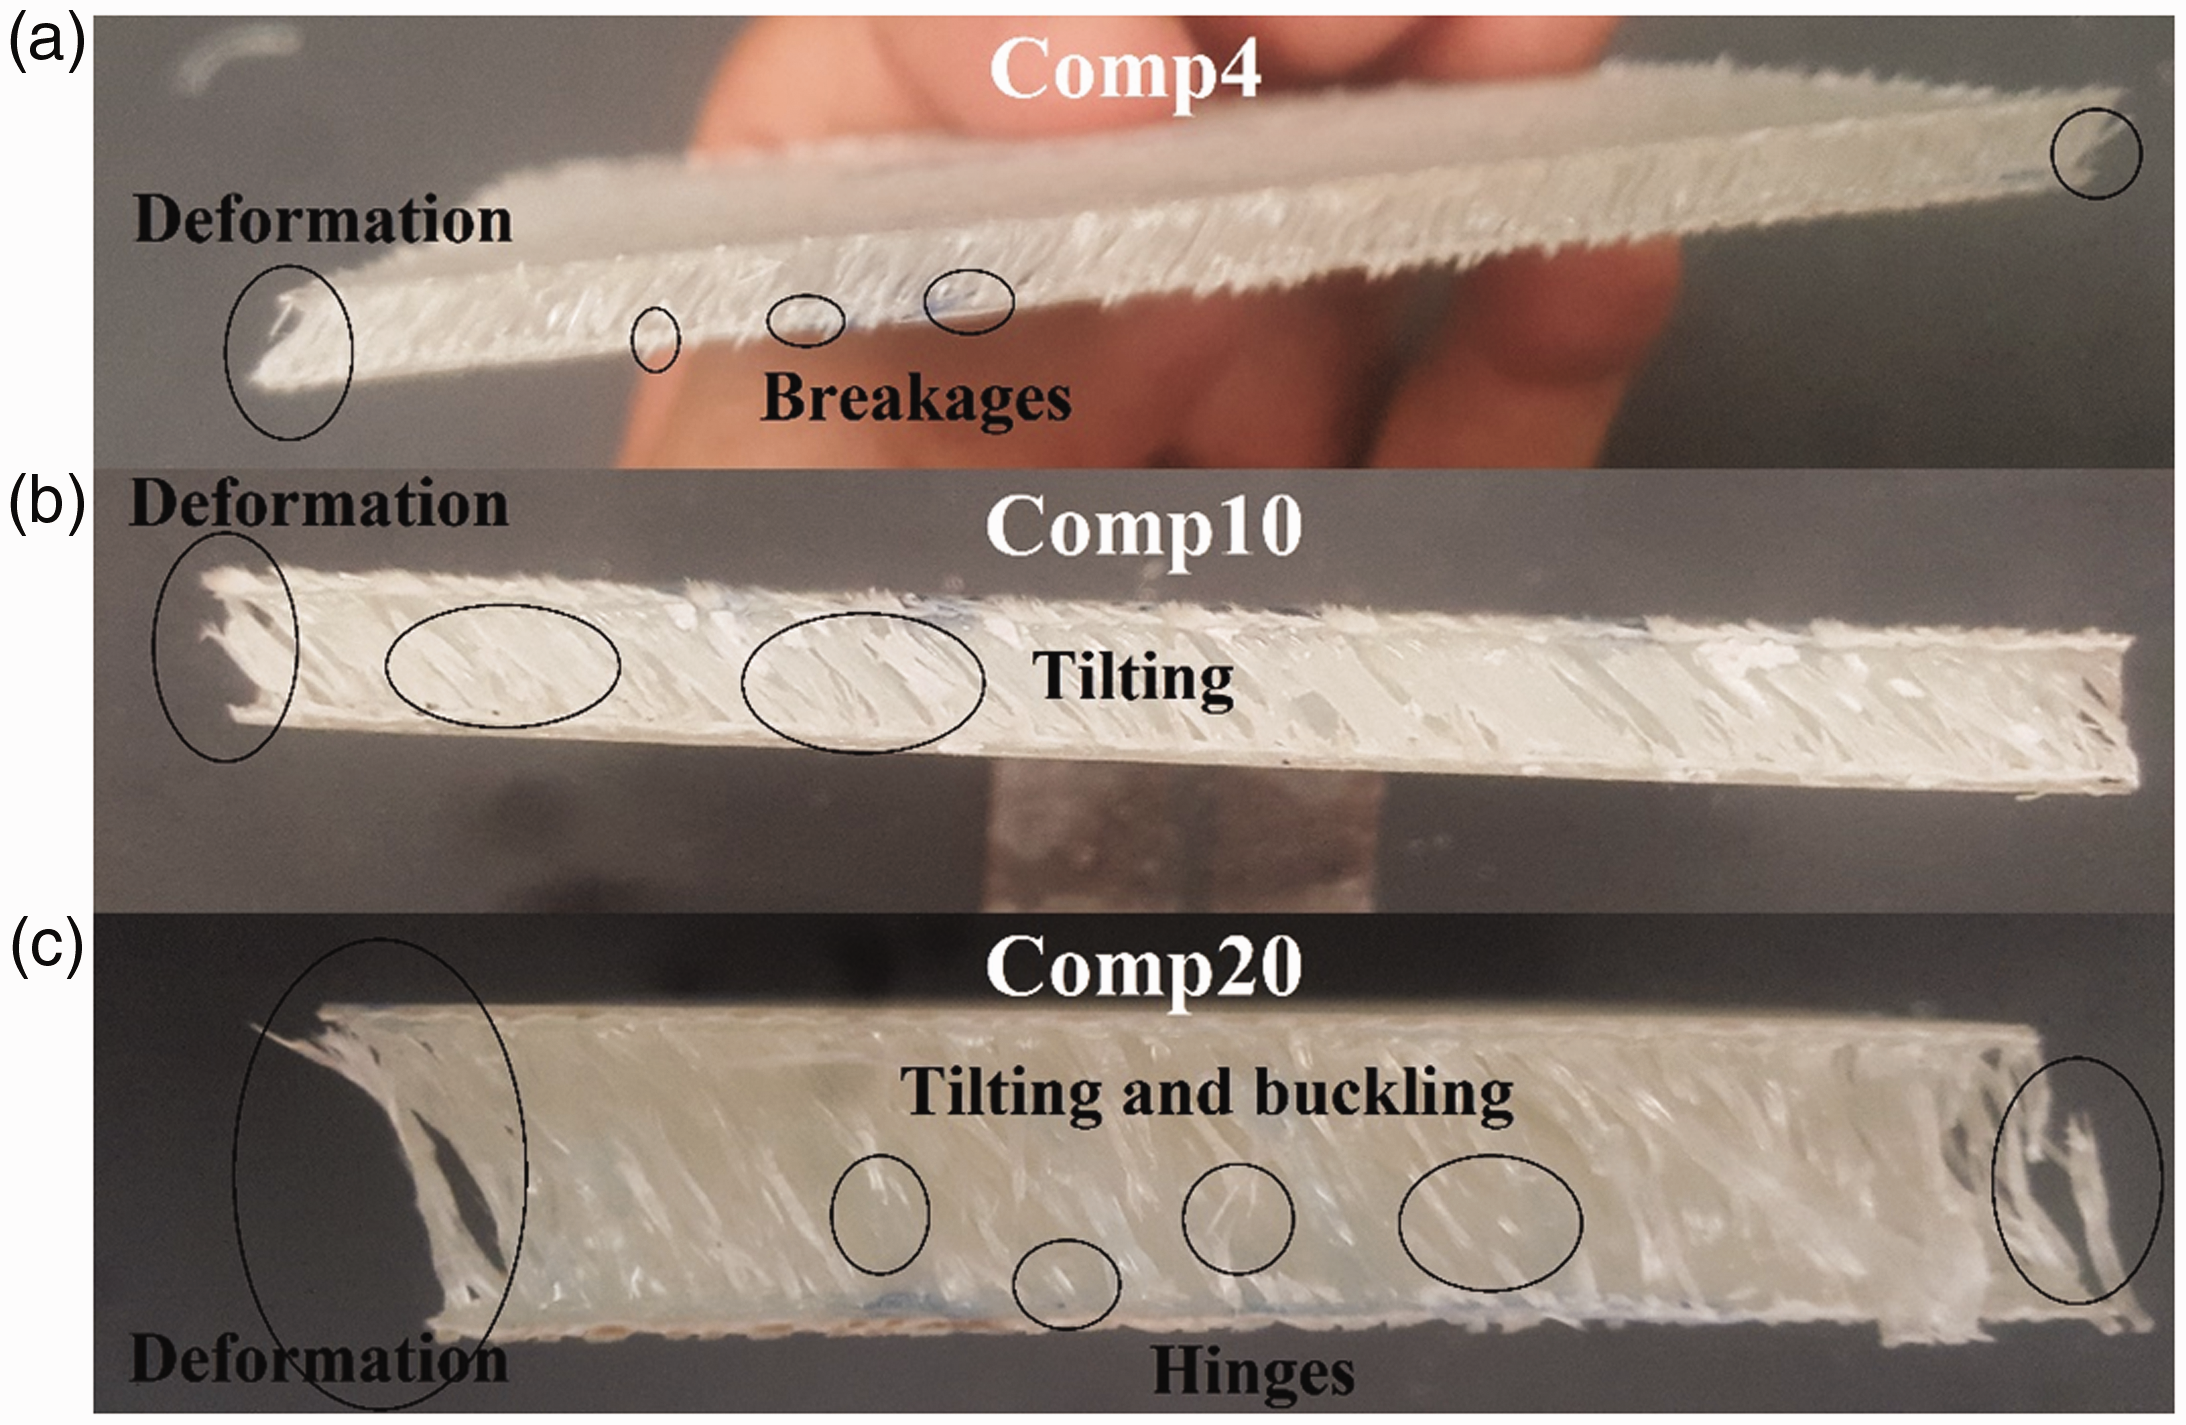


It can be observed that the core/pile height was a vital factor in the compressive testing. The compressive stress of Comp4 sample was the highest because of the very short length of pile (4 mm), which bears the full load before fracture at the facesheet joints with very little slanting followed by Comp10 (10 mm) and very low in Comp20 (20 mm) sample. In Comp20, piles could not resist the applied load for a very long time and slanted and fractured from the central part of piles under slight applied compressive load due to the extra-long length of the pile.
From Table 2, it can be observed that the maximum compressive force was decreased to 53.96% from 4 mm to 10 mm thick composite, while in 20 mm thick composite maximum force was decreased to 94.7% in comparison with 4 mm thick composite sample. Similarly, compressive modulus was decreased to 53.09% from 4 mm to 10 mm thick composite, while the compressive modulus value was decreased to 77.43% in comparison with 4 mm thick composite. Similar results were discussed by the Jin et al. [16] and Zhao et al. [17].
The reason behind the maximum compressive force and modulus of Comp4 was similar as explained in the compressive stress, i.e. shorter pile height would bear more load and stiffer in comparison to the longer one. Furthermore, compressometer deflection was increased with the increasing thickness of composites. An indirect relation was found to predict between pile height and compressive stress values with these composite samples.
Energy absorption during flat compression
Fracture behavior of three composite samples could be further analyzed based on the energy absorbed during the deformation procedure as shown in Figure 7(a) to (c). The energy absorbed (toughness) during fracture was the highest in Comp4 followed by Comp10 and Comp20. Comp4 sample could bear the highest applied load with little deformation as compared to the other two samples. As encircled in Figure 5(a), comp4 sample was first slanted towards weft and fracture started at the point of contact between piles and facesheets, which absorb more energy during fracture due to the short pile height, whereas Comp20 sample showed the lowest value of energy absorbed and highest deformation during the fracture depicting moderately ductile behavior in comparison with the other two samples as shown in Figure 7(c).
Energy absorbed versus deformation curves of: (a) Comp4; (b) Comp10; (c) Comp20.
It is obvious that the fracture propagation was very fast with the little plastic region in the Comp20 sample. Ductile materials are preferred in most of the mechanical applications because they exhibit more plastic region and higher energy absorption before fracture, which are intrinsically more safer than brittle materials presenting more toughness [32]. Furthermore, it can be observed that the energy absorbed was decreased significantly with the increase in the spacer fabric thickness.
Single-cycle compression and recovery
Compression and recovery cycle was applied in three steps; in step 1, 20% of the maximum compression force as shown in Table 2 for 30 s, in step 2, 60% of the maximum compression force for 60 s, and in step 3, 20% of the maximum compression force for 30 s were applied to composite samples. A single cycle of this load series was applied as shown in Figure 8.
Single-cycle compression and recovery test setup.
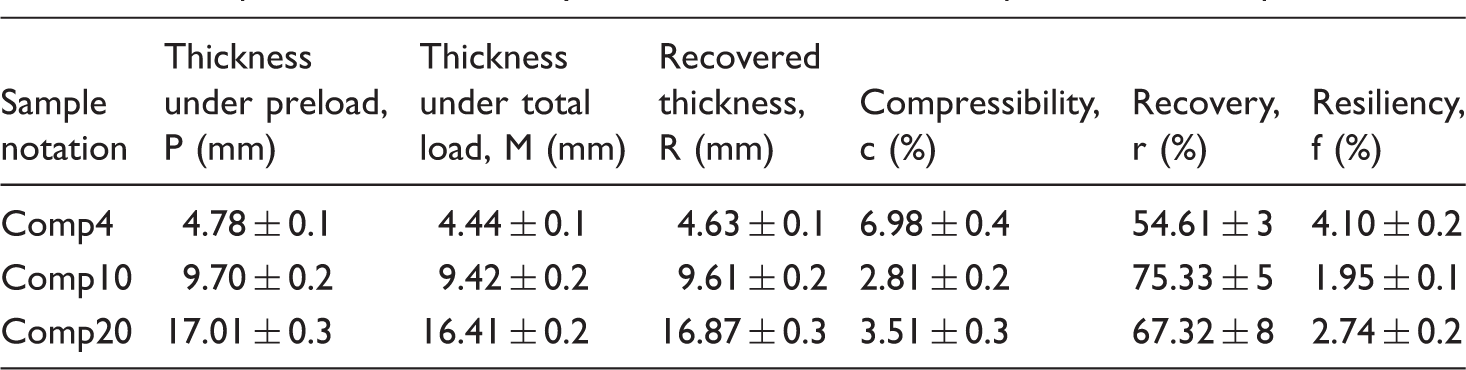
Different compression and recovery test results: thickness under pre-load, thickness under total load and recovered thickness, compressibility %, recovery %, and resiliency % are shown in Table 3. Experimental force versus tool separation curves for 3D woven spacer composites with three different thickness levels are shown in Figure 9(a) to (c). Initially, 80% of the total compressive force was applied in the second step, but composites did not recover their thickness. After that, 60% of the compressive load were decided to be applied in the second step for all composite samples, while in the first and third steps, 20% of the compressive force was maintained.
Force versus sample thickness curves of: (a) Comp4; (b) Comp10; (c) Comp20. Compression and recovery test results of 3D woven spacer fabric composites.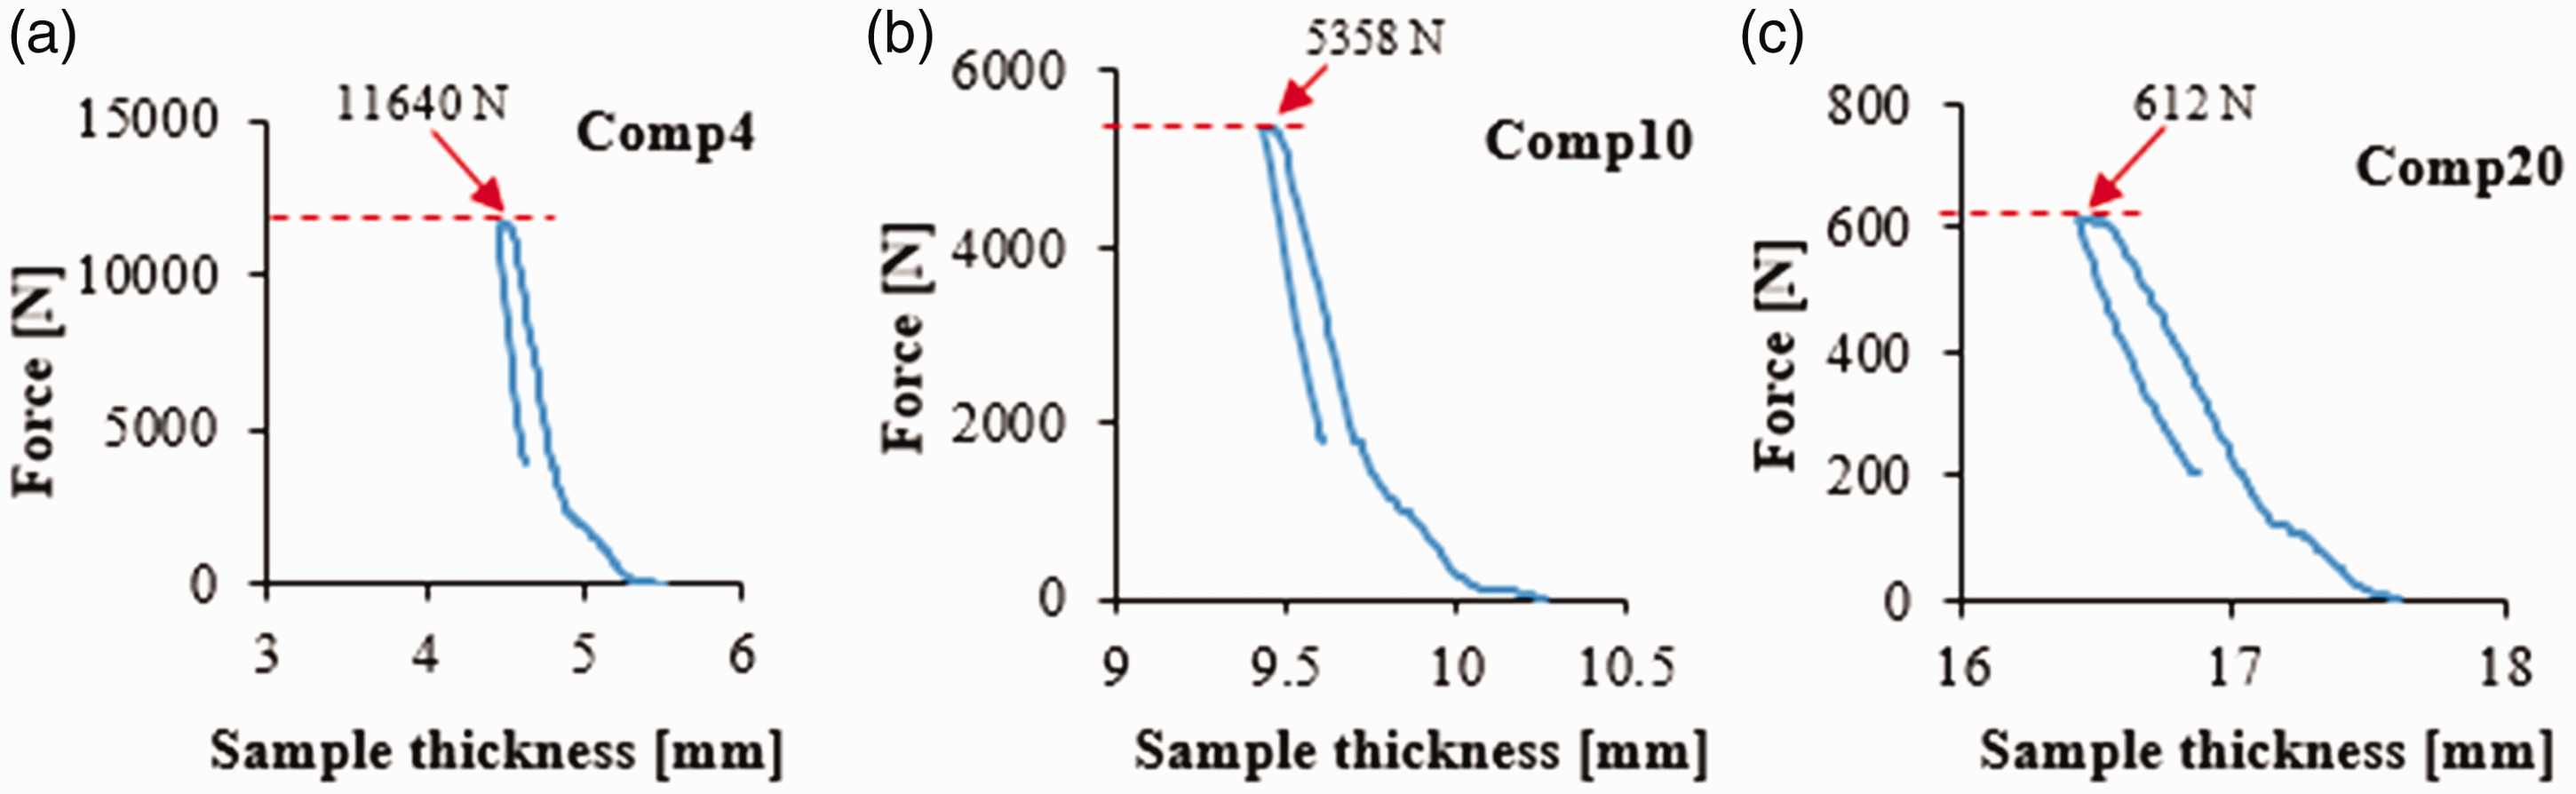
Comp20 was deformed easily under very little compressive load due to extra-long pile height during compression and recovery cycle, while Comp4 showed the highest resistance against applying cyclic load during deformation as shown in Figure 9(a), whereas in the Comp10 sample change in thickness was under a moderate level of applied force due to moderate pile height (10 mm).
The pre-load value of thickness showed that there was no significant difference found in the thickness value, while a significant difference in thickness was found under 60% force as given in Table 2 for 60 s time. Recovered values of thickness showed that none of the three samples returned to its initial stage after the application of compression and recovery cycles. There was a permanent or plastic deformation in all composite samples due to this compression and recovery cycle. The difference in the thickness of the Comp20 sample was the most significant after this test followed by Comp4 and Comp10 samples. In the first cycle of 20% force, there was a minor difference in thickness occurred in the composite samples, while in the second cycle of 60% force, permanent deformation occurred in all the samples.
Compressibility and resiliency percentages were the highest in the Comp4 sample, but the recovery percentage was lower in comparison with Comp10 and Comp20 samples. In lower pile height, the compressibility of composite samples was easier, but recovery of the sample to its initial position was difficult. Recovery percentage was the highest in the Comp10 sample, but the lowest in Comp4. In the Comp20 sample, recovery percentage values were on the optimum level. Also, in the 4 mm thick sample compressibility percentage was higher in comparison with 10 mm and 20 mm thick samples. The ability of Comp4 to spring back (resiliency) into initial position after the compression was higher due to shorter pile height, while the lowest in Comp10. As in 20 mm thick samples, piles were permanently deformed and damaged from the central part, while in Comp10 piles were tilted and deformed instead of damage from a central part as shown in Figure 4(b).
Cyclic compression and recovery
Cyclic compression loading and unloading cycles were applied in two steps; in the first step, 60% of the total compression force as shown in Table 2 for 15 min and in the second step 10 N force for 15 min of recovery were applied to the composite samples. Five cycles of this load series were applied to each composite sample. In the first step, 11,640 N, 5358 N, and 612 N force for the compressive step of Comp4, Comp10, and Comp20 samples, respectively, and 10 N force for recovery step (second step) were kept constant for each sample. Since the force was kept constant for each cycle, the change in thickness (deformation) with time was drawn in Figure 10(a) to (c) for each sample. Permanent deformation or change in thickness with time under constant force was significant in Comp4 and Comp20 samples, while a little change in thickness of Comp10 was found in the second step as shown in Figure 10(b). The results of a cyclic test could be quite complex, due to the creep, stress-relaxation, and permanent deformations.
Deformation versus time curves of: (a) Comp4, (b) Comp10, and (c) Comp20 during compression and recovery test.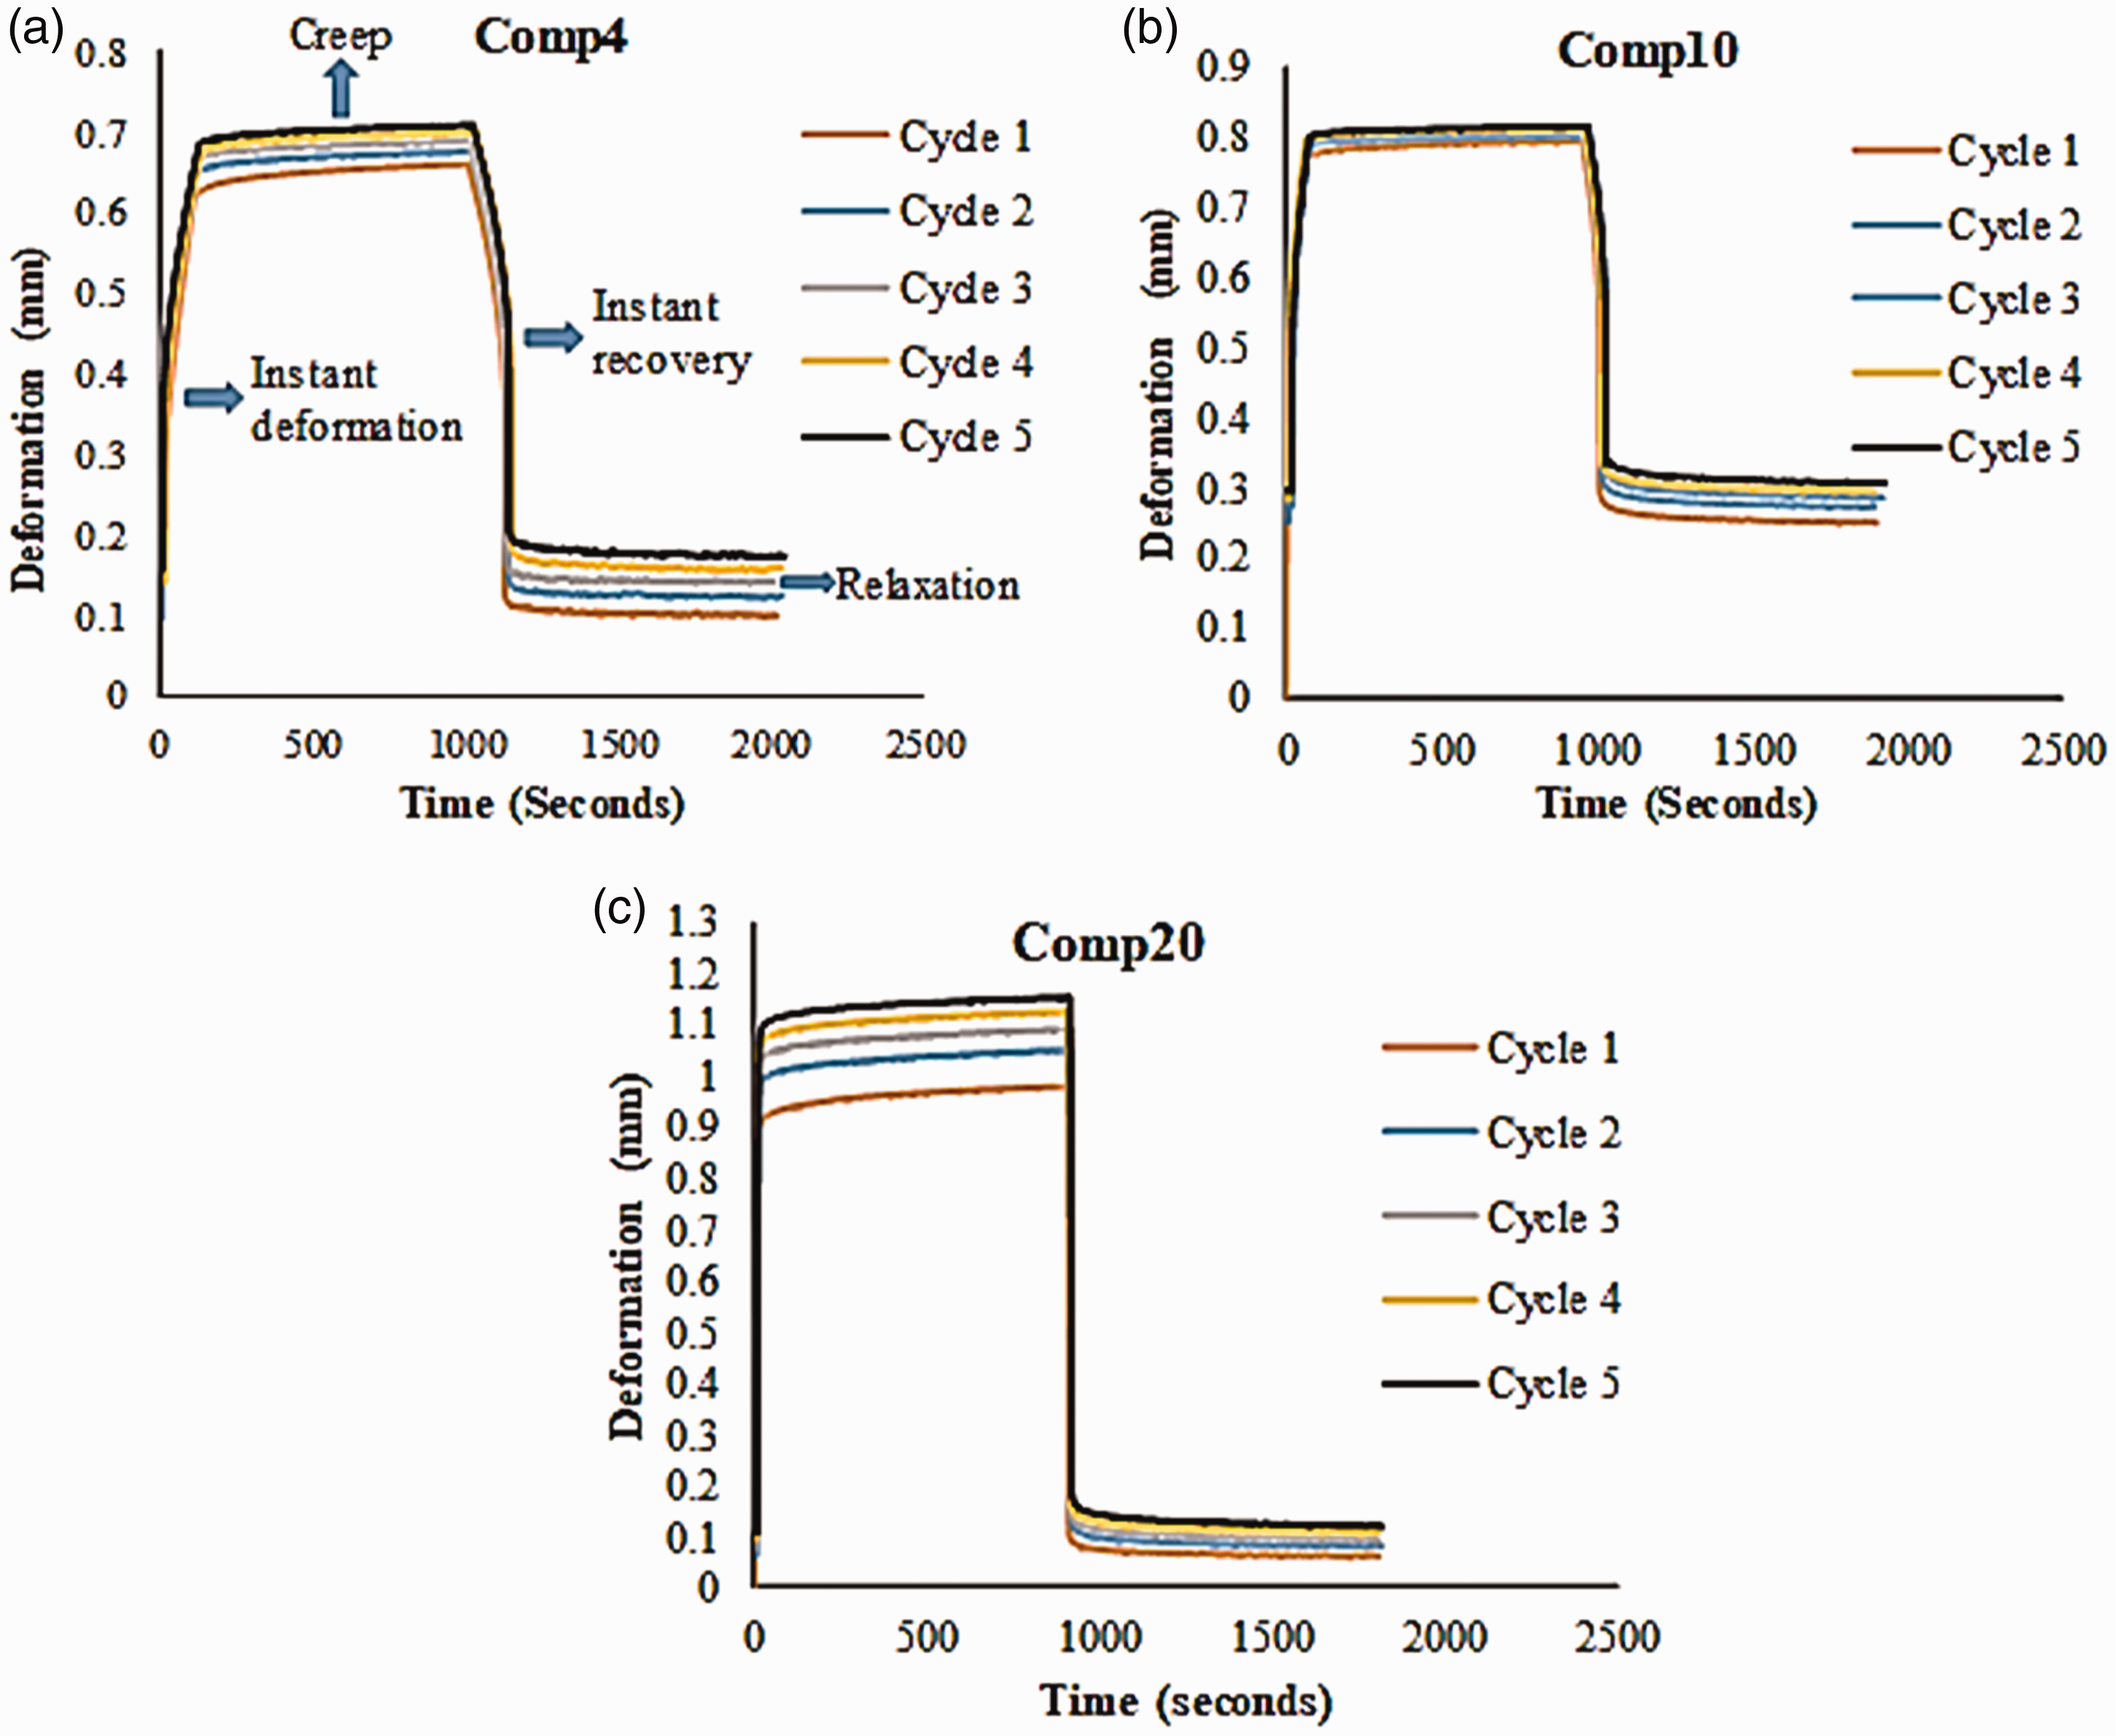
Due to the application of cyclic load, deformation behavior was significant in Comp4 and Comp20, while in Comp10 sample deformation was less with the passage of time. When the force was applied to composites, sliding of structural chains occurred with the passage of time, which showed viscoelastic changes in composites. With the application of force, all the samples showed instantaneous deformation and in every next cycle, the value of deformation was increased with the passage of time, which was significant in Comp20 and Comp4 samples. This increase in deformation with time (at the same temperature) was called creep. Significant creep was observed in Comp20 and Comp4, while less creep behavior was observed in Comp10 as shown in Figure 10(b). After the first cycle, creep was significant showing permanent deformation in Comp20 and Comp4 samples, whereas in next four cycles creep was less, whereas in the comp10 sample creep was minimized in the first step of the loading portion. After instant recovery, relaxation was increased with every next cycle in all the samples and samples tried to regain their original position, but due to the damage of piles, they could not succeed fully.
After the removal of the load at the end of the fifth loading cycle, some creep was observed in relaxation portion of all samples, which was significant in Comp20 followed by Comp4 and less in Comp10. It could be explained by the crash behavior of samples as shown in Figure 5. In the Comp4 sample, piles were fractured at the joining point of facesheets and sliding off the top and bottom facesheets was observed. Once the piles were fractured, the distortion was observed in the sample, resulting in the increase in deformation. Similarly, in Comp20 piles were tilted and buckled at the central portion showing the highest deformation. While in Comp10, tilting of piles and facesheets sliding was observed under compression loading and very less deformation in pile area was found, indicating less deformation in structures with the passage of time and less viscoelasticity.
Furthermore, hysteresis loops for five cycles loading–unloading of composite samples were obtained by plotting the force against deformation value, which is shown in Figure 11(a) to (c). Hysteresis in samples during compressive cycles could result from changes in the orientation of individual piles during loading–unloading cycles. When samples in the blocks were compressed, the vertically aligned individual piles became tilted and less oriented, requiring the sample to absorb energy. In contrast, on the release of load, samples try to recover their orientation while dissipating energy. This energy transfer generated two distinct loading paths, forming a hysteresis loop [33].
Hysteresis loop of: (a) Comp4; (b) Comp10; (c) Comp20 during compression and recovery test.
Since all samples showed a time-dependent elastic behavior, the force versus deformation curve was not the same during loading and unloading for all samples. Energy absorbed during one loading–unloading cycle was given by the area within the loop. A similar trend of change in deformation with force was observed in hysteresis loops as explained in Figure 11. The Comp20 sample showed higher viscoelastic behavior due to higher permanent deformation against a constant force with time followed by Comp4, which was comparable with Comp20 and very less permanent deformation was found in Comp10 sample as highlighted in Figure 11(a), (b), and (c). The Comp10 sample showed the least deformation with time in every next compressive cycle and recovery was the highest. That is the reason why loading and unloading curves are overlapping one over the other as shown in Figure 11(b). The highest amount of deformation with time under five loading and unloading cycles was observed in 20 mm (Comp20) thick composite cycle followed by the 4 mm (Comp4) thick composite sample during the hysteresis loop formation.
Time-dependent behavior of composite samples could be explained based on work done during load application, load removal, and difference of work done in both regions, which are shown in Figure 12(a), (b), and (c), respectively.
Graphs of work done during each cycle: (a) force loading; (b) force unloading; (c) work difference between both.
Work done during loading and unloading was the highest in the Comp4 sample and both values showed the decreasing trend in all samples. In Comp20, work done values during loading and unloading cycles were the lowest as shown in Figure 12(a) and (b). Because in the loading cycle Comp20 sample bears very less load and is slanted and fractured, while in the unloading cycle due to this fracture piles could not retrieve its original position and deformation occurred. The difference in work done was found to be the highest in Comp4 and showed the decreasing trend, displaying the highest value of deformation with the passage of time depicting more toughness. Higher the value of the difference in work done, more would be the viscoelasticity because less work would be done during load removal portion and value of deformation increased with time. Similarly, in Comp10 and Comp20 samples difference in work done showed the decreasing trend and the lowest in the Comp20 sample as shown in Figure 12(c). That is why the highest toughness was observed in Comp4, while in the Comp10 sample difference in work done was between both other samples presenting intermediate toughness.
Conclusions
In this study, it is concluded that during static testing compressive strength of 3D woven spacer composites decreased with the increase of composite thickness ranging from 4 mm (Comp4) to 20 mm (Comp20). While during single- and multi-cycle compression and recovery testing, compressibility (%) and resiliency (%) were the highest in 4 mm (Comp4) thick composite, but the recovery (%) was lower in comparison with 10 mm (Comp10) and 20 mm (Comp20) thick composites. Based on this work, 4 mm composites can be recommended for applications, where parts are subjected to static loading and 10 mm thick composites can be recommended for applications, where parts are subjected to dynamic loading.
Footnotes
Declaration of conflicting interests
The author(s) declared no potential conflicts of interest with respect to the research, authorship, and/or publication of this article.
Funding
The author(s) received no financial support for the research, authorship, and/or publication of this article.