
Abstract
Conductive fiber plain fabric can be used for manufacturing electromagnetic protective products, due to the capacity of electromagnetic shielding effectiveness and deformability. A model was established to predict the shielding effectiveness of conductive fiber plain fabric. The curved surface of fabric can be decomposed into countless ideal planes. The vertical incidence of electromagnetic waves on plain fabric surface can be regarded as the oblique incidence on the ideal plane. The transmission coefficients of transverse electric and transverse magnetic polarized waves were different in each point of fabric surface through the surface equation. The weight factor was supposed as the value of small area at each incident point, and the weighted average of transmission coefficients was deduced. The results showed that, the values of shielding effectiveness increased with the decrease of the pitch of conductive fiber plain fabric and increased with the increase of frequency in the range of 0.1–2 GHz. The trends of theoretical prediction values were consistent with the simulation and experimental values, which proved the rationality of the model.
Introduction
Electromagnetic (EM) waves are widely used in various fields. Due to the side effects from EM waves, such as the thermal effects on human body and the interference to electronic devices, higher requirements are put forward for EM shielding [1,2]. EM shielding fabrics are the flat fabrics with conductive fiber yarns, which have broad prospects in the application with the advantages of small proportion, strong deformation ability, wearability, strong applicability, and designability [3,4]. Studying shielding effectiveness (SE) of plain weave fabric is of great significance to the development of EM shielding fabrics.
At present, there are about two methods to evaluate the SE of EM shielding fabrics. The first method is to consider the conductive yarn as conductive mesh structure, so that the value of SE can be calculated. Hong et al. [5] proposed that the conductive grid structure composed of conductive fiber is an effective shielding structure of EM shielding fabrics, and the periodic interval of yarn has a great influence on SE. Mansson and Ellgardt [6] introduced calculation methods for effectively predicting the SE of metal grids with different shapes. Sarto et al. [7] considered the metal grids as a layered structure superimposed by two groups of parallel periodic metal lines at a certain orientation angle and ignored the contact impedance at the intersection point of the array. Liang et al. [8] applied these methods to metal fabric and obtained the SE mathematical model of metal-blended yarn fabric with different parameters. Rybicki et al. [9] proposed an equivalent circuit model based on the conductive grids of different types of metal fabrics to calculate the SE, and the EM shielding fabrics could be designed and optimized according to this model. Cai et al. [10] derived an equivalent calculation equation for the SE of infinite length conductive grids, and tested the SE of mixed fabrics with different metal fibers densities. The test and results showed that the method was feasible in a certain range. Chen et al. [11] considered multilayer fabrics as a combination of multilayer conductive grids and proposed a model for the SE of multilayer conductive fibers fabrics by the way of conductive grids structure. They believed that the SE of multilayer fabrics was greater than that of single-layer fabric.
The second method is to explore the relationship between fabric parameters and SE directly by experiments. Shyr and Shie [12] experimentally studied the influence of stainless steel fiber-enabled polyester textiles with different parameters on EM waves reflection and absorption, and concluded that the higher the content of stainless steel, the better the absorption of EM waves at specific frequency. Liu and Wang [13] conducted experiments on different types of EM shielding fabrics, and concluded that, under the same parameters, plain fabric had better SE than twill, and twill had better SE than sateen fabric, and indicated that fabric porosity was a key factor to affect SE. He also used the surface digital image analysis technology to analyze the surface of metal fabric and establish the characteristic matrix, and concluded that the percentage content, porosity, and arrangement direction of metal fibers all had a great impact on the SE [14]. Cheng [15] studied the influence of twill copper woven fabrics with different zonal density, warp density, silk diameters, and layer angle on SE by experiments, and concluded that the quantity of conductive layers and warp and weft density were positively correlated with SE. Bonaldi et al. [16] reports novel EM shielding fabrics produced by knife-over-roll coating and using combinations of carbon nanotube, conductive polymer, and these materials were suitable for the production of customized, flexible, lightweight, and porous conductive fabrics for either EM shielding or functional electronic applications, including high specific surface area conductive materials.
Studies about the effect of fabric curved surface on SE have been hardly reported. Because of the buckling conductive fiber fabric, every point of the thickness and fabric surface in each unit fabric is not the same, and thus conductive grids cannot be used to simplistically calculate. In view of the inadequacy of existing research, it is of great significance for the improvement of EM shielding fabrics to study the effect of fabric weave and fabric curved surface on SE. Based on the equation of fabric curved surface and the weighted average method, a model for predicting EM SE of conductive fiber plain fabric was established. We used the Computer Simulation Technology (CST) simulation software based on finite element analysis method and measurement experiment based on the coaxial method of flange to discuss the correctness of the model.
Mathematical model
Basic method
The EM waves are assumed to be far-field waves and the fabric yarns are composed of conductive fibers. Analyzing the surface unit texture of plain fabric according to pitch of plain fabric, as shown in Figure 1, the surface can be decomposed into countless ideal planes. EM waves vertical incidence onto the fabric surface can be seen as oblique incidence onto the ideal planes. These ideal planes are tangent planes of the incident points on the curved surface, as shown in Figure 2.

Plain fabric.

(a) Plane wave vertical incidence onto fabric surface (b) Plane wave vertical oblique incidence onto the ideal plane M.
Point M was the incident point. d means the fabric thickness. Angle
The effective transmission coefficients of TE waves
Angle

Plane weaves oblique incident on the ideal planes: (a) the TE waves and (b) the TM waves.
From the boundary conditions, the velocity components of incident, reflected, and transmitted waves are equal along the interface.


For the TE waves, the boundary conditions are as follows


As shown in Figure 3, there were regions 1, 2, and 3. When a plane wave propagates from region


Considering multiple reflections in the medium, multiple reflection effect factor

The effective transmission coefficients of TM waves
For the TM waves, the boundary conditions were as follows

The reflection coefficient of the TM waves

Like the TE wave, setting the relative dielectric constant and relative magnetic permeability of the fabric to 1, the effective transmission coefficient of the parallel polarized wave

Model for SE of conductive fiber plain fabric
Basic assumption
The yarn centerline of a compact plain fabric can be regarded as a sine curve. Set the relative dielectric constant and relative magnetic permeability of the conductive fiber fabric to 1, then the warp and weft yarns have the same buckling degree, the fabric pitch is
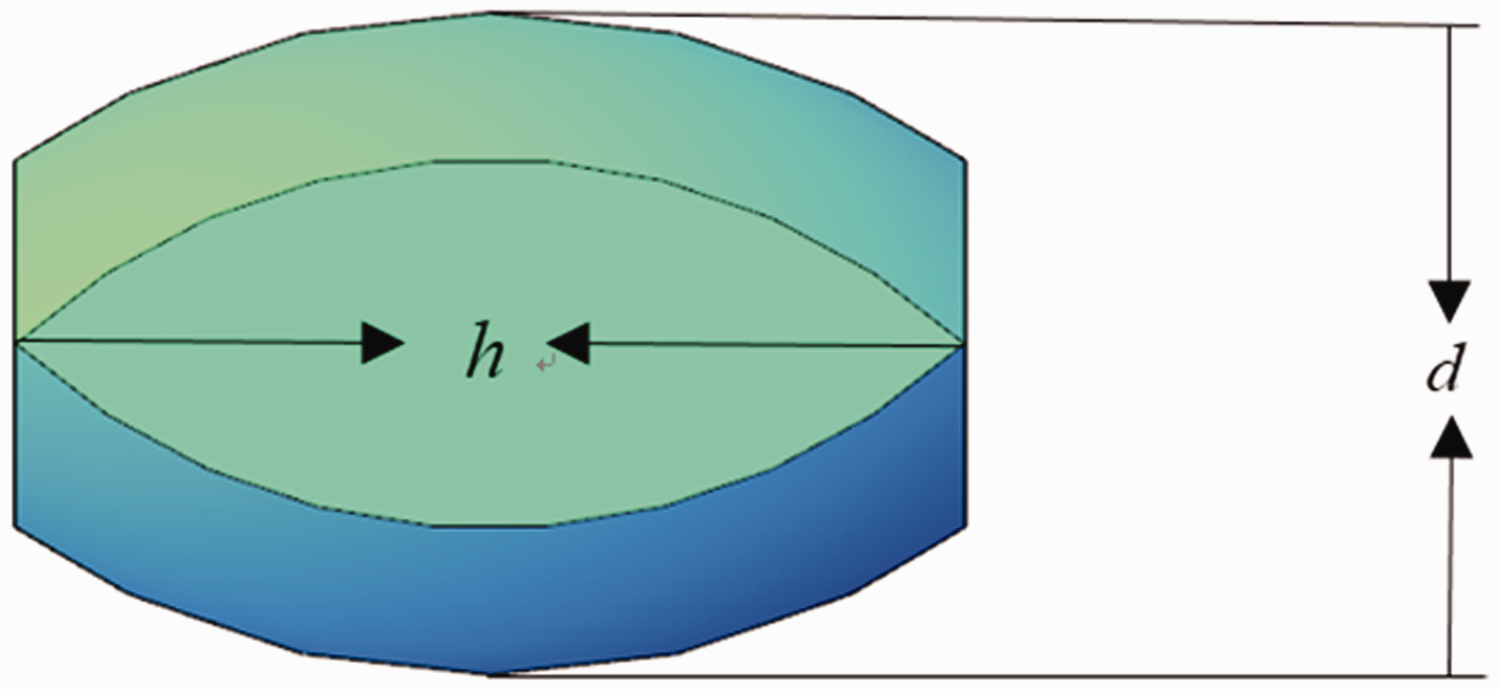
Section of plain weave fabric unit.
Model of plain fabric unit
The surface equation of plain fabric unit is as follows
The thickness of plain fabric

The SE of fabric
The transmission coefficient at a certain point of the fabric could be given by equations (10) to (12)

From equation (13), the transmission coefficient was related to the incident angle of EM waves. Therefore, the transmission coefficients of each point of the fabric surface were different. For the convenience of data statistics, these transmission coefficients were needed to be weighted average to calculate the mean of transmission coefficient, and the surface areas corresponding to each point
Assume that

Tangent plane normal vector of any incident point

The vector of the z axis,


Assuming that the fabric surface L was smooth, divide L arbitrarily into n pieces


The Teff of TE wave and TM wave at certain point were not equal, but after the weighted average of the whole area, the difference between
From the definition of SE, the fabric was in air, therefore the SE of magnetic field was equal to that of electric field, and SE of unit buckling fabric was

The correction of fabric porosity
The porosity of fabric yarn
Consider that the yarn was composed of assembled conductive fibers, as shown in Figure 5.

The diagram of fabric yarn porosity: (a) the hole of fabric yarn, (b) and (c) different types of holes.
Figure 5(a) shows the hole of fabric yarn, Figure 5(b) and (c) shows the different types of holes.
Assume the conductive fiber had a radius of R.


The total porosity
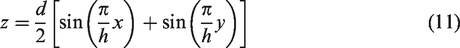
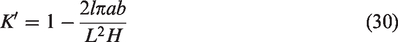
Pore structural of plain fabric
Consider Figure 6. The unit height

The diagram of plain fabric pore structural: (a) representative volume unit of plain fabric and (b) the diagram of pore structural.
Consider the yarn section as an ellipse, then elliptical I and II were congruent. The equation of ellipse I is

The equation of ellipse II is

Set ellipses I and II be tangent, then length of single yarn


The total length of yarn in the unit was
The volume of yarn in a unit

The unit volume is

Therefore, the porosity of the plain fabric
The total porosity of fabric was

The experiment
The simulation experiment
CST is an EM simulation software based on finite element analysis method with the characteristics of comprehensive, accurate, high integration, professional, and high precision. The plain fabric representative volume unit structure was imported into the CST MWS studio, as shown in Figure 7. The background was set as vacuum, the boundary condition on the x and y axes was set as the periodic boundary, and the EM wave propagated along the negative direction of the z axis. Set the relative dielectric constant and relative magnetic permeability of the conductive fiber fabric to 1, and the conductivity of fabric was 500 S/m. After generating the mesh, the SE of plain fabric was calculated in the frequency range of 0.1–2 GHz.

The simulation diagram.
Figure 7(a) shows the simulation diagram of representative volume unit plain fabric imported into CST EM simulation software. Figure 7(b) shows the mesh division diagram of plain fabric. The SE of the fabric was simulated when h = 6, 8, and 10 mm, respectively, and these simulation results were compared with the theoretical results, as shown in Figure 8.

The comparison between simulation results and theoretical results.
Simulation results showed that the values of SE increase with the decrease of the conductive fiber plain fabric’s pitch and increase with the increase of frequency, which was consistent with theoretical results. The deviation between the simulation values and the theoretical values is between 14% and 18%, because the simulation values do not consider the porosity of the yarns assembled by fibers.
The measurement experiment
The experimental materials
The experiment used the continuous carbon fibers with 200tex/3000F. The average diameter of a single wire was
Sample parameters.

The experiment methods
The measurement method was based on the coaxial method of flange recommended by the US National Bureau of Standards. The effective frequency test range of SE is 100 kHz to 2 GHz. This method has a simple test process and fast speed.
The measurement system consists of four parts, as shown in Figure 9.

The measurement process.
Anritsu MG3642A, as the signal source of EM waves, the frequency range is 125 kHz to 2.08 GHz, and the dynamic range of measurement is greater than 100 dB.
An improved test platform was based on ASTM-ES-7 coaxial transmission line method recommended by ASTM.
An Anritsu MS2661 handheld spectrum analyzer, the analysis frequency range is 9 kHz to 3 GHz and the minimum resolution bandwidth is 1 kHz.
A calculator connected with spectrum analyzer.
The test sample was placed between the transmitting antenna and the receiving probe. The index measured in this study was the SE, defined by ASTM D 4935 standard test method for EM shielding effectiveness of planar materials. Using frequency sweep test, the test range was 0.1 to 2 GHz and the scan interval bandwidth was 0.01 GHz. The measurement mode was as follows
Results and discussion
The measurement results of samples P1, P2, and P3 were compared with the theoretical results, as shown in Figure 10.

The comparison between experimental results and theoretical results.
From Figure 10, it can be seen that the smaller pitch is, the higher the overall of SE are. With the increase of frequency, the overall trend of SE is rising. In the range of 1–1.2 GHz, the maximum value of SE exceeds 20 dB. When the frequency is 400 kHz, 1 GHz, 1.25 GHz, and 1.8 GHz respectively, the experimental values are consistent with the theoretical values, and the experimental results of the overall trend agree with the theory. All of those proved the rationality of the theory. The main cause of the errors is that the relative dielectric constant and the relative magnetic permeability of the conductive fiber fabric are not 1 in this experiment.
In the range of 0.2–0.5, 0.9–1.1, and 1.6–1.9 GHz, with the decrease of the pitch, the carbon fiber mass per unit area increased, and the peak of SE increased successively. Apparently, under the action of the incident EM wave, the increase of carbon fiber content, the fiber surface produces more skin currents. In the range of 1.15–1.35 GHz, the peak value of P2 and P3 are higher than that of P1. This phenomenon occurs because of the frequency selection effect. For each sample, one bundle of fibers is equidistant from another. Compared with the wavelength of EM wave in the microwave frequency band, it must only correspond to one frequency, in which the phase cancellation of EM wave reaches the maximum, the reflection attenuation reaches the maximum and the effect on other frequencies decreases obviously, thus showing a certain selective frequency. A certain distance corresponds to a frequency that produces the maximum attenuation of reflection. For different frequencies, the distance d that causes phase cancellation to produce the maximum is also different.
Conclusion
A mathematical model for predicting EM shielding effectiveness of conductive fiber plain fabric was established based on the equation of fabric curved surface and the weighted average method. The correctness of the mathematical model was verified by simulation experiment and measurement experiment.
The results showed that the theoretical results were consistent with the simulation results in the range of the errors permitted. The trends of theoretical prediction values were consistent with the simulation experiment and measurement experiment, which proved the rationality of the model. We can draw the conclusion that the smaller the pitch of conductive fiber plain fabric, the better the shielding effectiveness. In the range of 0.1–2 GHz, the higher the frequency, the better is the shielding effectiveness.
This model provides theoretical support and prediction for the development of EM shielding fabrics. Similar to the model for plain fabric, as long as the equation of conductive fiber fabric curved surface and the changing of section thickness are known, the model for predicting shielding effectiveness of this fabric can be established. Because plain fabric is easy to be processed and can be designed easily, it can be used to manufacture consistent space curved surface components of EM shielding in batch production.
Footnotes
Declaration of conflicting interests
The author(s) declared no potential conflicts of interest with respect to the research, authorship, and/or publication of this article.
Funding
The author(s) received no financial support for the research, authorship, and/or publication of this article.