
Abstract
In this study, the poly(3,4-ethylenedioxythiophene)-poly(styrenesulfonate) conductive dry films were observed in terms of their thicknesses versus electrical resistances measured and related electrical resistivities calculated. The evolution of their electrical resistances was monitored in 75 days. Three groups of sensor yarns were studied also where the percolation threshold of the polymer complex poly(3,4-ethylenedioxythiophene)-poly(styrenesulfonate) had a crucial role in their manufacture. More glass component in sensor yarns led to less coating thickness what is in correlation with their interface phenomena and adhesion.
Introduction
Sensors yarns are a large class of smart textiles typically used for medical and transport applications, wearable system’s formation, including electronics or devices, etc. [1–5]. Numerous investigations have been focused nowadays on the specific techniques capable of following the evolution of textile reinforced composites, from their production to the target market [6–9]. Many metallic parts used in the transportation industry could be replaced by these composites where each production step has to be monitored to obtain high tech products [3]. Therefore, the creation of fibrous sensor yarns has attracted the researcher’s attention for structural health monitoring (SHM) of composites in situ [10–13]. A commercially very useful conductive polymer complex is the poly(3,4-ethylenedioxythiophene)-poly(styrenesulfonate) (PEDOT:PSS) that could be used for the fibrous sensor manufacture [14–19]. As the first step in their manufacture, a larger number of PEDOT:PSS films have to be observed, prepared from diverse aqueous conductive dispersion formulations to define appropriate one that could be successfully applied onto a pristine yarn. The PEDOT:PSS films are often inhomogeneous due to polymer swelling [20] and a balance must be achieved between the preferred film conductivity, thickness, and transparency properties [14]. According to this, the PEDOT:PSS coating thickness and uniform distribution of coating layers are also important factors in the case of sensor yarns [21].
In a previous study, a group of researchers manufactured sensor yarns based on six conductive PEDOT:PSS layers applied onto E-glass yarn (paintbrush method) to receive satisfying electrical resistance values and to use it for SHM of composites in situ. Some sensors failed to deliver a clean signal with acceptable regularity [22]. Therefore, in this study a new generation of PEDOT:PSS sensor yarns has been developed using a new formulation of PEDOT:PSS conductive dispersion based on PEDOT:PSS conductive dry films monitoring in a certain time, newly developed roll-to-roll coating method and a lower number of coatings added onto the pristine yarn(s).
Experimental study
Chemicals and materials
The aqueous dispersion of polymer complex PEDOT:PSS, CLEVIOS P FORM. CPP105D or CLEVIOS F ET (Heraeus, Leverkusen, Germany) and acrylic ester copolymer, Latex Appretan 96100 (Clariant, Paris, France), were combined for PEDOT:PSS conductive dry films preparation and conductive coating of commingled (pristine) yarns (Table 1). The main difference between two CLEVIOS products, most often formulated by end users for coating of plastics, glass, and other substrates, is in their solid content and conductivity. They contain organic solvent in their aqueous composition, propan-2-ol (45%) the first mixture while ethane-1,2-diol (10%) the second one [3]. The aqueous dispersion of copolymers of acrylic esters was used as a protective coating to join yarn filaments together and to protect sensor yarns from abrasion [3,23].
Chemicals used for PEDOT:PSS conductive dry films preparation and yarn coating.

PEDOT:PSS: poly(3,4-ethylenedioxythiophene)-poly(styrenesulfonate).
E-glass/polypropylene (GF/PP), E-glass/polyamide 6.6 (GF/PA66) commingled yarns and E-glass (GF) yarn by PD Fiberglass group (Glasseiden GmbH, Oschatz, Germany) (Table 2) were used for sensor yarns manufacturing [3,23].
Yarn and filament characteristics.
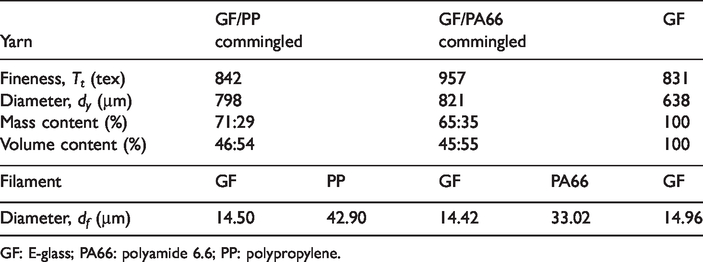
GF: E-glass; PA66: polyamide 6.6; PP: polypropylene.
Methods
Conductive aqueous dispersions
The mixture of aqueous dispersions, A and C or B and C, was stirred according to the defined protocol [3] on RCT basic hot plate magnetic stirrer (IKA Werke GmbH & Co. KG, Staufen, Germany). The mixture of aqueous dispersions A and C was stirred at 50°C until 40% solvent evaporation while the mixture of aqueous dispersions B and C at 50°C until 25% solvent evaporation. The speed of dispersion mixing was 550 r/min the first 30 min and after that 1100 r/min until needed solvent evaporation approximately 4 h.
Conductive dry films
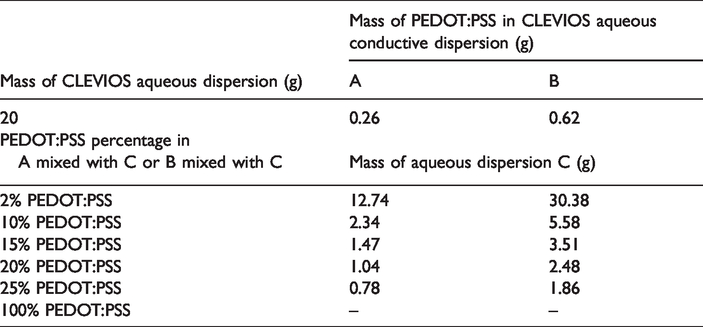
The PEDOT:PSS conductive dry films (Table 3) were prepared by delivering 500 µL of mixture prepared, A and C or B and C, by micropipette to the frames based on cellulose acetate tracks with the dimensions of 10 cm × 1 cm (length × width, L × l) placed on a plexiglass surface (Figure 1). Three films were prepared for each formulation. According to the plotting percolation method, the PEDOT:PSS percolation threshold [3] was needed to define for appropriate conductive coating of pristine yarn by dry film electrical resistance measurements in 75 days. After 48 h of solvent evaporation under standard conditions, 20°C and 65% relative humidity, the thickness of each dry film [24–27] was determined using an optical profilometer, Altisurf 500 (Altimet SAS, Thonon-les-Bains, France) as a mean of 10 profiles measured along the film. The final thickness for each conductive formulation was calculated as an average of three films.
The aqueous dispersions for conductive dry films electrical resistance testing.
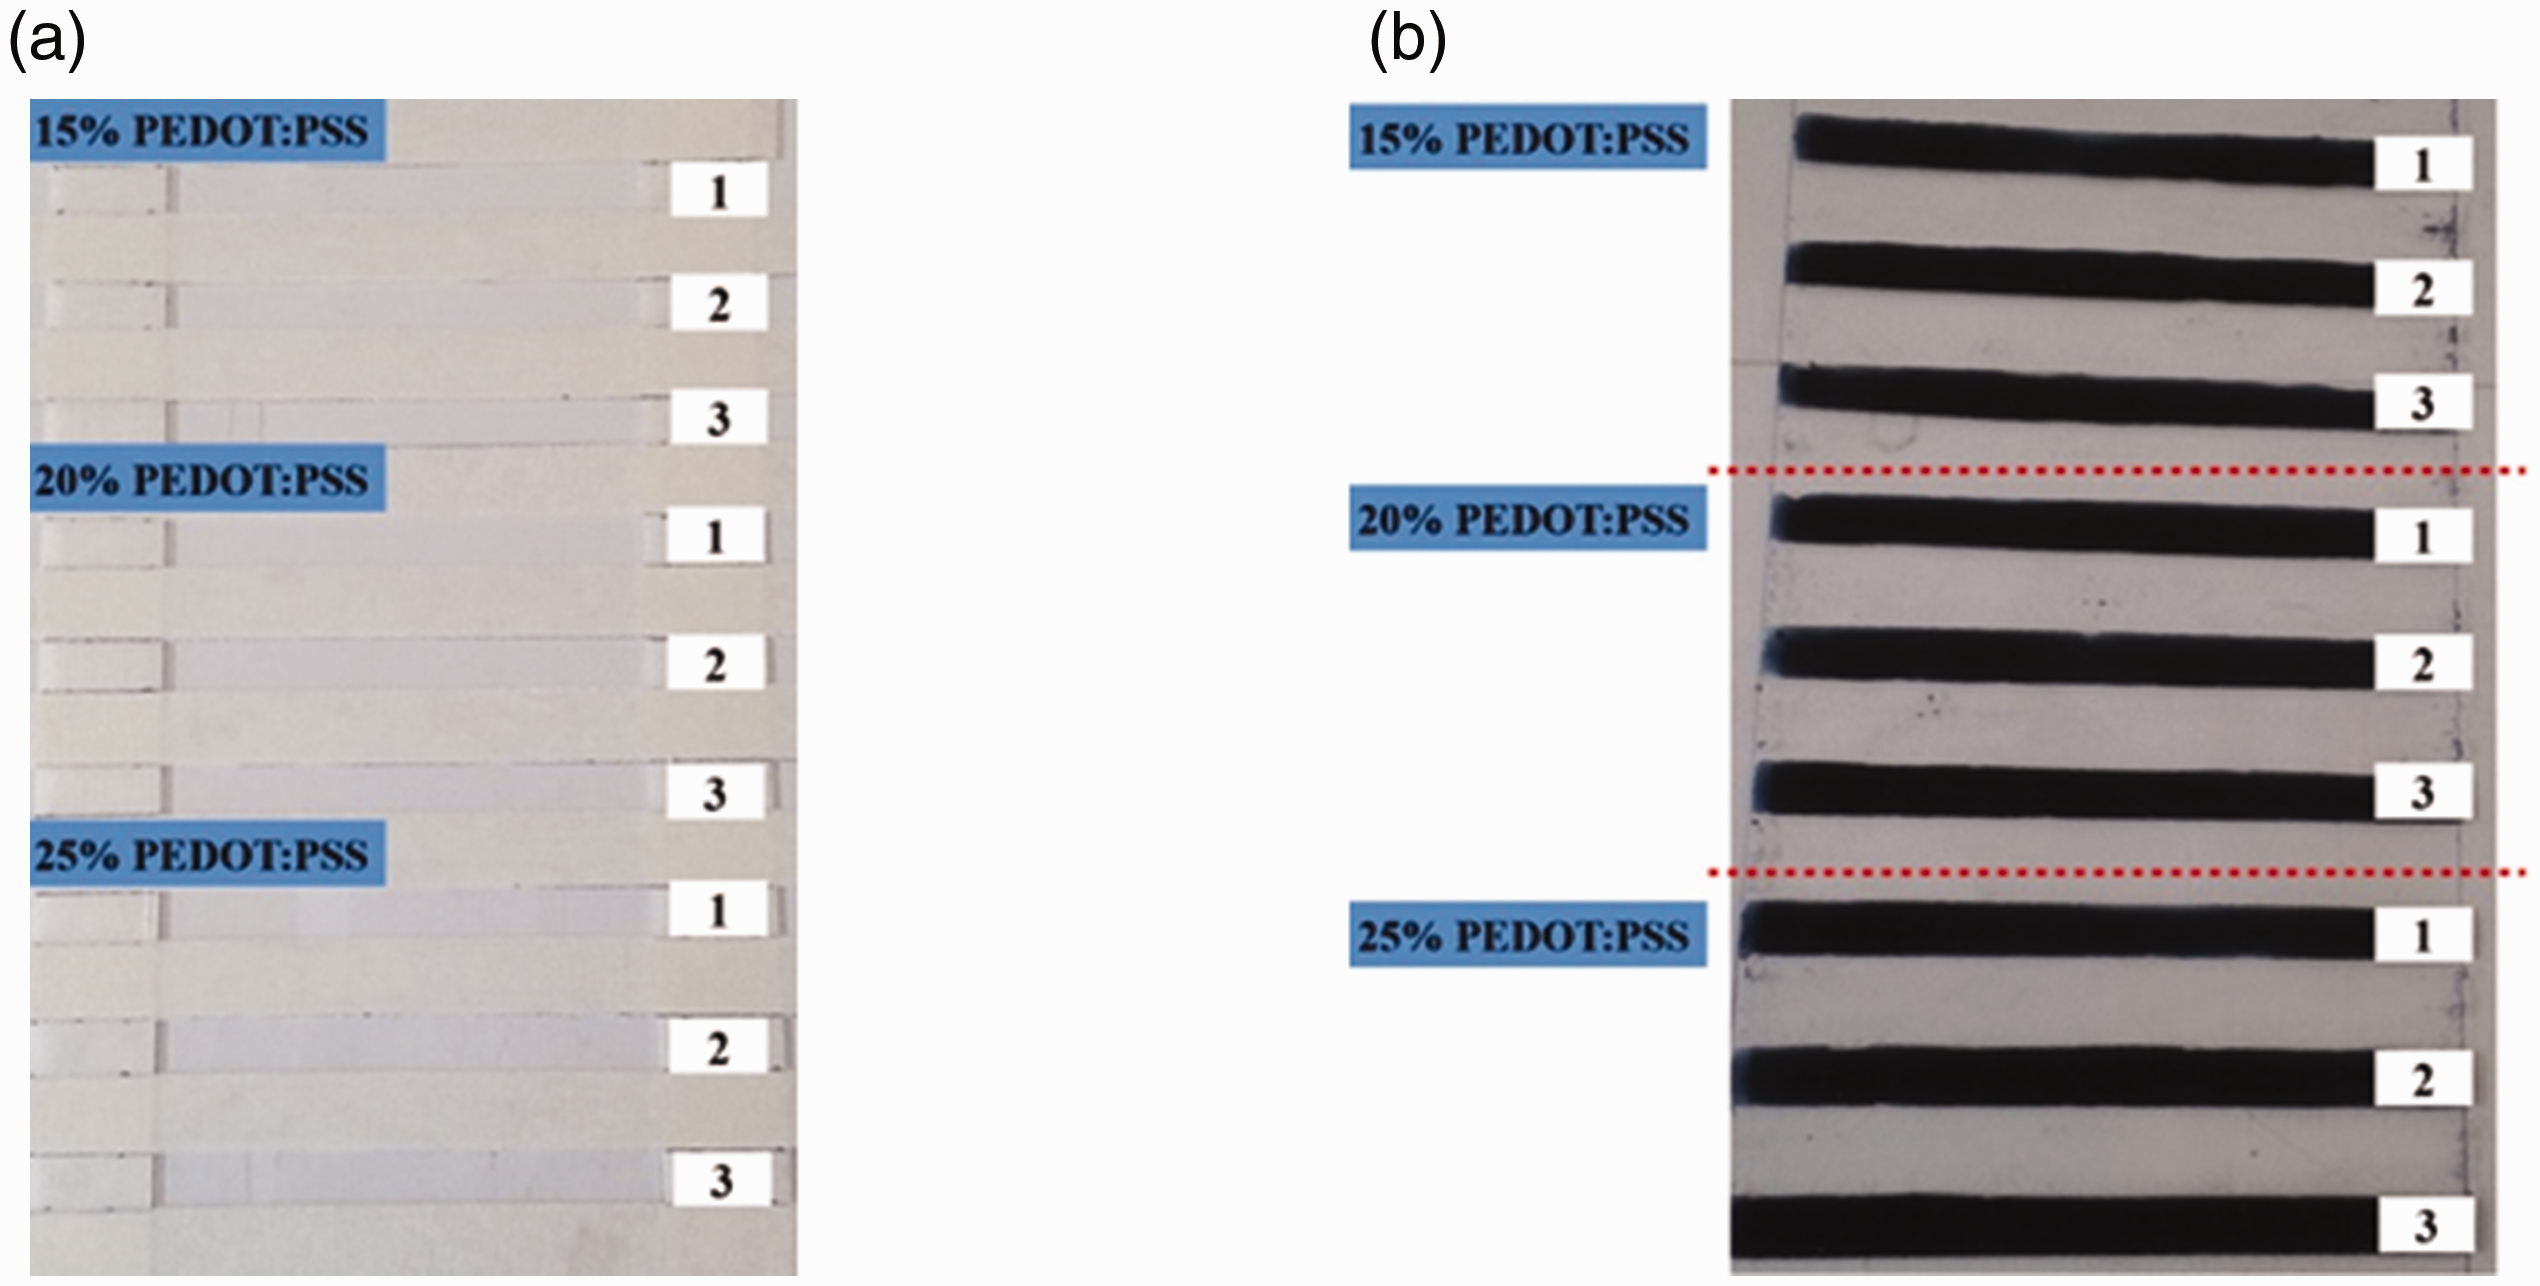
Conductive polymer film preparation for the percolation threshold study of aqueous dispersion A mixed with C: (a) frame preparation and (b) dry films prepared.
Silver drops (RS components, Corby, UK) were placed at 5 cm distance (D5) at each PEDOT:PSS conductive dry film (Figure 2(a)). For four films of interest prepared by aqueous dispersion A mixed with C or B mixed with C with 15% PEDOT:PSS and 100% PEDOT:PSS, silver drops were placed (Figure 2(b)) at the specific distances. Hence, the distances of these films important for their electrical resistance measurements were 1 cm, 2 cm, 3 cm, 4 cm, and 5 cm (D1, D2, D3, D4, D5).

Conductive dry film preparation: (a) the distance of 5 cm between silver points, (b) the distance of 1 cm, 2 cm, 3 cm, 4 cm, and 5 cm between silver points.
They were selected as “primary” films at the beginning of electrical resistance measurements of all films in a period of 75 days. The task was to check the dependence of electrical resistances of four films versus diverse distance points.
The electrical resistance of each dry film was measured by a standard Ohmmeter (Figure 3) to analyze their electrical resistance changes versus time and to calculate related electrical resistivities needed for the PEDOT:PSS percolation threshold determination.

The electrical resistance measurements of conductive dry films: (a) the distance of 5 cm between silver points and (b) the distance of 1 cm, 2 cm, 3 cm, 4 cm, and 5 cm between silver points.
In general, the electrical (volume) resistivity (Ω·m), is calculated from the electrical resistance, R, (Ω), the distance between two points, D (m), the width, l (m), and the thickness of the interested area, h (m) (equation (1))
In this work, the electrical resistivity of PEDOT:PSS conductive dry films is presented in Ω·cm.
Sensor yarns
A novel laboratory equipment, an aluminium roll-to-roll device with plexiglass bath (Figure 4), was developed for GF/PP, GF/PA66, and GF sensor yarns manufacture to ensure effective and equally distributed coating [3,23]. Sensor yarns were manufactured with only two PEDOT:PSS conductive coatings defined and applied according to roll-to-roll protocol between two protective coatings of acrylic ester copolymer described in detail in a previous study [3].

Conceptual design of laboratory equipment for roll-to-roll yarn coating: (a) side view [3] and (b) plot of rollers.
Morphological analysis of conductive dry films and sensor yarns
Morphological analysis of two PEDOT:PSS dry films defined based on the PEDOT:PSS percolation threshold study and sensor yarns was performed using Scanning Electron Microscope (SEM) instrument (MIRA\\LMU, Tescan, Brno, Czech Republic) that was operated at 3.6 kV and 5 kV at diverse magnification levels.
Results and discussion
Electrical resistance and resistivity of conductive dry films
The first group of PEDOT:PSS conductive dry films prepared by aqueous dispersion A mixed with C was realized with the thicknesses ranging from 7 µm to 166 µm while the second one prepared by aqueous dispersion B mixed with C with the thicknesses ranging from 21 µm to 169 µm (Figure 5).
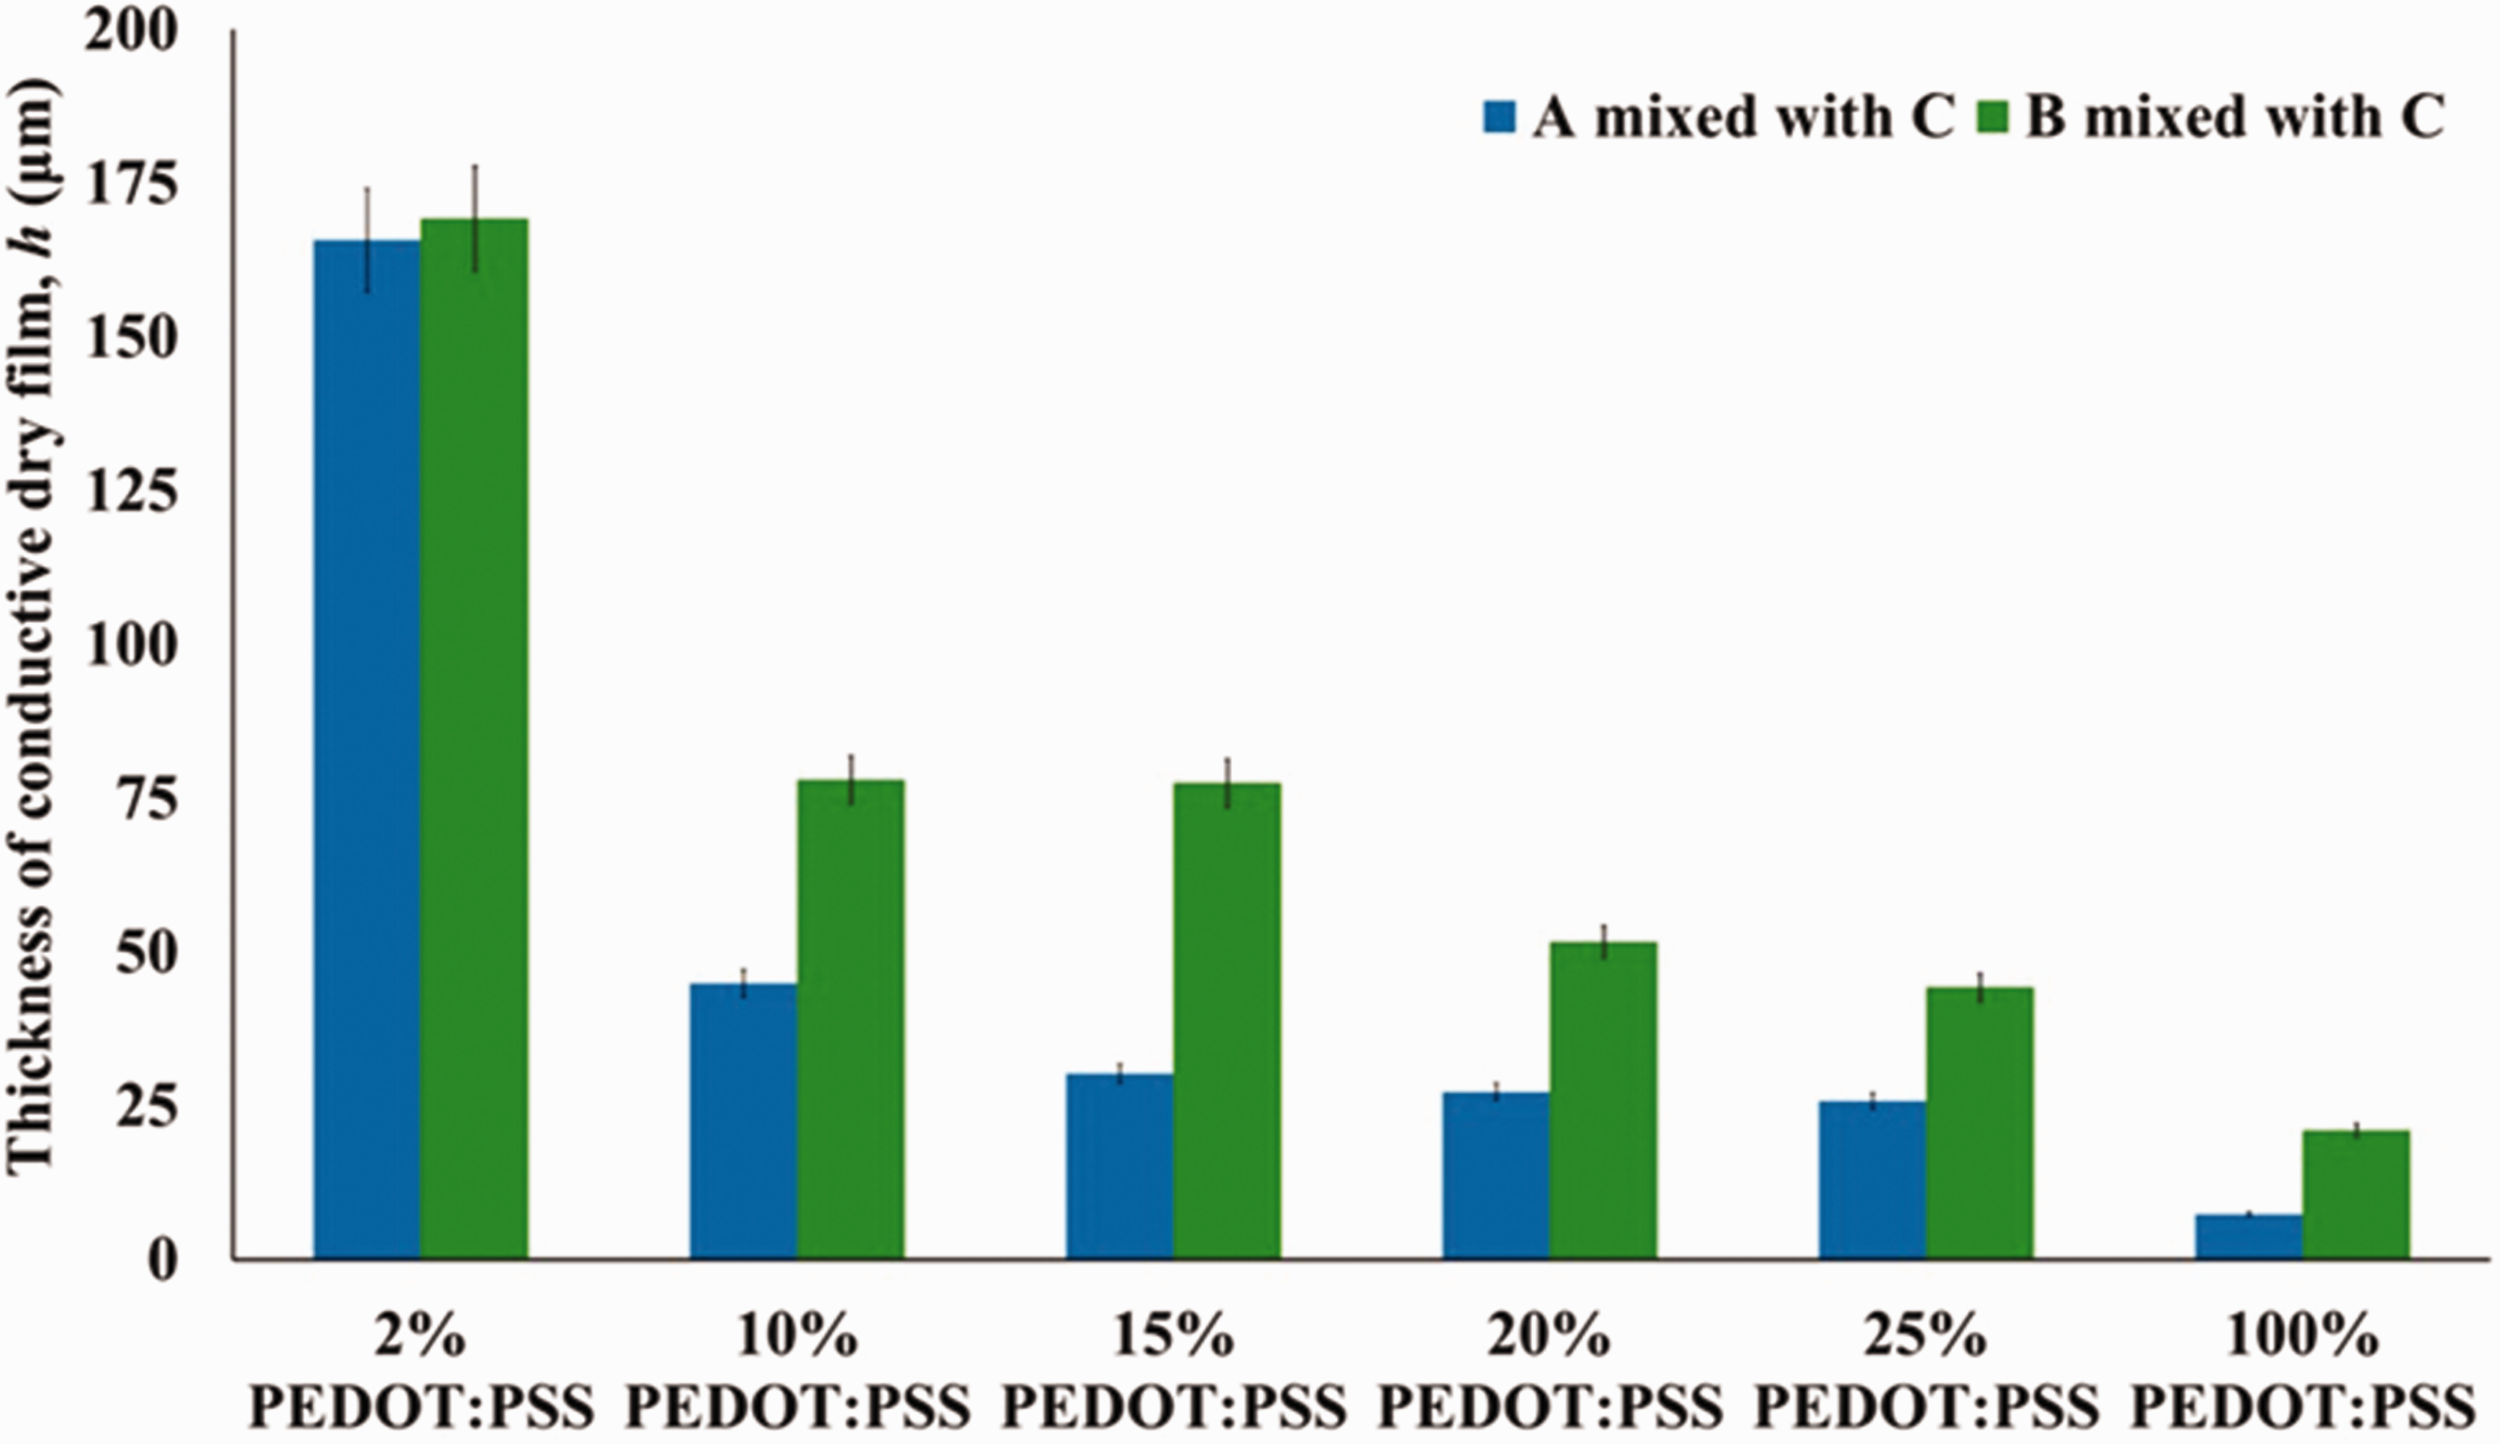
Conductive dry film thicknesses range for different PEDOT:PSS formulations in the aqueous conductive dispersions.
The evolution of the electrical resistance in 75 days of PEDOT:PSS conductive dry film monitoring at a distance of 5 cm between silver points is presented in Figure 6.

Electrical resistance of dry films prepared by aqueous conductive dispersion: (a) A mixed with C and (b) B mixed with C.
In general, electrical resistances of PEDOT:PSS conductive dry films decreased with their thicknesses decreasing. Critical days of slight electrical resistance changes of all films were 8 and 12 days, while notable changes were detected after 65 days. The first group of films developed (Figure 6(a)) were less stable in terms of electrical resistances measured at 5 cm during the observed period of 75 days compared with another group of films (Figure 6(b)).
Electrical resistivities of four selected dry films (equation (1)) prepared by aqueous dispersion A mixed with C or B mixed with C are presented in Figures 7 and 8.

Electrical resistivity of conductive dry films prepared by aqueous dispersion A mixed with C: (a) 15% PEDOT: PSS and (b) 100% PEDOT:PSS.

Electrical resistivity of conductive dry films prepared by aqueous dispersion B mixed with C: (a) 15% PEDOT: PSS and (b) 100% PEDOT:PSS.
Hence, the distance between silver points was shown as an important parameter for the electrical resistivity calculation of these films (equation (1)). A greater distance between silver points meant higher electrical resistance measured and a lower electrical resistivity (calculated) in almost all cases (from 1 cm to 3 cm distance).
In case of the first group of PEDOT:PSS conductive dry films, the distances of 3 cm, 4 cm, and 5 cm between silver points affected similar electrical resistance measurements. These distances resulted to the calculation of their electrical resistivities, 4 Ω·cm (6–12 days) and 7 Ω·cm (65–75 days) for 15% PEDOT: PSS conductive dry films (Figure 7(a)) while 1–2 Ω·cm (6–12 days) and 3–8 Ω·cm (65–75 days) for 100% PEDOT:PSS conductive dry films (Figure 7(b)).
In case of the second group of PEDOT:PSS conductive dry films, lower values of electrical resistivities were calculated at the distances of 3 cm, 4 cm, and 5 cm, 0.05–0.07 Ω·cm (6–12 days) and 0.07–0.12 Ω·cm (65–75 days) for 15% PEDOT:PSS conductive dry films (Figure 8(a)) while 0.03–0.06 Ω·cm (6–12 days) and 0.05–0.08 Ω·cm (65–75 days) for 100% PEDOT:PSS conductive dry films (Figure 8(b)).
According to the plotting percolation method [3], the logarithm of electrical resistivity values of PEDOT:PSS conductive dry films had to be figured to identify the PEDOT:PSS threshold in the percolation zone. Results showed that the appropriate ratio of the first formulation corresponded to the 15% PEDOT:PSS by monitoring the mixture of A (20 g) and C (1.47 g). The ratio of the second formulation corresponded to the 8% PEDOT:PSS by monitoring the mixture of B (20 g) and C (7.13 g) under strict conditions.
Morphological analysis of PEDOT:PSS conductive dry films and sensor yarns
Scanning electron micrographs of PEDOT:PSS conductive dry films prepared by aqueous dispersion A mixed with C, 15% PEDOT:PSS (thickness 30.60 µm ± 0.97 µm) and by aqueous dispersion B mixed with C, 8% PEDOT:PSS (thickness 135.67 µm ± 31 µm), are presented in Figure 9. Both conductive dry films had granular morphology. The second dry film showed a more homogeneous surface justifying its lower electrical resistivity [3]. This film had a higher thickness due to the low percentage of PEDOT:PSS and higher presence of acrylic ester copolymer in its composition.

Scanning electron micrographs of PEDOT:PSS conductive dry films (magnification of 1 kx): (a) 15% PEDOT:PSS and (b) 8% PEDOT:PSS.
Scanning electron micrographs of GF/PP, GF/PA66, and GF sensor yarns (cross sections) are shown in Figures 10 and 11. Although the same number of coating layers during sensor yarn preparation was applied (two conductive between two protective coatings) the coating thickness depended on the mass content of commingled yarn components. Hence, more glass in pristine yarns affected to a lower coating thickness; 128 ±40 µm for GF sensor yarn, 212 ± 39 µm for GF/PP sensor yarn, 234 µm ± 33 µm for GF/PA66 sensor yarn (mean of eight measurements). Accordingly, the higher coating thickness of GF sensor yarn was not possible to achieve. This is also in correlation with the interface phenomena and adhesion study. In the case of pristine yarn, the surface free energy (SFE) of GF was 74 mJm−2, while of GF/PA66 and GF/PP was 62 mJm−2 and 53 mJm−2 [2,28]. The SFE of PA66 and PP yarn filaments was 48 mJm−2 and 20 mJm−2. The highest SFE showed GF/PP sensor yarn, 48 mJm−2. Lower SFE of GF sensor yarn, 38 mJm−2, than expected, was occurred due to the high effect of polymer coating which in this case lowered SFE. The higher mass content of PA66, than PP mass content in GF/PP yarn and higher coating thickness, affected to SFE of GF/PA66 sensor yarn, 36 mJm−2.

Scanning electron micrographs of (magnification of 96×): (a) GF/PP sensor yarn and (b) GF/PA66 sensor yarn.

Scanning electron micrographs of (magnification of 95×) GF sensor yarn.
Taking into account holes detected at certain “locations” near the coating area of three groups of sensor yarns, due to coating procedure, their interfacial properties should be extensively studied to obtain more uniform and thinner coating formulation in order to avoid the appearance of similar holes in the next generation of sensor yarns. GF sensor yarn showed more uniform thin coating even by visual perception compared to GF/PP and GF/PA66 sensor yarns after their manufacture (Figure 12).

Sensor yarns: (a) GF/PP, (b) GF/PA66, and (c) GF.
Sensor yarns manufacture affected the “basic” yarn cross section. There are also several important factors in the manufacture operation that affected the final coating of sensor yarn; preparation and formulation of mixtures and roll-to-roll coating procedure (coating and drying processes of treated yarn).
Conclusion
Electrical resistance of PEDOT:PSS conductive dry films decreased with their thicknesses decreasing while notable changes were detected after 65 days of monitoring. The distance between silver points added on their surface was shown as an important parameter in their electrical resistivity calculation. Coating thicknesses of sensor yarns depended on the mass content of commingled yarn components. The glass component affected to the formation of a thinner PEDOT:PSS coating layer onto pristine yarn what is in correlation with interface phenomena and adhesion study done. As the future scope of this work, the interfacial properties of a new generation of sensor yarns prepared should be deeply considered in order to obtain a more unified coating and higher adhesion between coating and yarn treated.
Footnotes
Acknowledgement
The authors would like to thank the European Commission for the funding of the project.
Declaration of conflicting interests
The author(s) declared no potential conflicts of interest with respect to the research, authorship, and/or publication of this article.
Funding
The author(s) disclosed receipt of the following financial support for the research, authorship, and/or publication of this article: This work was supported by the EU project “MAPICC 3D” within the call NMP-FP7-2010-3.4-1 (Grant Number 263159) entitled: One-shot Manufacturing on large scale of 3D upgraded panels and stiffeners for lightweight thermoplastic textile composite structures.