
Abstract
This paper reports an experimental study on the damage evaluation of quartz woven fabrics during needle punching process under different needle punching densities. The straight fiber bundles begin appearing in Z direction at 50 punches · cm−2 and the “U-shaped” fiber bundles begin being observed at 210 punches · cm−2. The retention ratio of mean breaking force (RRMF) of the needle-punched quarts woven fabrics in warp direction decreases from 100% to 49.4% with an increase in needle punching density from 0 to 10 punches · cm−2, and that in weft direction decreases from 100% to 50.21% with the same increments in needle punching density, but the RRMF in warp direction decreases from 49.4% to 0.35% when the needle punching density increases from 10 to 245 punches · cm−2 and that in weft direction decreases from 50.21% to 0.19% with the same increments in needle punching density; obviously, the initial needle punching density increments (0 to 10 punches · cm−2) seem to have weakened tensile property more significantly compared with needle punching density increments from 10 to 245 punches · cm−2. The retention ratios in warp and weft directions are 0.61% and 0.34%, respectively, at 210 punches · cm−2, which are roughly equal with those at 245 punches · cm−2. Therefore, it could be concluded that the tensile property has reached the minimized at 245 punches · cm−2. In addition, there is an obvious paired similarity existing in the macro damage morphologies, the load–displacement curve trend at the adjacent needle punching density from 70 to 245 punches · cm−2 in 35 punches · cm−2 increments, also such similarity exists when the needle punching density is at 10 to 60 punches · cm−2.
Keywords
Introduction
At present, needle punching technology is widely used not only in making traditional nonwovens for oil absorption felt and composites reinforced with nonwovens but also in producing large liner preforms for the engine nozzle throat and other three-dimensional (3D) needle-punched preforms of composites due to its high produce efficiency, low-cost, and easily realizing the production of complex structure preforms [1–4]. In addition, the bars distributing on the needles could catch and pull the fibers downwards to the Z direction which is also the puncture direction; this special technological advantage makes the needle-punched 3D preform to have excellent peel strength of layers and then makes needle punching process to have wider applications [5]. Quartz fibers with the properties of low weight, high strength and high temperature resistance for making radomes have better dielectric properties compared with various glass fibers; therefore, the quartz fiber is widely applied in making radome for the planes, missiles, and ships. Chen et al. presented a path planning method of a six-joint needle punching robot which can be adjusted to different performs with different shapes; in addition, this method could be applied to robot tufting processes and composite Z-pin process [6].
So far a lot of experimental investigations have been done on the effect of needle punching parameters on the mechanical property of the woven fabrics. In the field of studying the effect of needle punching parameters on the mechanical property of the woven fabrics, Ji et al. investigated the X–Y direction tensile strength, peel-off stress in Z direction, and the Naval Ordnance Laboratory ring-integrated tensile strength of a carbon cloth/felt layer needled preform; from a serious of experiments, it could be obtained that the tensile strength decreased with the increasing of needle punching density (NPD) [7]. Yüksekkaya et al. found that the fabrics would shrink and the area density of the needled punched fabrics increased with an increasing in NPD by experimental measurement [8]. Kim et al. investigated the inter laminar shear strength (ILSS), Model I inter laminar fracture toughness (GIC), and the compression-after-thermal-shock strength (CAT) of the needle-punched preform/resin composites by the experimental measurement; from the experimental test, the ILSS and the GIC were found to increase markedly with increasing NPD, and the CAT increased with increasing NPD, while the relative CAT showed a maximum value around the ND of 50–150 punches · cm−2 [9]. Sun et al. studied the puncturing process of plain, 2/1 twill and 2/1 stain woven fabrics by using finite element method simulation, and then the load–displacement curves and woven damage morphology obtained from the experiments were compared with the results of the finite element model (FEM). Not only the puncturing damage morphology and pattern of the woven fabrics were analyzed but also the factors affecting puncturing were studied. The puncturing mechanism was illustrated and finally the research results were referred to design the woven structure with the higher strength [10]. Roy and Ishtiaque applied different NPDs, the depth of puncturing and needle punching frequency to puncture the felt, the correlation between the increase of NPD, the depth of puncturing, the change of felt area and thickness was illustrated [11].
Over the several past years, many studies have attempted to investigate the damage mechanism of fabrics during the needle punching process. Xie established the FEM of two-dimensional twill and nonwoven fabrics based on the concept of virtual and numerical fibers; the deformation and damage of quartz fabrics during the needle punching process were investigated by experimental and numerical methods; by analyzing the experimental and simulated results, resistance force of the single needle punching process could be predicted with satisfactory accuracy, and the fabrics deformation of the needle punching positions simulated was fairly close to the experimental observations [12]. Rao et al. modeled the impact of the rigid sphere onto the high-strength Kevlar plain woven by the FEM, and then the effect of different yarn properties and friction boundary on impact and puncturing for Kevlar plain woven was obtained [13]. Erlich et al. studied the quasistatic puncturing property of single layer fabric by the FEM; load–displacement curves were obtained by using different sharpness cones with 0.019–0.19 cm · s−1 and different boundary conditions loaded to puncture the Poly-P-Phenylene Benzobithia-zole woven, and three kinds of fabrics failure pattern including partly yarn breakage, edge yarn failure, and yarn pullout were observed [14]. Seyam et al. developed a device to dynamically measure the needle punching force at different locations in the needle board at high speeding; meanwhile, the method to break down the dynamic forces experienced by individual needles was proposed, then the penetration force, peak stripping force, penetration energy, and stripping energy were obtained by using signal analysis in time and frequency domains [15]. Watanabe et al. proposed a method to calculate the fiber quantities caught by a single bar in the needle roughly, and they also analyzed the relationship between the single bar force and the fiber quantities caught by the bar, and then they discussed the correlation between the tensile property of needle-punched felt and the above factors; this provided the ideas to undertake an in-depth study on the effect of needle punching behavior and fiber transferring on fabrics property [16]. Miao and Glassey characterized the fiber characteristic such as shape factor, orientation, and extent by using a minimum-width rectangle technique; the fiber geometry was further classified into hooks, straight fiber, U-shaped fiber, and loop entanglements. Fiber quantities with different shapes were recorded in the statistical experiment; in addition, by the methods of placing a layer of colored fibers in the feed web, collecting surface colored fibers after needle punched, and measuring the percentage of colored fibers with an optical fiber diameter analyzer, they observed that longer fibers were more likely to form hooks and the shorter fibers were more likely to form U-shaped and straight fibers. Finally, the experimental results indicated that the fiber breakage ratio and the strength loss ratio increased with the increase of needle NPD, and the first needle punching process caused the most serious damage on the fiber breakage ratio and the strength loss ratio [17–19].
However, the previous investigations were mainly focused on the effect of various needle punching parameters change on the fabrics mechanism properties at home and abroad, and the study on the fiber materials was mainly about carbon fibers [20–22]. The interval range of needle punching parameters discussed was not widely enough, little research attempted to analyze the morphology change of excellent mechanical quartz woven fabrics under single needle punching parameter in continuous increments. In addition, studies on the damage mechanism of needle punching also focused on all kinds of factors effecting puncture force and fiber numbers caught by the single needle bar; few studies have been done to analyze the correlation between needle punching mechanism and damage morphology; thus, the damage morphology and the change of tensile property could not be combined to explain each other, i.e. the reasons and the results were separate.
We aim to investigate the correlation between the NPD, damage morphology, and tensile property for the needle-punched quartz woven fabrics, expecting to provide advice and references for designing the needle punching preforms of 3D composite with the excellent mechanical and thermal properties.Therefore, by the way of applying different needle-punched density of 10–60 punches · cm−2 (at 10 punches·cm−2 increments), 70–245 punches · cm−2 (at 35 punches · cm−2 increments) to the quartz woven fabric, the damage morphology, tensile property of woven fabrics in warp and weft direction in the 3D needled composite preform were studied under a wide range of needle-punched densities. Zeiss stereomicroscope was used to gather the pictures which recorded the changes in the macro morphology of the experimental quartz woven fabrics with a wide needle-punched range between 0 punches · cm−2 and 245 punches · cm−2. Shimadzu AGS-250 KNE universal testing machine was used to test the tensile property of the quartz woven fabrics under different needle density values, which is significant for designing the excellent 3D needle punching preforms for the aerospace and civil industries.
Materials and methods
Needle-punched technology
Fibers were caught and transferred by the bars on the needles, which caused the fiber breakage and yarn deformation. The broken fibers were taken to Z direction on the back face and kept them in the position due to the bars opening downward. Therefore, yarn deformation on the front face and fiber prominence on the back face would be observed after penetrated. Figure 1 is the photo of the needle used in the needle punching process. The needle punching process is illustrated in Figure 2. The type of the needles used in the experiments was 15 × 18 × 36 × 3×C3332112 and the working part of the needles was triangular. The depth of the needle penetration is 14 mm and the orientation of the needles arranged in the needle plate is random.

The photo of the needle used in the needle punching process.

Schematic diagram of the needle punching process.
By the way of applying different needle-punched densities of 10–60 punches · cm−2 (in 10 punches · cm−2 increments), 70–245 punches · cm−2 (in 35 punches · cm−2 increments), and 0 punches · cm−2 to puncture the quartz woven fabrics, thus 13 different experimental groups were set up to establish the needle-punched damage evaluation of quartz woven fabrics with increasing NPD, i.e. only NPD was taken as variables and other needle punching parameters were kept constant.
Materials
Twill 2/1 quartz woven fabrics were provided by Hubei Feilihua Quartz Glass Co. Ltd, China. Table 1 shows the detailed characteristics of the quartz woven fabrics.
Details of the experimental quartz woven fabrics.

Tests
Morphology observation
The damage morphology of the needle-punched quartz woven fabrics was observed by using Zeiss Stemi 2000-C stereomacroscope; thus, the continuous change of the morphology on the front and back faces of the needle-punched quartz woven fabrics was recorded. Moreover, the distribution of the needle punching points was simulated by using SOLIDWORKS software to explain the change of damage morphology for the needle-punched fabrics, the correlation between the NPD and damage morphology was established. Figure 3 shows the process of observing the macro damage morphology.

Macro damage morphology observation.
Tensile property test
The load–displacement curves and tensile breaking forces of the needle-punched fabrics in warp and weft directions at 0–245 punches · cm−2 were measured and recorded by using Shimadzu AGS-250 KNE universal testing machine. The load–displacement curves and the change of tensile breaking force would be analyzed together with the damage morphology of needle-punched quartz woven fabrics, and also the load–displacement curves could be used to explain the tensile failure morphology. Further, the correlation between the NPD, damage morphology, and tensile property of the needle-punched quartz woven fabrics at 0–245 punches · cm−2 was established. Figure 4 shows the tensile test process and Table 2 shows the tensile test parameters and tensile samples.
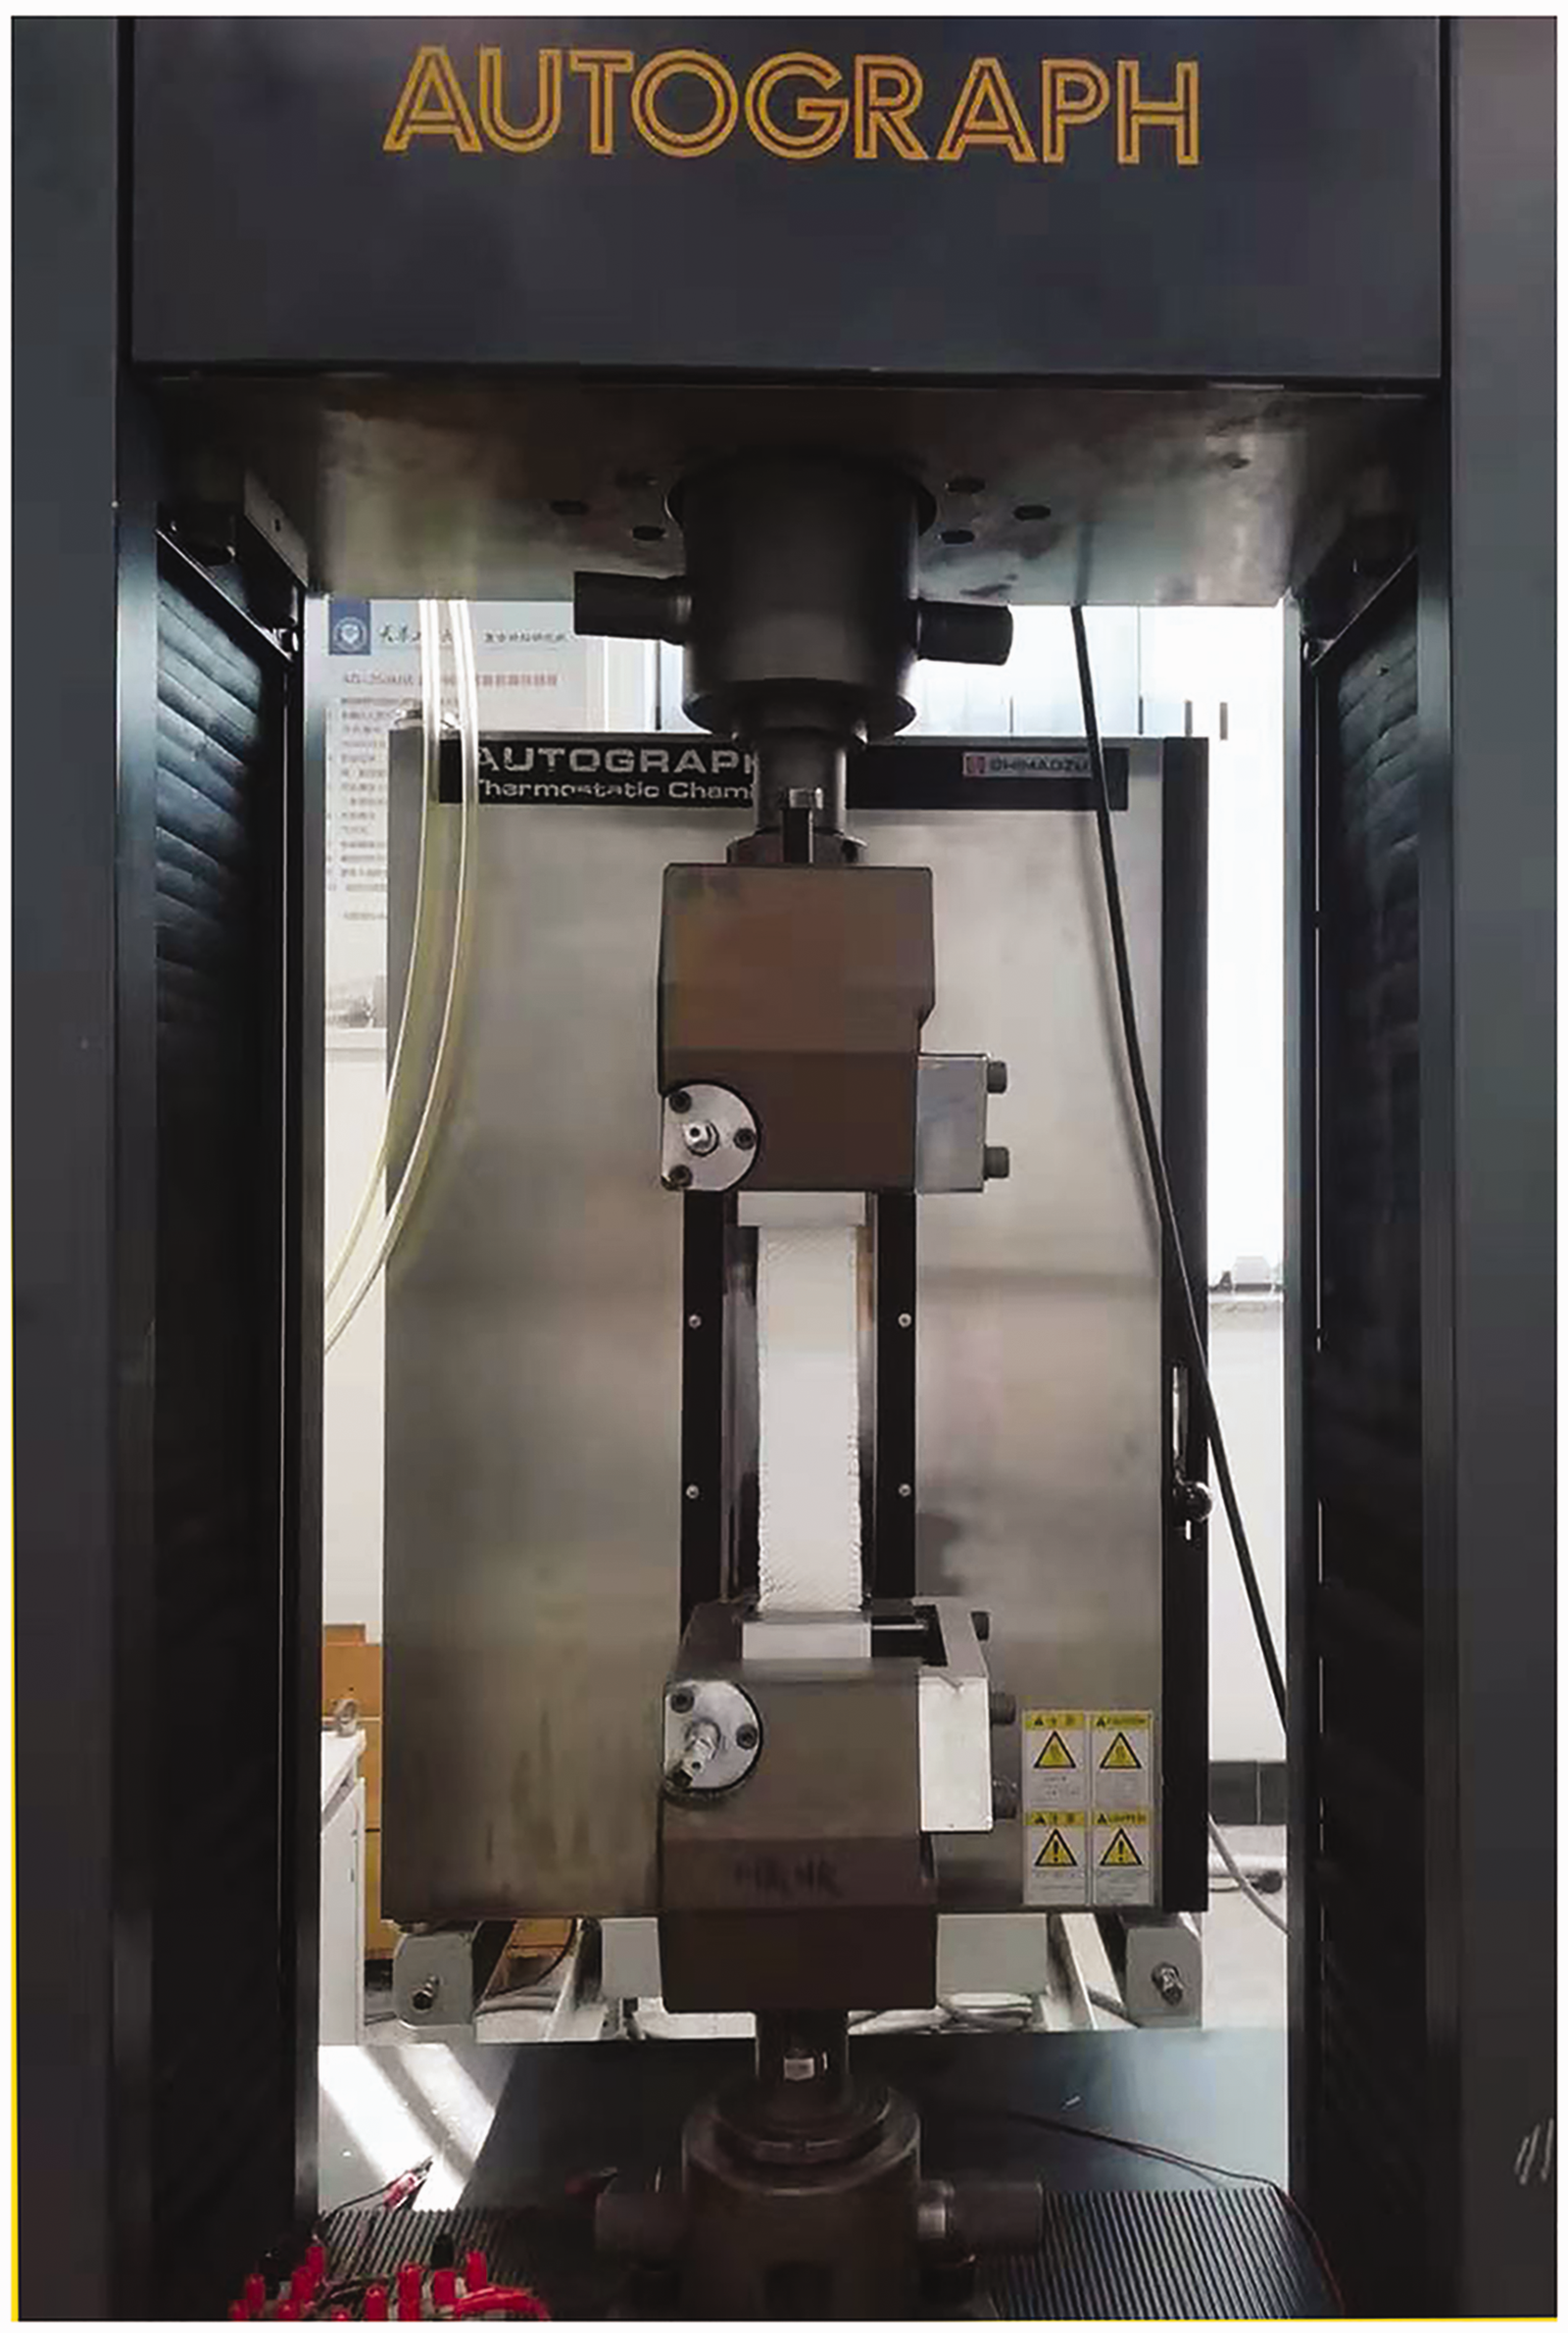
Schematic diagram of the tensile test.
Tensile test parameters and tensile samples.

Results and discussion
Damage morphology analysis
Distribution of the needle-punched points and macro damage morphology on front face of the needle-punched quartz fabrics
The morphology of quartz woven fabrics at zero punches · cm−2 is shown in Figure 5. Distribution images of the needle-punched points were obtained by applying SOLIDWORKS software to simulate the distribution of the needle-punched points. Distribution of the needle-punched points at 10–60 punches · cm−2 (in 10 punches · cm−2 increments) is shown in Figure 6 and macro damage morphologies with the same NPD interval are provided in Figure 7. As is shown in Figures 6 and 8, the area for each of the sub-graphs is 1 × 1 cm2 containing five warp yarns and seven weft yarns. It can be observed clearly from Figure 6(a) that there are 1 to 3 points in a single warp yarn in 1 diameter long, and there is 1 to 2 points in a single weft yarn within the same length; such punching point distribution at 10 punches · cm−2 straightly leads to the macro morphology, which shows no obvious fiber breakage as shown in Figure 7(a) compared with that shown in Figure 5 at zero punches · cm−2. As is shown in Figure 6(b) to (d), the number of needle punching points in unit area fabrics (or in unit length yarn) increases with the increasing NPD from 20 punches · cm−2 to 40 punches · cm−2, and also the same increase in NPD causes more broken fibers and gaps in yarns as illustrated in Figure 7(b) to (d) compared with that shown in Figure 7(a). Of particular note is that the needle punching point distribution begins to occur at point overlap, as marked and shown with a red circle in Figure 6(e). Actually the point overlap means one same position in the fabrics would be punched repeatedly, and this can cause damage accumulation in this position, i.e. this causes more and more fiber breakage and gaps as shown and marked with black rectangles in Figure 7(e). With an increase in NPD from 50 to 60 punches · cm−2, the patterns of needle-punched point overlap in unit area marked in red circles as shown in Figure 6(f) are more than that shown in Figure 6(e), and more overlap patterns in unit area shown in Figure 6(f) are reflected in Figure 7(f) showing that the looseness and thinness of the yarns marked with a black rectangle compared with Figure 7(a) to (e).

Macroscopic image of quartz woven fabrics at zero punches·cm−2.
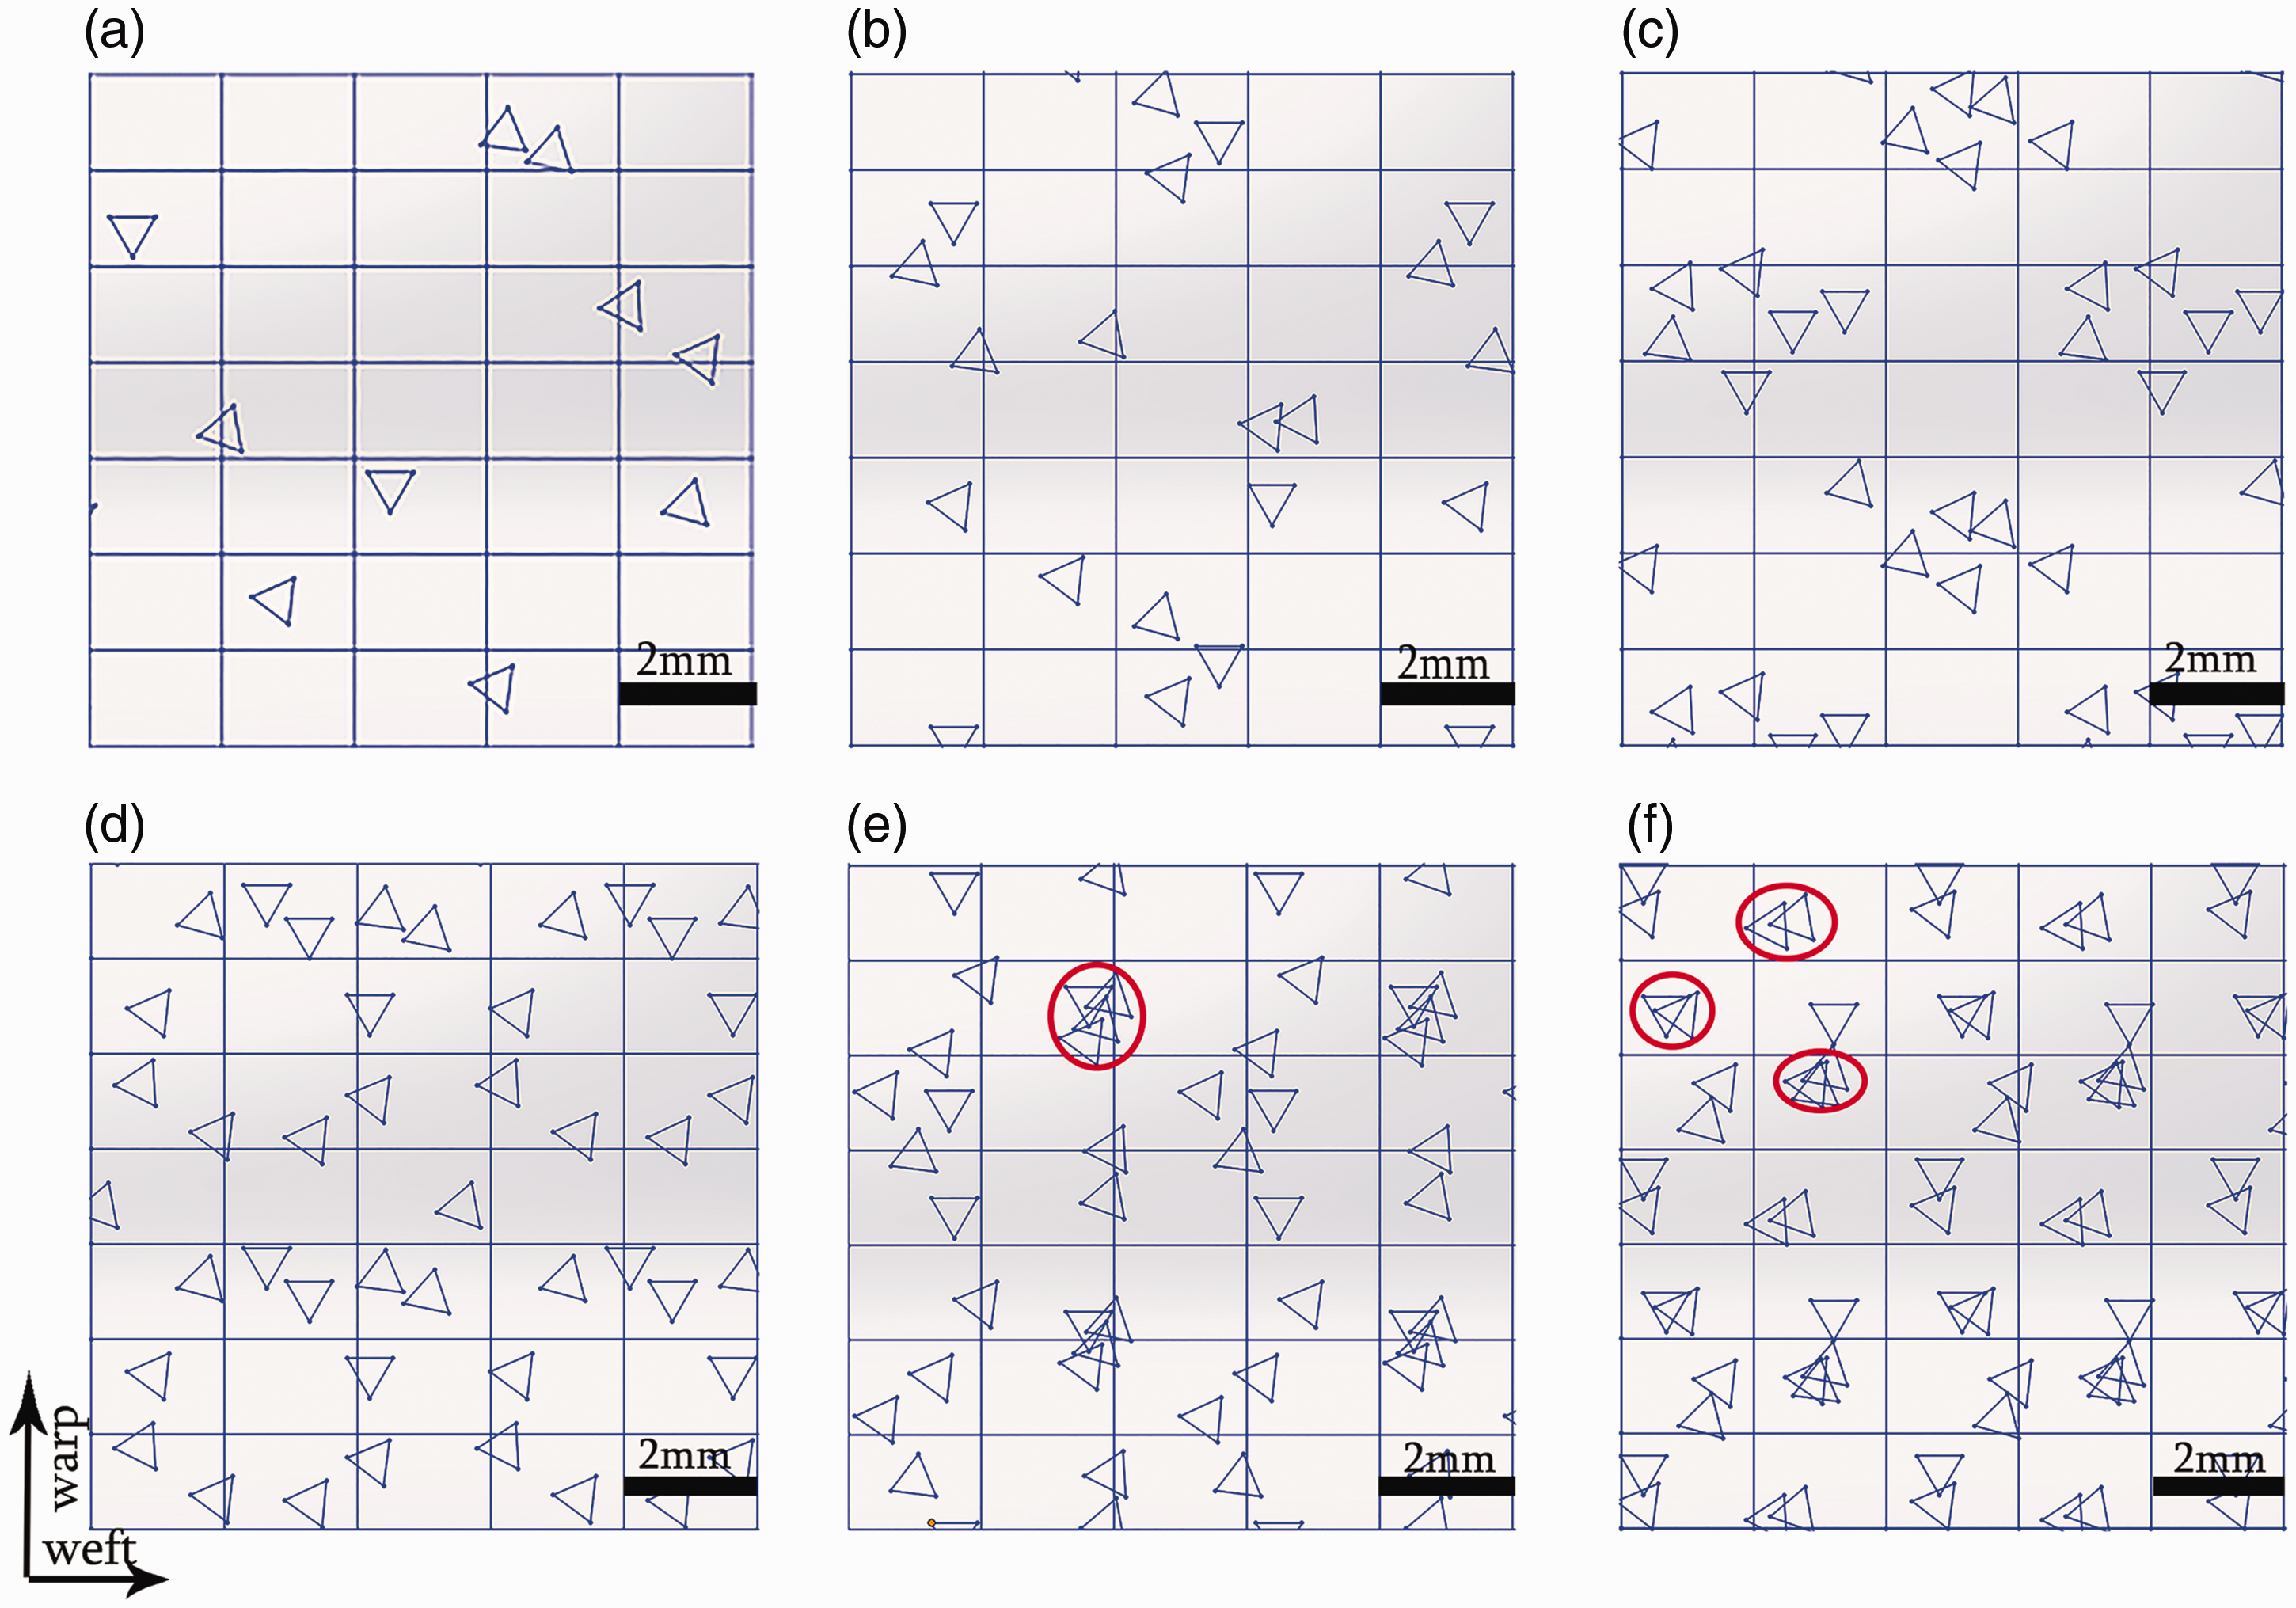
Distribution image of the needle-punched points with different NPDs: (a) 10 punches·cm−2, (b) 20 punches·cm−2, (c) 30 punches·cm−2, (d) 40 punches·cm−2, (e) 50 punches·cm−2, (f) 60 punches·cm−2 at 10 punches·cm−2 increments.

Macroscopic damage morphologies of quartz fabric with different NPDs: (a) 10 punches·cm−2, (b) 20 punches·cm−2, (c) 30 punches·cm−2, (d) 40 punches·cm−2, (e) 50 punches·cm−2, (f) 60 punches·cm−2 at 10 punches·cm−2 increments.

Distribution image of the needle-punched points with different NPDs: (a) 70 punches·cm−2, (b) 105 punches·cm−2, (c) 140 punches·cm−2, (d) 175 punches·cm−2, (e) 210 punches·cm−2, (f) 245 punches·cm−2 at 35 punches·cm−2 increments.
In comparison with that shown in Figure 5, no obvious distinction in the macro damage morphology is witnessed ranged from 10 to 60 punches · cm−2 as illustrated in Figure 7. However, in Figure 8 it can be observed that the area of needle-punched point overlap is larger than that shown in Figure 6, i.e. one position in the quartz woven fabrics at 70 punches · cm−2 to 245 punches · cm−2 receives more times punching compared with the fabrics at 10 to 60 punches · cm−2.
Therefore, the damage degree of the needle-punched quartz fabrics as shown in Figure 9 is observed to be more serious than that shown in Figure 7(a) to (f). Specifically, as is shown in Figure 8(a) and (b), the point overlap regions marked with red circles show a relatively dispersed distribution state compared with that shown in Figure 6(e) to (f); meanwhile, it also can be observed that single overlap region marked with a red circle in Figure 8(a) and (b) contains two to four needle punching points. Such distribution of the overlap regions causes the fiber bundle bending accompanied with fiber breakage marked with black dotted lines as shown in Figure 9(a) and (b), but no significant difference in the damage morphology is observed between Figure 9(a) and (b); with an increase in NPD from 140 to 175 punches · cm−2, the area of the point overlap region further becomes larger as shown in Figure 8(c) and (d) compared with Figure 8(a) and (b). Furthermore, the single overlap region marked with the red circle containing 2 to 5 points can be observed in Figure 8(c) and (d). Such distribution of the needle punching points shown in Figure 8(c) and (d) finally creates more broken fibers and further causes fiber fuzz as shown in Figure 9(c) and (d). When the NPD reaches 210 punches · cm−2, it can be observed clearly in Figure 8(e) that there are 16 points overlap regions distributing in the unit area.

Macroscopic damage morphologies of quartz fabric with different NPDs: (a) 70 punches·cm−2, (b) 105 punches·cm−2, (c) 140 punches·cm−2, (d) 175 punches·cm−2, (e) 210 punches·cm−2, (f) 245 punches·cm−2 at 35 punches·cm−2 increments.
Moreover, as is shown in Figure 8(f), the points overlap regions are connected with each other and the needle punching points almost fill the unit area, such serious needle punching points overlap means same serious damage accumulation; similarly, the damage morphologies illustrated in Figure 9(e) and (f) present more significant fiber fuzz, yarn becoming thinner and weave structure becoming loose. Based on the analysis in Figures 8 and 9, it could be concluded that the macro damage morphology at 70 to 245 punches · cm−2 on the front face of the quartz woven fabrics can be summarized in three different damage patterns as follows: the fiber bundle blending at 70 and 105 punches · cm−2 as shown in Figure 9(a) and (b), the fiber fuzz at 140 and 175 punches · cm−2 as shown in Figure 9(c) and (d), more significant fiber fuzz and thinner yarns at 210 and 245 punches · cm−2 as shown in Figure 9(e) and (f).
The overlap of the needle punching points occurs at 50 punches · cm−2 and obvious gaps in the yarn are observed at 50 punches · cm−2; the point overlap means damage accumulation, with the increasing in NPD from 50 to 245 punches · cm−2, the overlap degree of the needle-punched points becomes more and more serious as shown in Figures 6 and 7; in other words, the damage accumulation becomes more serious, and also the damage degree becomes more serious; the damage morphologies are classified into three different forms as shown in Figure 9: the blending of the fiber bundles at 70–105 punches · cm−2, fiber fuzz at 140–175 punches · cm−2, and more serious fiber fuzz accompanied with yarn becoming thinner at 210–245 punches · cm−2.
Macro damage morphology on the back face of the quartz woven fabrics
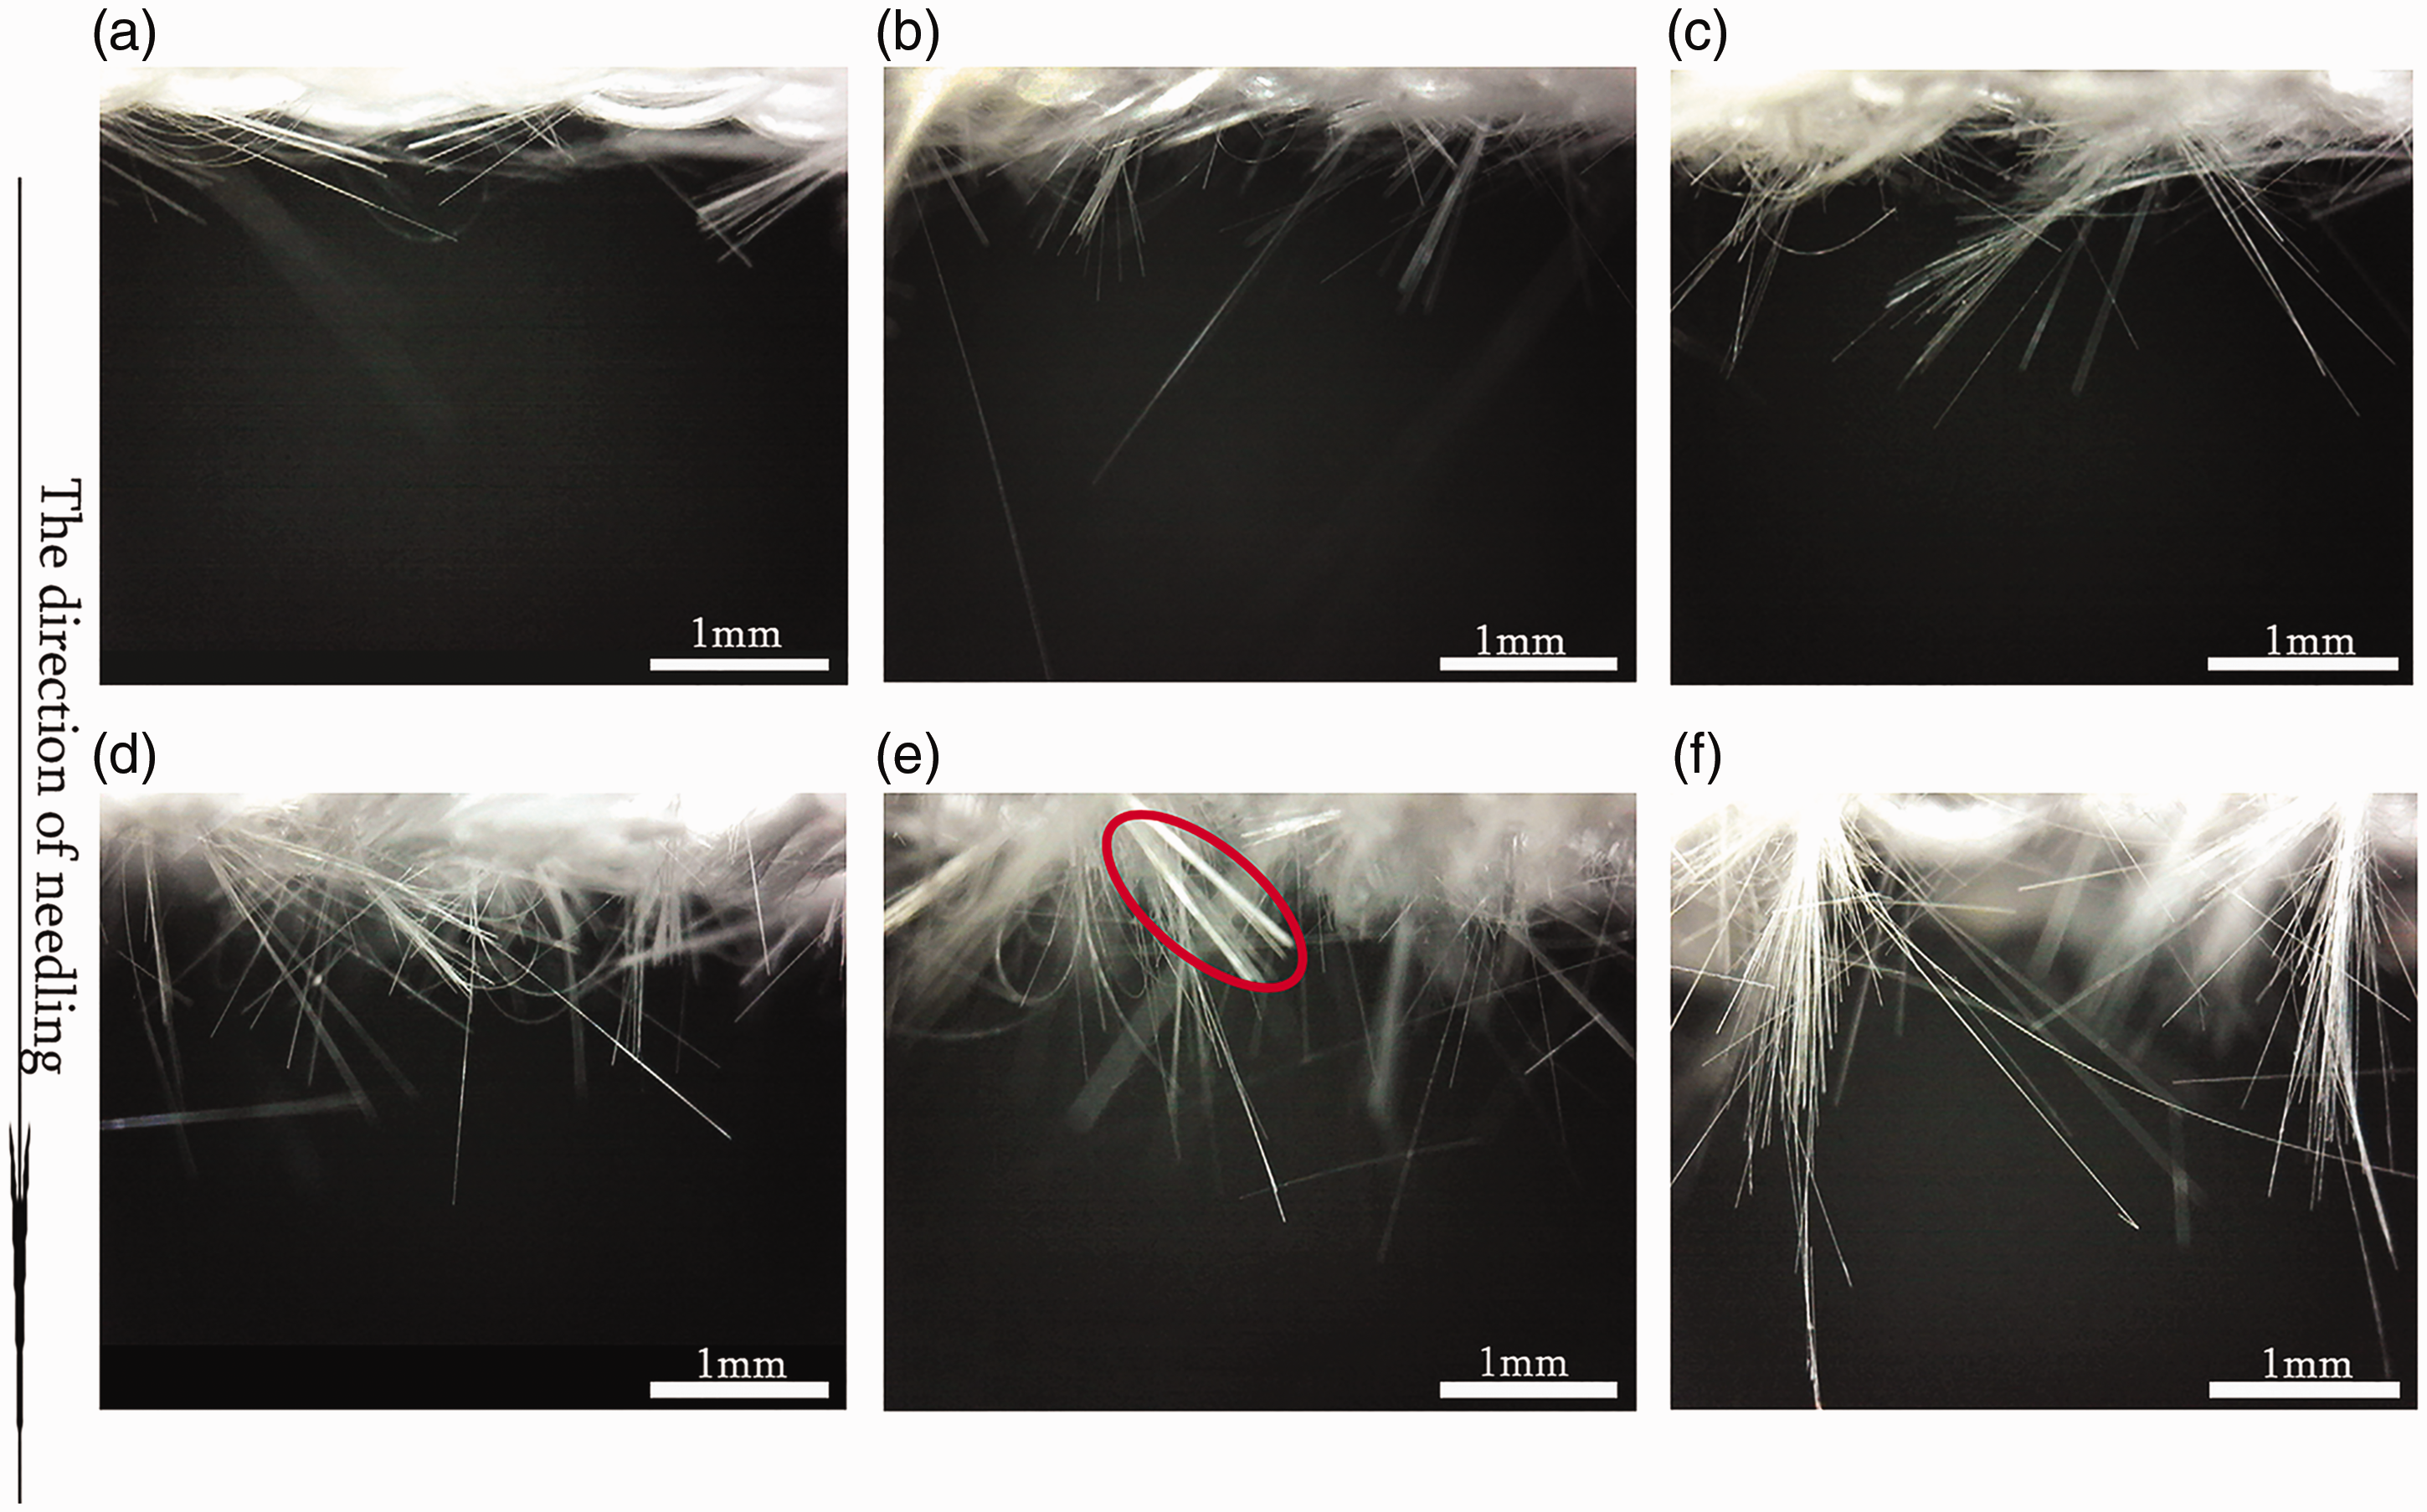
Fiber distribution in the Z direction out of the fabrics plane on the back face of the fabrics is due to the fibers caught and pulled by the bars in the needles downwards to the Z direction. In addition, the forms of the fiber distribution in the Z direction present three different distribution morphologies: a few of fiber prominence, the obvious prominence of the linear fiber bundles, and the U-shaped fiber bundle prominence accompanied with protruding fiber bundles. It can be observed that the number and length of protruding fibers increase with the increase in NPD from 10 to 245 punches · cm−2 as shown in Figures 10 and 11. Specifically, as is shown in Figure 10(a) to (d), the length and the number of the protruding fibers increase at 10–40 punches · cm−2.
Fiber distribution morphologies of quartz fabric in Z direction with different NPDs: (a) 10 punches·cm−2, (b) 20 punches·cm−2, (c) 30 punches·cm−2, (d) 40 punches·cm−2, (e) 50 punches·cm−2, (f) 60 punches·cm−2 at 10 punches cm−2 increments.

Fiber distribution morphologies image of quartz fabric in Z direction with different NPDs: (a) 70 punches·cm−2, (b) 105 punches·cm−2, (c) 140 punches·cm−2, (d) 175 punches·cm−2, (e) 210 punches·cm−2, (f) 245 punches·cm−2 at 35 punches·cm−2 increments.
Meanwhile, no significant fiber bundle prominence is observed in Figure 10(a) to (d) due to no needle punching point overlap at 10–40 punches · cm−2 as shown in Figure 6(a) to (d). However, it can be observed that the protruding linear fiber bundle as marked with a red circle and illustrated in Figure 10(e) begins to occur.
The forming of the fiber bundle is due to the needle punching point overlap at 50 punches · cm−2, as shown in Figure 6(e), and further to forming the fiber damage accumulation in point overlap position in the fabrics; finally, such fiber damage accumulation creates the breaking “position A” in the yarn as shown in Figure 12. The graphical representation of schematic diagram of the forming protruding linear fiber bundles is shown in Figure 12, the needle moves downwards to reach the point “a” and then the broken fiber bundle is caught and pulled downwards by the bars in the needle, and finally the protruding fiber bundle forms as shown in Figure 12. It can be observed clearly in Figures 10(e) and (f) and Figure 11 that the protruding fiber bundles exist ranged from 50–245 punches · cm−2 due to the needle punching point overlap as shown in Figures 6(e) and (f) and Figure 8. Furthermore, the number and the length of the protruding fiber bundle increase since the overlap area of the needle punching points becomes larger, and the increasing of the point overlap area means that the fiber damage accumulation becomes more and more serious. Actually, such serious fiber breakage accumulation contains two aspects of the damage characteristics: one is more and more fiber breakage positions in unit length yarn (or in unit area fabrics) and the other one is more and more broken fibers in the same size range of the yarns or fabrics. Fiber damage accumulation creates serious damage and further causes the decrease of the binding force between the yarns gradually. Eventually, this causes fiber fuzz and yarn looseness on the front face of the needle-punched quartz fabrics as shown in Figure 9(e) and (f), such fiber damage accumulation has also formed the U-shaped fiber bundle as shown in Figure 11(e) and (f).
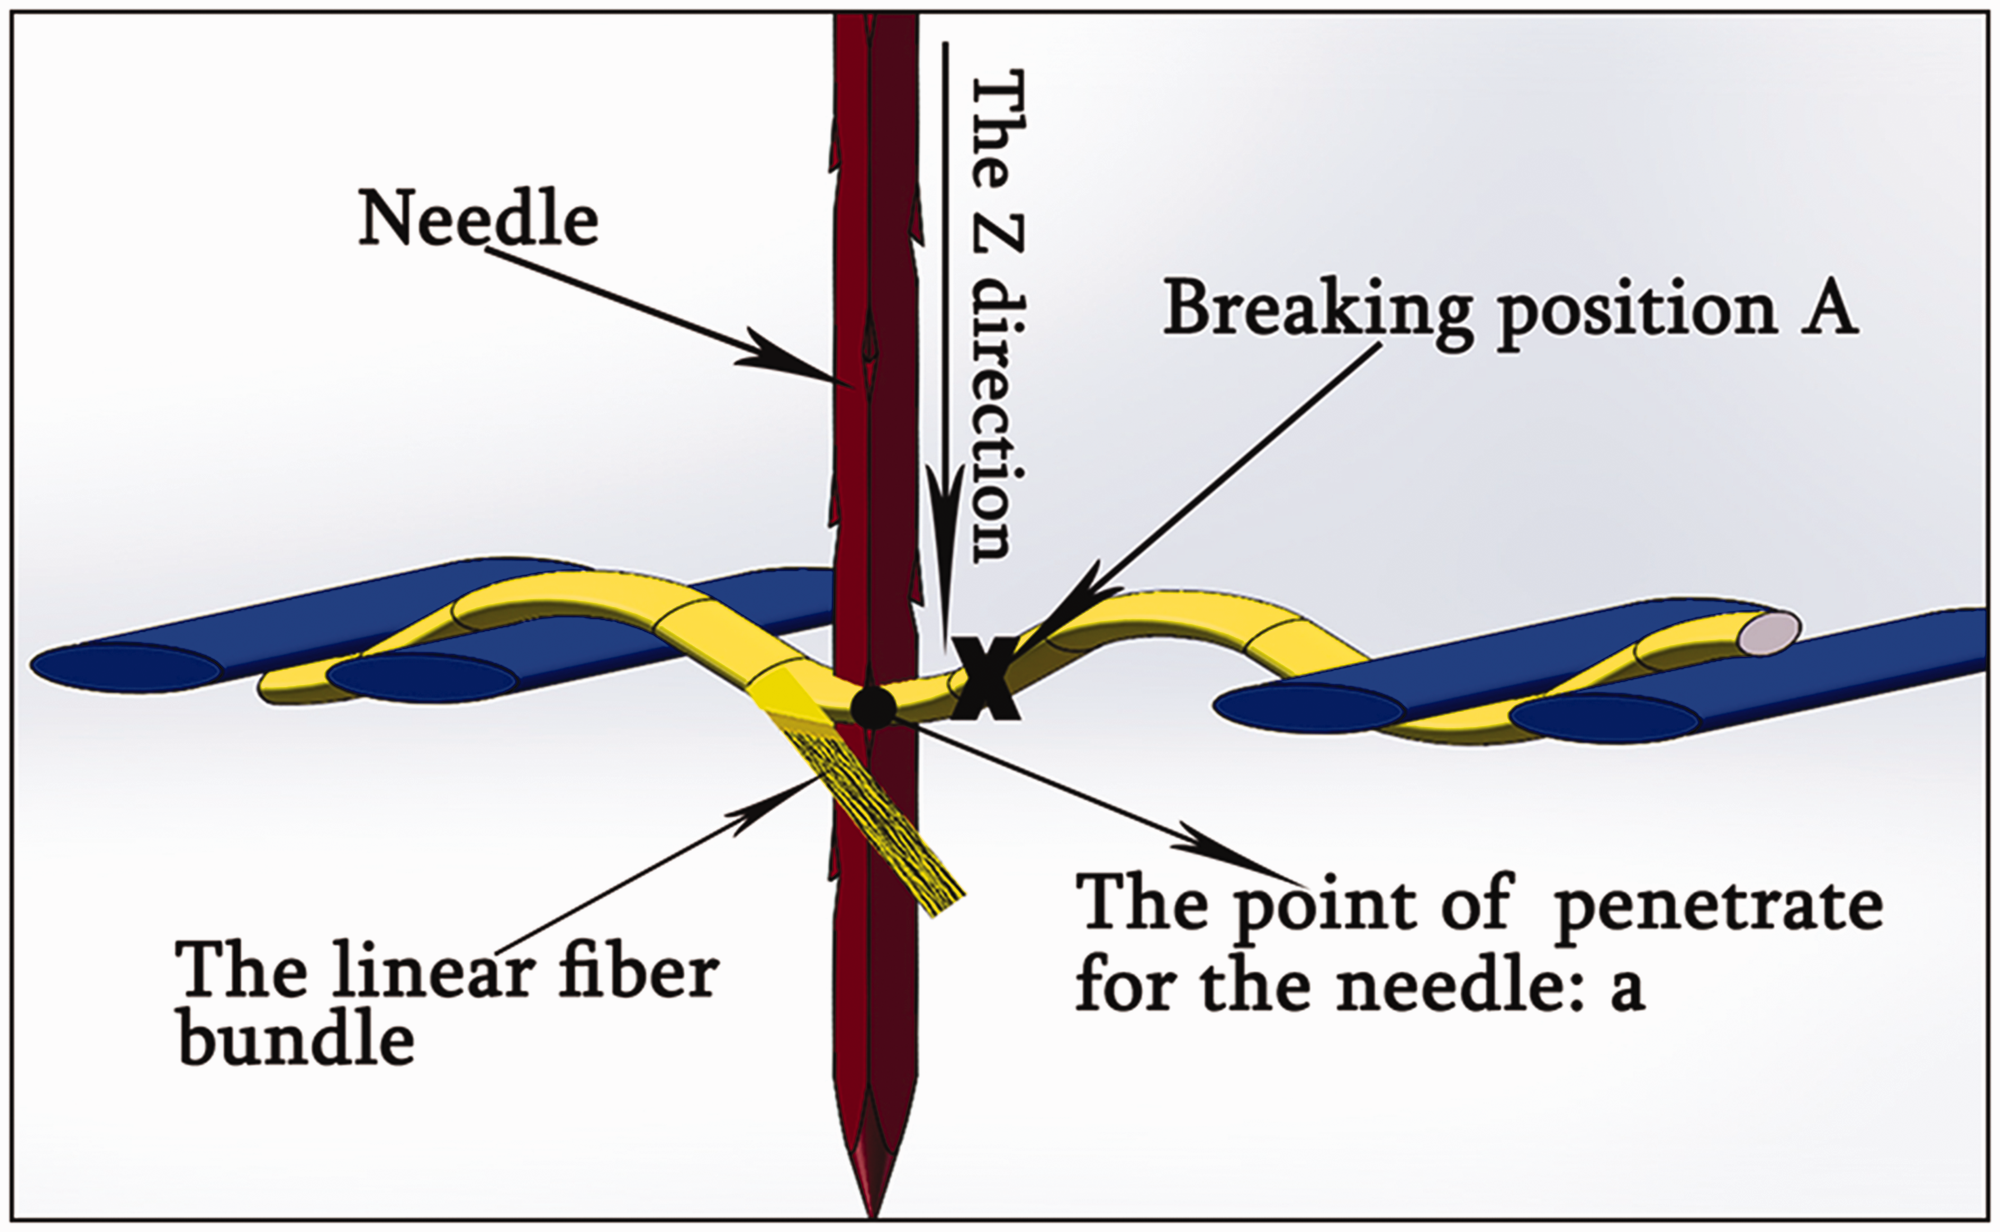
Schematic diagram of the forming protruding linear fiber bundle.
As is shown in Figure 11(e) and (f), the protruding U-shaped fiber bundles marked with circles can be seen clearly, and Figure 13 sketches the forming mechanism of the U-shaped fiber bundles. As we can see in Figure 13, more fiber bundle breakage positions (breaking position B1 and B2) and less binding yarns compared with those shown in Figure 12 are observed visually; the needle moves through the point “b” in the yarn and then catches the fiber bundle; there are at least two breakage positions distributing both sides of point “b”; and the fiber bundle caught by the needle has few binding force due to the position B1 and position B2 as shown in Figure 13.

Schematic diagram of the forming protruding U-shaped fiber bundle.
Therefore, the fiber bundle can be easily pulled away from the yarn, and eventually it deforms into the U-shaped fiber bundle as shown in Figure 12. From the comparison of those illustrated in Figures 12 and 13, we can conclude that the higher the NPD is, the more U-shaped fiber bundles are. Likewise, the fiber distributing patterns at 70 and 245 punches · cm−2 on the back face of the quartz woven fabrics could be classified into three different kinds of distributing macro morphologies as follows: the significant linear fiber bundles at 70 and 105 punches · cm−2 as shown in Figure 11(a) and (b), the longer and more fiber bundles at 140 and 175 punches · cm−2 as shown in Figure 11(c) and (d) which are compared with that shown in Figure 11(a) and (b), the U-shaped fiber bundle at 210 and 245 punches · cm−2 as shown in Figure 11(e) and (f).
A few of fiber prominence occurs at 10–40 punches · cm−2; obvious prominence of the linear fiber bundles can be observed at 50–175 punches · cm−2; moreover, both the amount of fiber bundle and the length of that increase with the increasing in NPD from 50 to 175 punches · cm−2; the U-shaped fiber bundle prominence accompanied with protruding linear fiber bundles at 210–245 punches · cm−2 can be seen in Figure 11(e) and (f).
Tensile property and tensile samples failure analysis at 0–245 punches · cm−2
Tensile property analysis
Tensile property test is based on test methods for woven fabrics of reinforced materials in GB/T 7689.5-2013 – part 5: determination of tensile breaking strength and breaking elongation of glass fibers. Tensile samples are classified into 13 different groups based on the different NPDs (zero punches · cm−2, 10–60 punches · cm−2 in 10 punches · cm−2, 70–245 punches · cm−2 in 35 punches · cm−2, and thus a total of 13 different NPD values are used in the needle punching process); in addition, one experimental group with a determined NPD value has two directions including warp and weft directions; thus, there are 26 tensile testing groups with 130 samples due to five tensile samples in a single group totally.
Figure 14(a) gives the mean load–displacement curves in warp direction at 0–245 punches · cm−2 and Figure 15(a) shows those in weft direction, but the tendency of the curves in Figures 14(a) and 15(a) cannot be observed clearly; thus, the curves in Figures 14(a) and 15(a) at 0–245 punches · cm−2 are allocated to three diagrams as shown in Figure 14(b) to (d) and Figure 15(b) to (d), respectively. A similar tendency with rapidly reaching the load peak and then “cliff-like” falling to a sudden stop is observed in Figures 14(b) and 15(b), and such tendency is consistent with the tensile test phenomenon that the needle-punched quartz fabrics at 0 and 10 punches · cm−2 were stretched to be tight rapidly and then all yarns along the tensile direction snapped instantaneously; moreover, such tensile test phenomenon (or such curve tendency) at 0 and 10 punches · cm−2 can also be explained as shown in Figures 6(a) and 7(a). No damage on the quartz fabrics at zero punches · cm−2 and slight damage on the quartz fabrics at 10 punches · cm−2 can be observed in Figures 5 and 7(a); thus, tensile samples at 0 and 10 punches · cm−2 maintain a complete or relatively complete initial stiff state and further cause such tensile test phenomenon which is consistent with the curve tendency shown in Figures 14(b) and 15(b). When the NPD is at 20–60 punches · cm−2, the load–displacement curves at 20–60 punches · cm−2 in 10 punches · cm−2 increments show a similar tendency with two stages of firstly slowly reaching peak and then secondly rapidly falling with short displacement. Although no significant damage morphology is observed in Figure 7(b) to (f) in comparison with Figures 5 and 6(a), in fact, the higher the NPD is, the more the broken fibers are. The yarns containing few broken fibers can be called main bearing tensile force yarns (MBFY) and the others containing more broken fibers than the MBFY can be called secondary bearing force yarns (SBFY). When testing, SBFY firstly are broken and then MBFY are broken with a short displacement, which corresponds with the curve trend shown in Figures 14(c) and 15(c).

Tensile load–displacement curves for needle-punched quartz woven fabrics with different NPDs in warp direction: (a) 0–245 punches·cm−2; (b) 0–10 punches·cm−2; (c) 20–60 punches·cm−2; (d) 70–245 punches·cm−2.
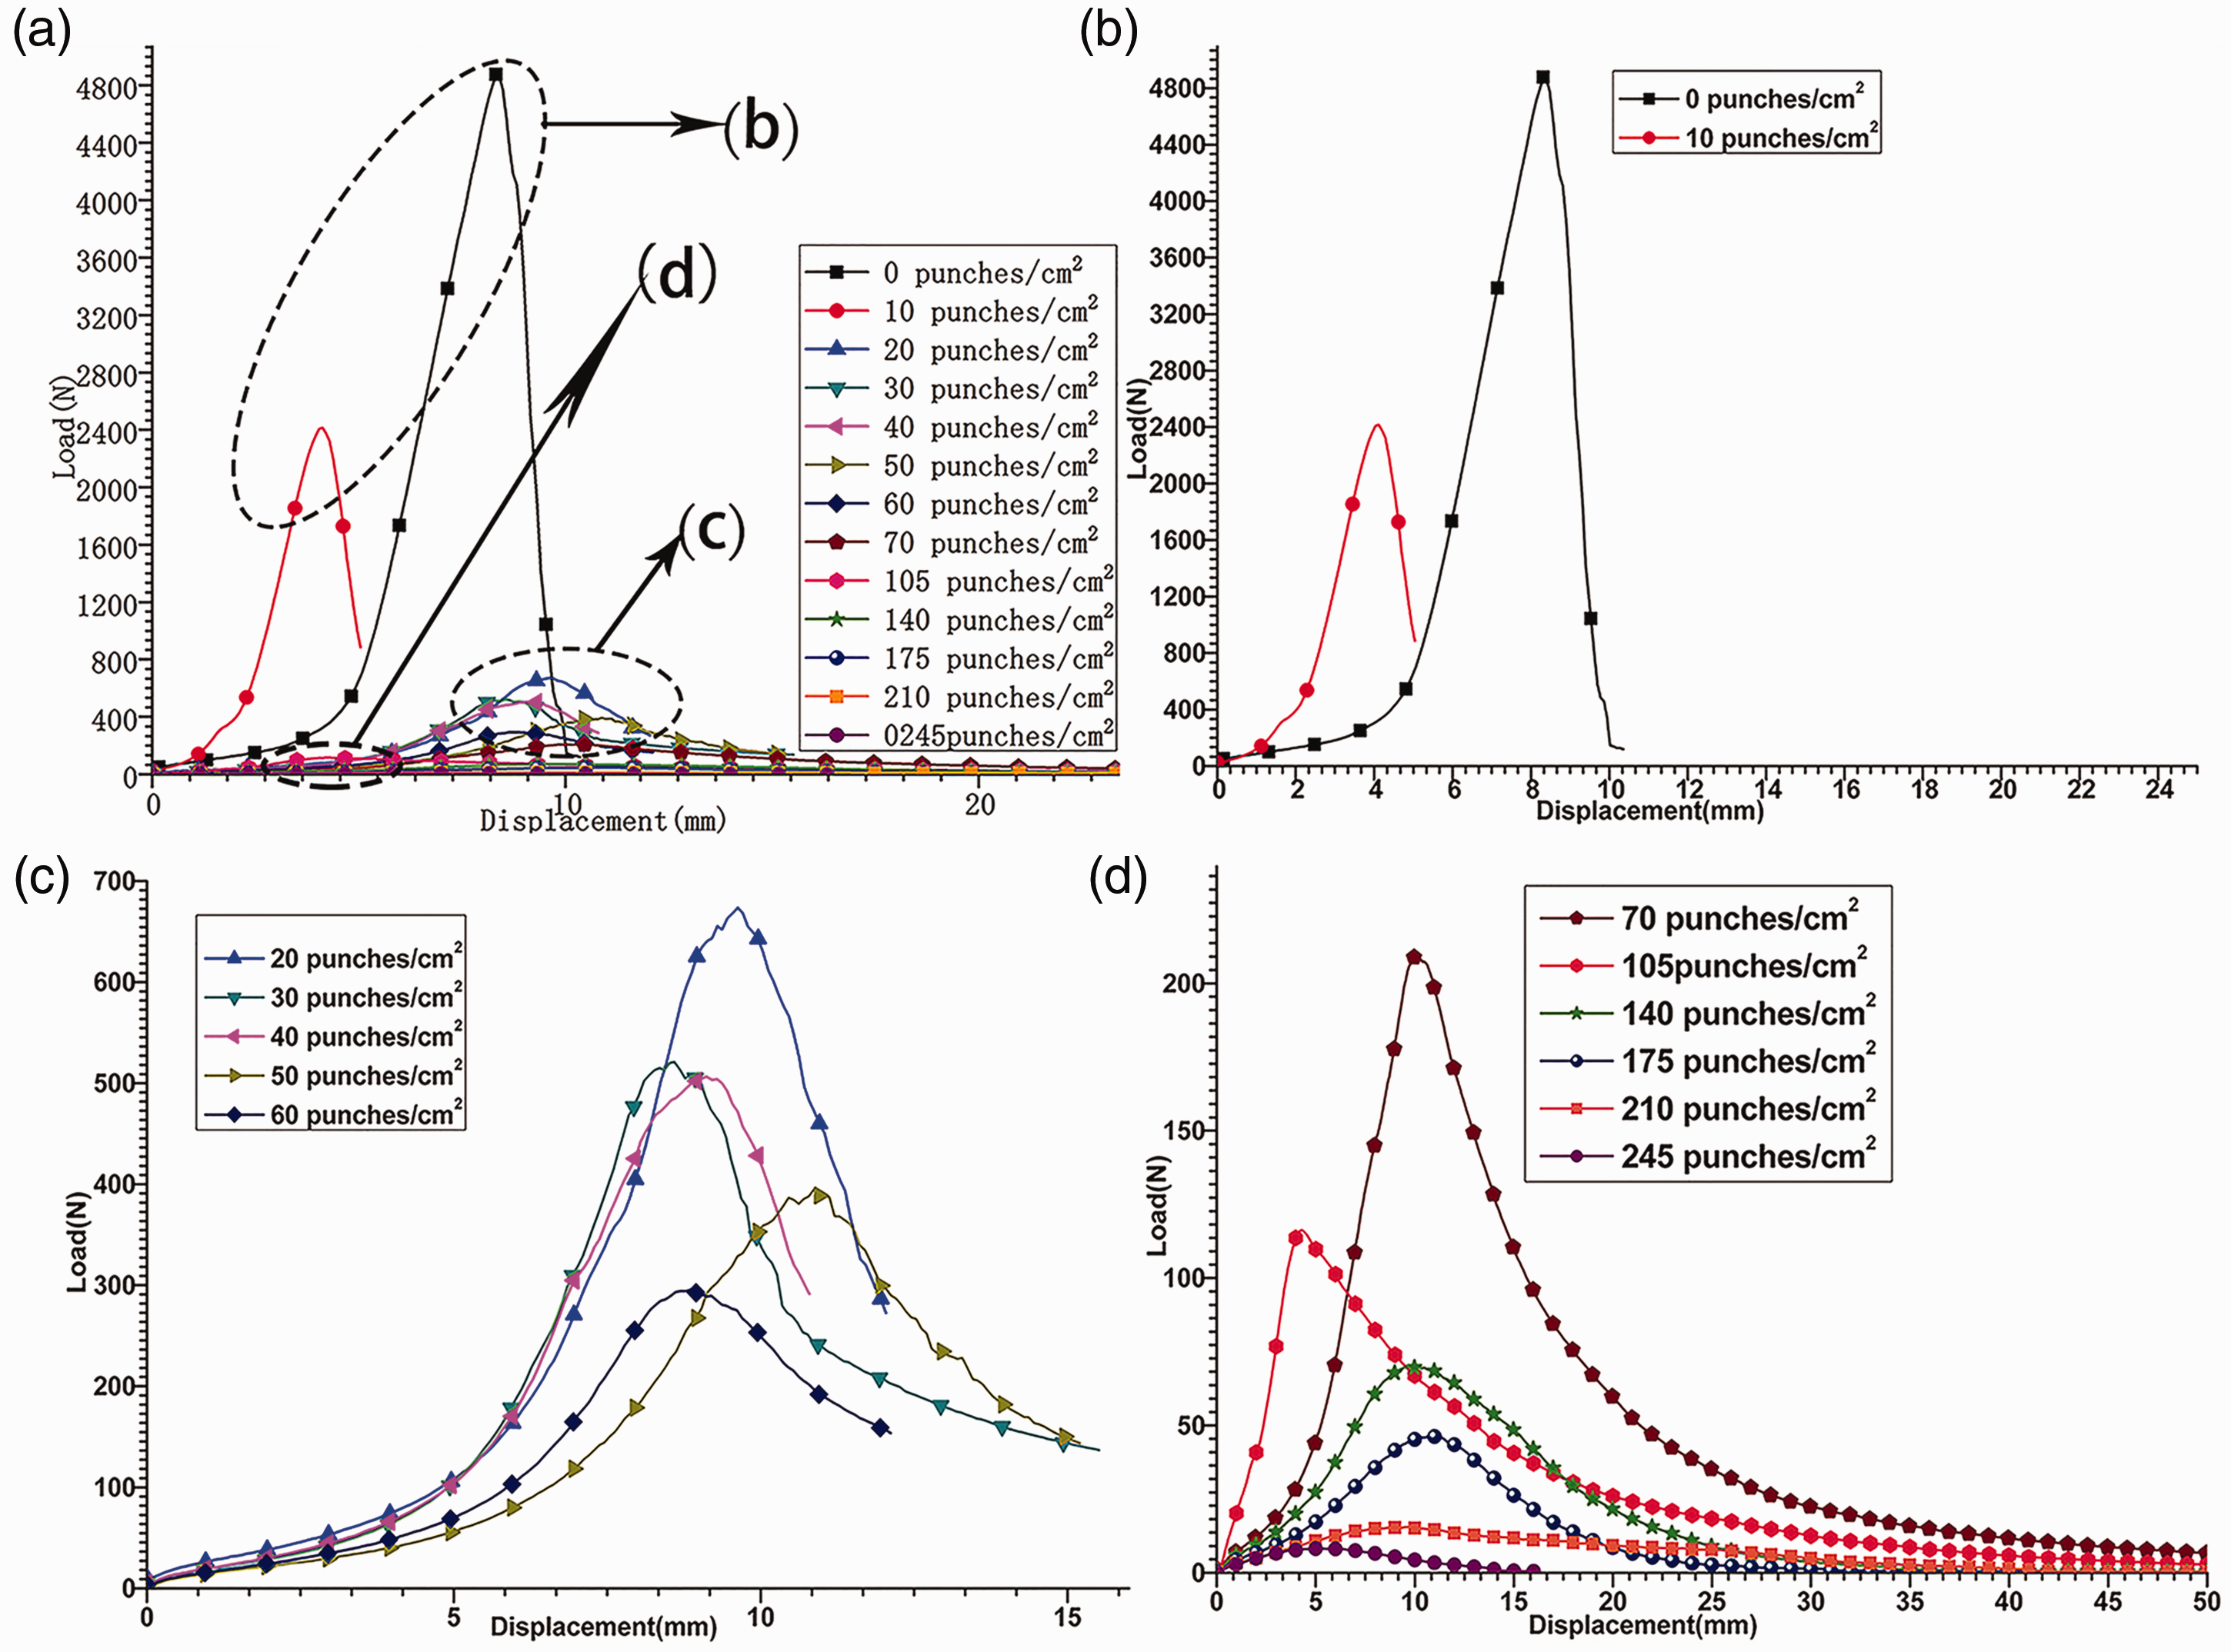
Tensile load–displacement curves for needle-punched quartz woven fabrics with different NPDs in weft direction: (a) 0–245 punches·cm−2; (b) 0–10 punches·cm−2; (c) 20–60 punches·cm−2; (d) 70–245 punches·cm−2.
In particular, although the trend variation of load–displacement curves at the region of small displacement maybe inaccurate considering the displacement measured directly by the testing machine, curves with small displacement still reflect the tensile characteristics. In addition, it can be observed that the two curves at the adjacent NPD values have the similar trend by analyzing Figure 14(d) or Figure 15(d) individually. By analyzing concretely Figure 14(d) or Figure 15(d), there are three different pairs of tensile load–displacement curves and every pair of curves with the similar tendency are found: the first pair of curves with the tendency of firstly reaching the peak rapidly and the dropping smoothly, the second pair of curves at 140 and 175 punches · cm−2 with the tendency of reaching the low-load peak and dropping smoothly at 140 and 175 punches · cm−2, and the third pair of curves with the tendency of reaching the peak at a lower load and dropping smoothly with a longer displacement at 210 and 245 punches · cm−2. Every pair of curves with the similar trend at 70 to 245 punches · cm−2 is corresponding to the morphological similarity at 70 to 245 punches · cm−2 on both faces of the needle-punched quartz woven fabrics as shown in Figures 9 and 11.
Table 3 shows the mean tensile breaking force and retention ratio of the mean tensile breaking force at 0–245 punches · cm−2 in warp and weft directions. By analyzing the experimental data shown where R is retention ratio of the mean tensile breaking force, M is the mean tensile breaking force at zero punches · cm−2 in warp and weft directions, F is the mean tensile breaking force at 0–245 punches · cm−2 in warp and weft directions.
Mean tensile breaking force and retention ratio of mean tensile breaking force with different needling densities between 0 punches·cm−2 and 245 punches·cm−2.

To analyze the data in Table 3 concretely, it can be obtained that the mean tensile breaking force and the retention ratio of the mean tensile breaking force decrease with the NPD increasing from 0 to 245 punches · cm−2. The retention ratio of mean tensile breaking force is calculated by the following equation (1)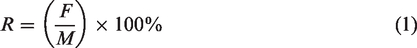
it can be found that the mean tensile breaking force in warp direction decreases from 5487.25 N to 2710.5 N with an increase in NPD from 0 to 10 punches · cm−2 and that in weft direction decreases from 5078.13 N to 2550 N with the same increment in NPD, and retention ratio of mean tensile breaking force in warp and weft directions at 10 punches · cm−2 are 49.4% and 50.21%, respectively. However, no significant damage morphology is observed at 10 punches · cm−2 as shown in Figure 7(a) compared with that shown in Figure 6, so the change of the damage morphology at 0–10 punches · cm−2 does not seem to be consistent with the significant change in the retention ratio of the mean tensile breaking force at 0–10 punches · cm−2. Furthermore, the retention ratios of the mean tensile breaking force in warp and weft directions at 210 punches · cm−2 are 0.61% and 0.34%, respectively, and those in warp and weft directions at 245 punches · cm−2 are 0.35% and 0.19%, respectively. Thus, it can be concluded that the damage degree of tensile property reaches the limit when the NPD reaches 245 punches · cm−2 in consideration of that RRMF at 210 punches · cm−2 and 245 punches · cm−2 are roughly equal and both are less than 1%.
Analysis of the tensile sample failure morphologies
The tensile failure morphologies in warp direction at 0 and 10 punches · cm−2 can be observed in Figure 16 and that in weft direction is shown in Figure 17. It can be observed in Figures 16 and 17 that the disorganized and bending broken yarns distribute at the edge of the tensile samples, and such tensile fracture morphology is due to that yarns in samples at 0 and 10 punches · cm−2 are instantaneous centralized fracture, and further causes the disorganized and bending broken yarns after the snap and springback of the yarns. Moreover, the fracture morphology shown in Figures 16 and 17 can also be explained by the curve trend of reaching the peak and falling to instantaneous stop rapidly shown in Figures 14(b) and 15(b).

Tensile failure morphology of quartz woven fabrics at (a) 0 punches·cm−2 and (b) 10 punches·cm−2 in warp direction.
Tensile failure morphology of quartz woven fabrics at (a) 0 punches·cm−2 and (b) 10 punches·cm−2 in weft direction.
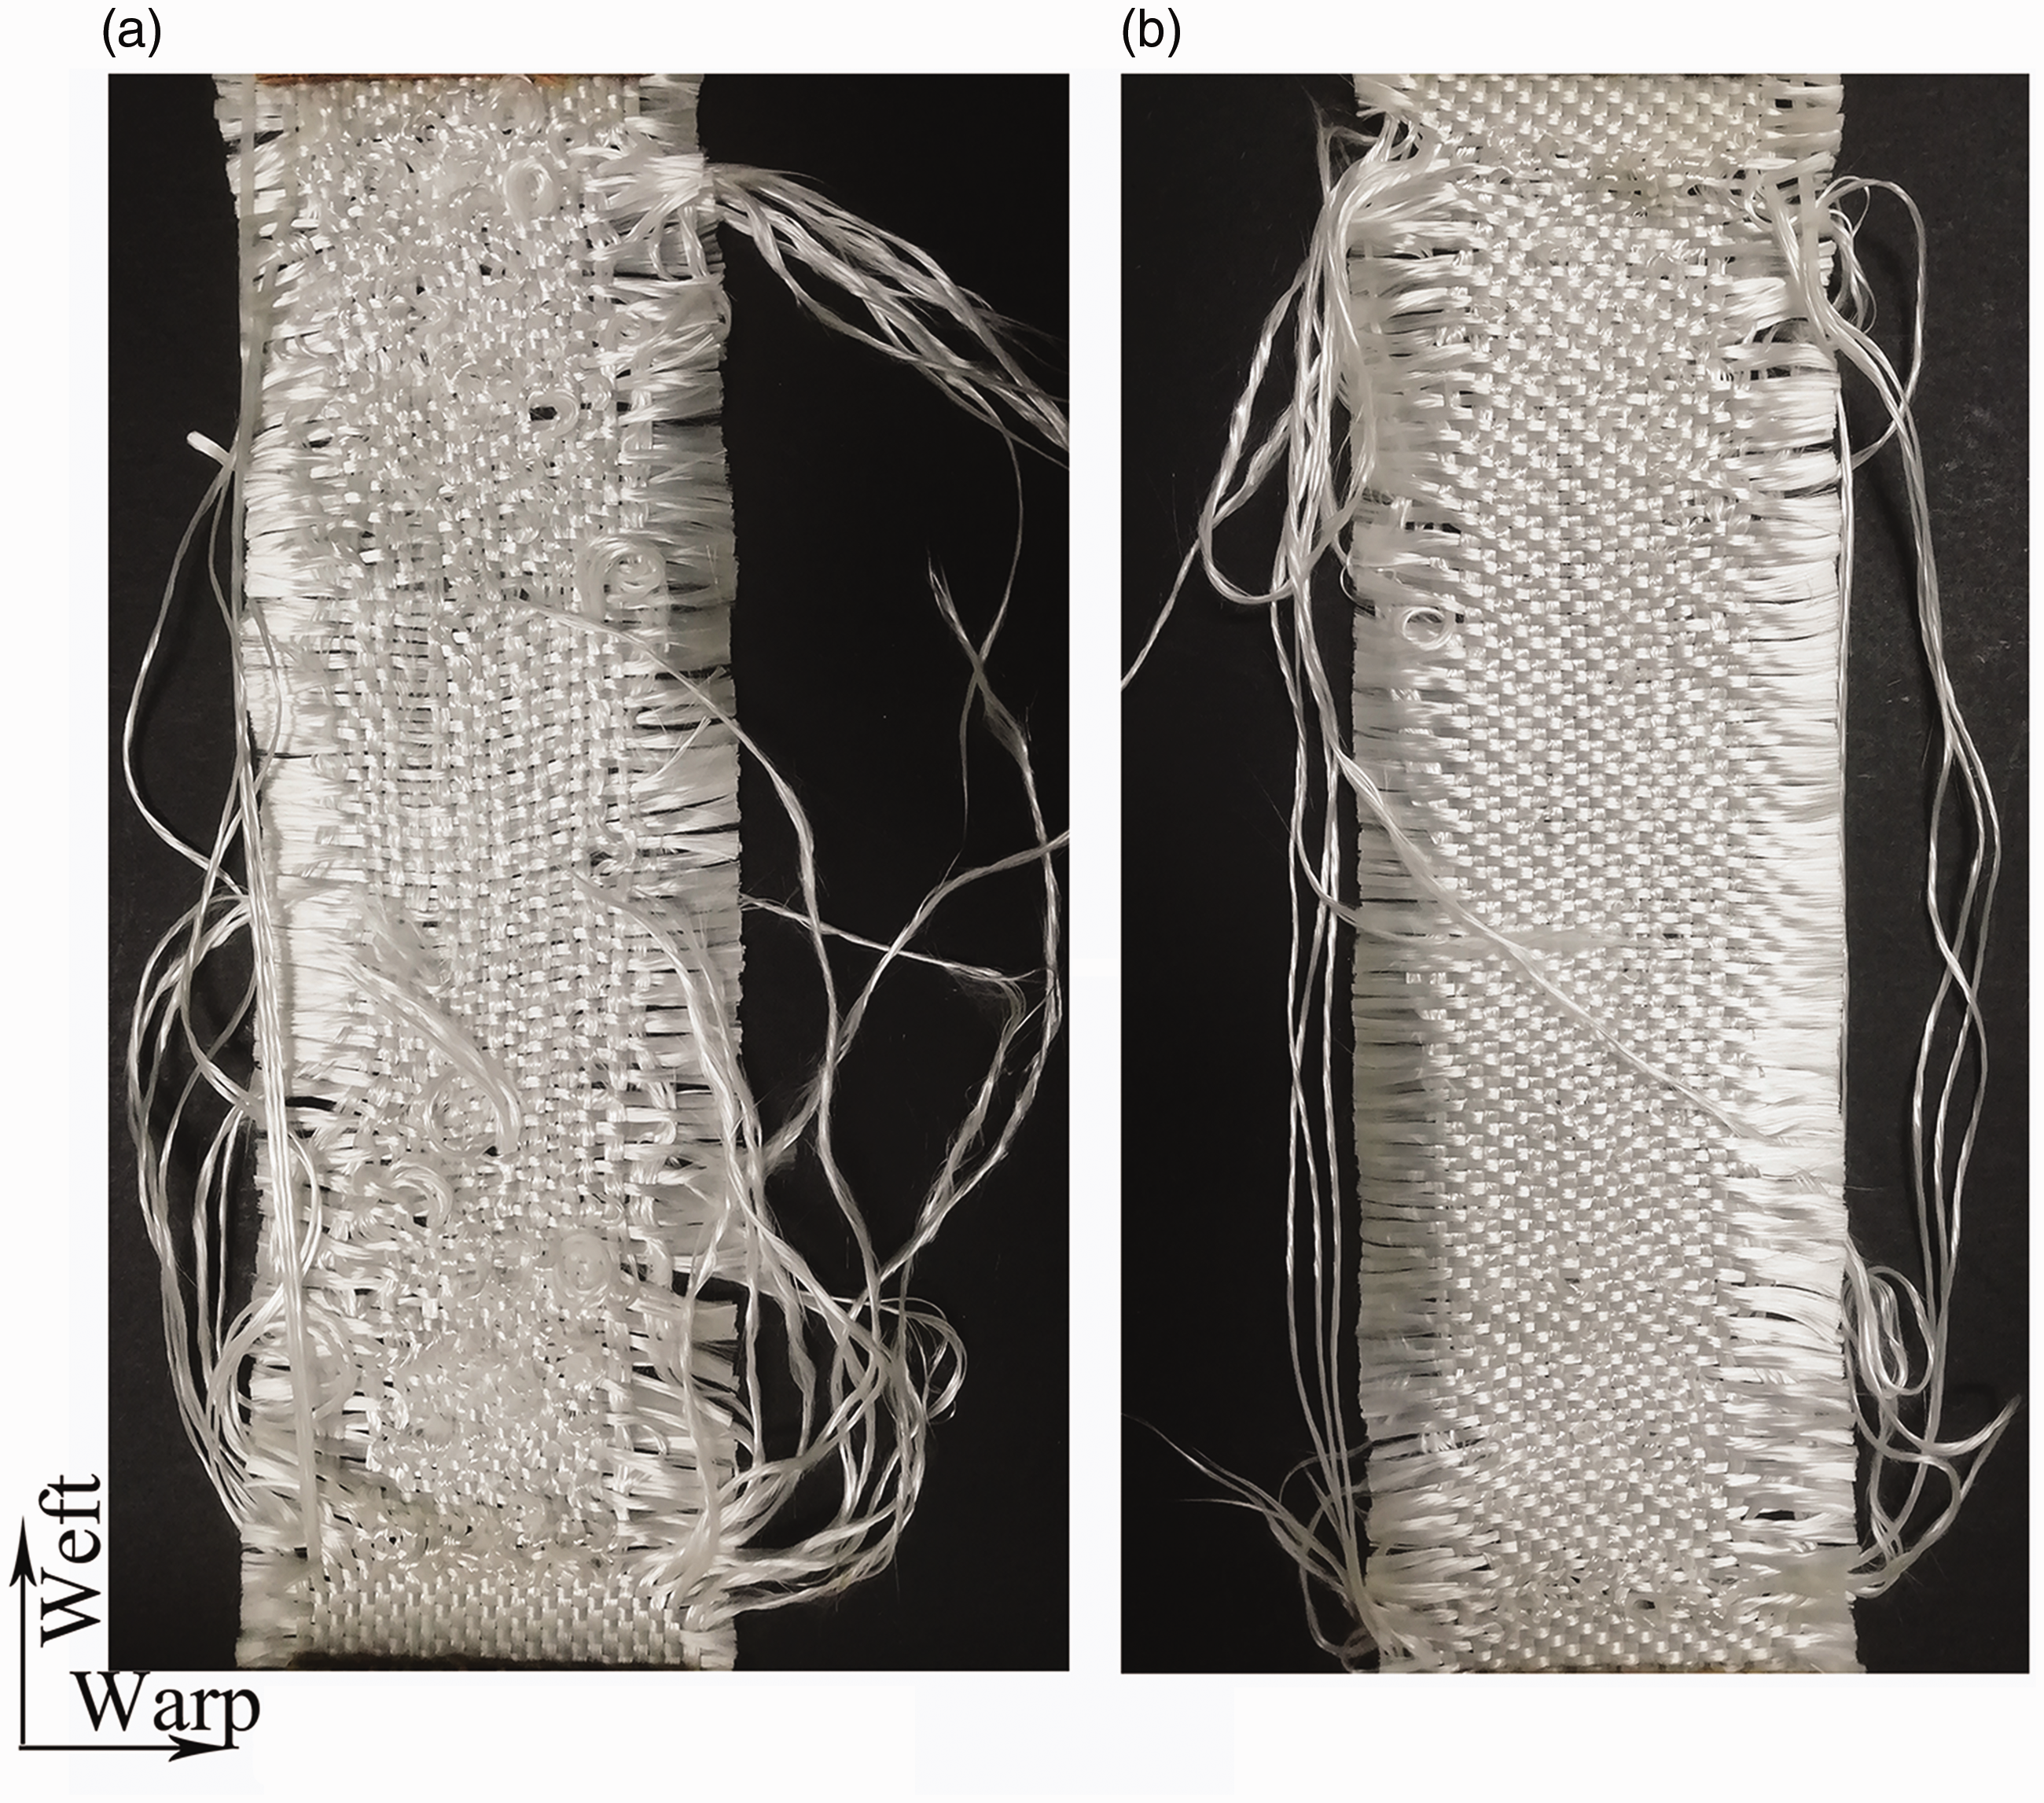
A similar macroscopic tensile failure morphology with small cracks can be observed in Figures 18(a) to (e) and 19(a) to (e), by combining Figure 6(b) to (f) with Figure 7(b) to (f) to analyze the tensile failure morphology ranged from 20 to 60 punches · cm−2, although no significant damage morphology can be observed in Figure 7 compared with that shown in Figure 5; in fact, SBFY still exist in tensile samples at 20–60 punches · cm−2 and the existence of the SBFY causes the small cracks as shown in Figures 18(a) to (e) and 19(a) to (e). Figures 20 and 21 show the mesoscopic tensile failure features at 20–245 punches · cm−2 in warp and weft directions, respectively. As is shown in Figures 20(a) and 21(a), the yarns in the small cracks become thinner compared with that shown in Figure 5.

Macroscopic tensile failure morphologies of needle-punched quartz woven fabrics at (a) 20 punches·cm−2, (b) 30 punches·cm−2, (c) 40 punches·cm−2, (d) 50 punches·cm−2, (e) 60 punches·cm−2, (f) 70 punches·cm−2, (g) 105 punches·cm−2, (h) 140 punches·cm−2, (i) 175 punches·cm−2, (j) 210 punches·cm−2, and (k) 245 punches·cm−2 in warp direction.

Macroscopic tensile failure morphologies of needle-punched quartz woven fabrics at (a) 20 punches·cm−2, (b) 30 punches·cm−2, (c) 40 punches·cm−2, (d) 50 punches·cm−2, (e) 60 punches·cm−2, (f) 70 punches·cm−2, (g) 105 punches·cm−2, (h) 140 punches·cm−2, (i) 175 punches·cm−2, (j) 210 punches·cm−2, and (k) 245 punches·cm−2 in weft direction.
Mesoscopic tensile samples failure morphologies of needle-punched quartz woven fabrics at (a) 20–60 punches·cm−2, (b) 70–105 punches·cm−2, (c) 140–175 punches·cm−2, (d) 210–245 punches·cm−2 in warp direction.
Mesoscopic tensile samples failure morphologies of needle-punched quartz woven fabrics at (a) 20–60 punches·cm−2, (b) 70–105 punches·cm−2, (c) 140–175 punches·cm−2, (d) 210–245 punches·cm−2 in weft direction.
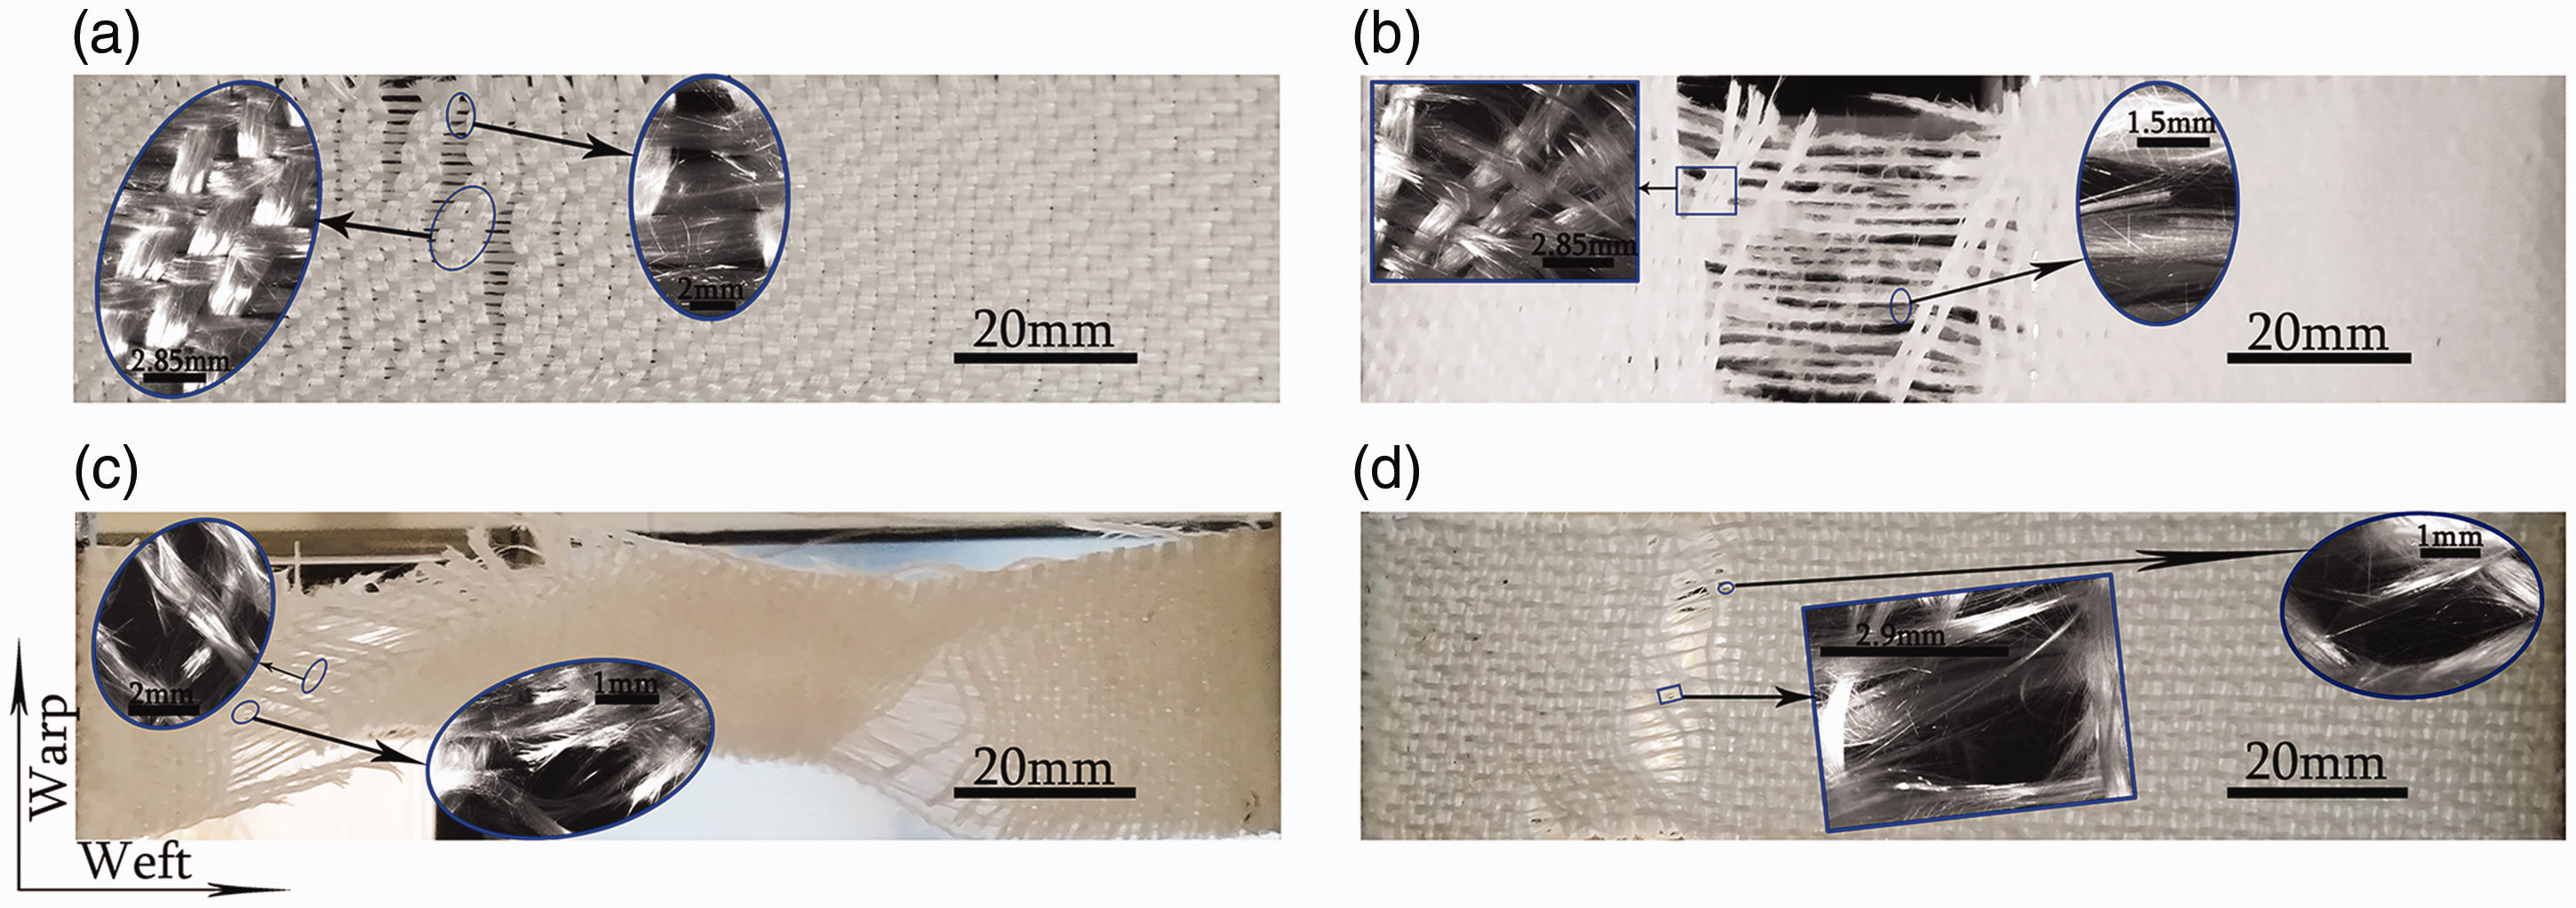
Significantly, the paired similarity of the tensile failure morphologies at the adjacent NPD values from 70 to 245 punches · cm−2 in 35 punches · cm−2 increments shown in Figures 18(f) to (k) and 19(f) to (k) are also observed, which are consistent with the paired similarity of the curve tendencies as shown in Figures 14(d) and 15(d). Also, it is like the paired similarity of the damage morphologies at 70–245 punches · cm−2, as shown in Figures 9 and 11; there are three pairs of similar tensile failure morphologies, as shown in Figures 18 and 19(f) to (k). However, no significant differences in the tensile failure morphology at the same NPD in warp and weft directions are observed by combining Figures 18 and 19.It can be observed in Figures 18(f) and (g) and 19(f) and (g) that tensile morphologies at 70 punches · cm−2 and 105 punches · cm−2 show the similar failure characteristic of yarns pulled out along with the stretching direction. In addition, fiber fuzz and yarns becoming thinner are observed at 70 and 105 punches · cm−2, as shown in Figures 20(b) and 21(b). By combining the above analysis of the macro damage morphology at 70 and 105 punches · cm−2 with the load–displacement curves at the same NPD values illustrated in Figures 14(d) and 15(d), it can be known that not only a lot of broken fibers but also many breakage positions in yarns in the stretching direction cause the significant yarn pulled out accompanied with fiber fuzz. When the NPD reaches 140 and 175 punches · cm−2, as is shown in Figures 18(h) and (i) and 19(h) and (i), a macroscopic tensile failure morphology of roughly like hourglass-shaped fracture with several cracks is observed; mesoscopic yarn morphology accompanied with the hourglass-shaped fracture presents serious yarn deformation and breakage, as shown in Figures 20(c) and 21(c). A lot of broken fibers are caught and transferred to the Z direction, as shown in Figure 11(c) and (d); therefore, yarns existing in the fabric plane for bearing tensile load become thinner significantly, and thus the structure of quartz woven fabrics becomes loose and the interlock between the yarns is also weakened. Therefore, tensile samples with such damage situation at 140 and 175 punches · cm−2 are easy to be stretched into the hourglass shape, as shown in Figures 18(h) and (i) and 19(h) and (i). When the NPD reaches 210 and 245 punches · cm−2, a macroscopic tensile failure of significant cracks along with the direction perpendicular to the applying tensile load is observed, as shown in Figures 18(j,k) and 19(j,k), and the tensile cracks at 210 and 245 punches · cm−2 are bigger than those at 20 to 60 punches · cm−2 in 10 punches · cm−2 increments, as shown in Figures 18(a) to (e) and 19(a) to (e). The micro morphologies in the tensile crack at 210 and 245 punches · cm−2 present the complete breakage of the whole yarns, and paralleled yarns with serious and significant fiber fuzz in the middle of the cracks are observed in Figures 20(d) and 21(d). By the above tensile test data, it can be known that the damage degree of tensile property reaches the limit when the NPD reaches 245 punches · cm−2, i.e. the property of the needle-punched woven fabrics for withstanding the tensile load at 245 punches · cm−2 has dropped to the minimized, and thus samples show the macroscopic tensile failure of significant cracks along with the direction perpendicular to the applying tensile load, as illustrated in Figures 18(j) and (k) and 19(j) and (k), and such tensile cracks in tensile samples at 210 and 245 punches · cm−2 are consistent with the curve trend of reaching the peak at a lower load and dropping smoothly with a higher displacement, as shown in Figures 14(d) and 15(d) at 210 and 245 punches · cm−2.
In addition, yarns those that are pulled out into fiber filaments, as shown in Figures 18(f), 19(f), 20(b), and 21(b), just illustrate that the fibers in fabrics are not completely broken, instead, the direction of the broken crack at 245 punches · cm−2 is roughly perpendicular to the direction of the applying tensile load, and this tensile failure morphology just suggest that almost all the yarns are broken completely, so the damage degree at 245 punches · cm−2 is much more serious than that at 70 punches · cm−2.
Conclusions
Needle punching points began to occur at point overlap at 50 punches · cm−2; meanwhile, the linear fiber bundles began to form in the Z direction out of the quartz fabrics plane; the U-shaped protruding fiber bundle began to occur firstly at 210 punches · cm−2 in the Z direction perpendicular to the quartz fabrics plane; the damage morphology at 10–60 punches · cm−2 on the front face of the needle-punched quartz woven fabrics had no significant difference, and that on the back face presented different fiber distributing morphologies at 10–60 punches · cm−2; in addition, the tensile displacement–load curves in warp and weft directions at 0 and 10 punches · cm−2 presented the similar trend and those at 20 to 60 punches · cm−2 also existed the similar curve tendency. Likewise, the tensile failure morphology in warp and weft directions at 0 and 10 punches · cm−2 presented the disorganized and bending broken yarns, and a similar failure morphology with several cracks in the tensile samples at 20 to 60 punches · cm−2 could be observed.
The retention ratio of the tensile breaking force for the needle-punched quartz fabrics in warp direction decreased from 100% to 49.4% with an increase in NPD from zero to 10 punches · cm−2 and that in weft direction decreased from 100% to 50.21% with the same increments in NPD. However, no significant damage morphology was observed on the quartz woven fabrics at 10 punches · cm−2 compared with that at 0 punches · cm−2. Furthermore, the retention ratios of the tensile breaking force for the needle-punched quartz fabrics in warp and weft directions at 210 punches · cm−2 were 0.61% and 0.34%, respectively. And those at 245 punches · cm−2 were 0.35% and 0.19%, respectively. The retention ratios of the tensile breaking force not only at 210 punches · cm−2 but also at 245 punches · cm−2 were all less than 1%; therefore, it can be concluded that the damage degree on the tensile property of the quartz fabrics reached the limit at 245 punches · cm−2, i.e. it can be concluded that the tensile property of the needle-punched quartz woven fabrics at 245 punches · cm−2 has dropped to the minimum.
It was noticed that when the NPD was at 70–245 punches · cm−2, the damage morphologies on the front and back faces of the needle-punched quartz woven fabrics, the tensile load–displacement curves, and the failure morphologies of the tensile samples all presented the characteristic of the paired similarity. Specially, similar macro damage morphologies could be observed at 70 and 105 punches · cm−2 and similar fiber distribution also could be found at the same range of the NPD. Therefore, it could be concluded that the needle-punched quartz woven fabrics at 70 and 105 punches · cm−2 had the similar weave structure and further to create the similar curve trend at 70 and 105 punches · cm−2 in warp and weft directions. Likewise, similar curve trend represented similar tensile failure morphologies. Moreover, the characteristics that similar needle-punched damage morphologies caused similar weave structure and further to create similar load–displacement curve trend with similar tensile failure morphologies existed at 140–175 punches · cm−2 and 210–245 punches · cm−2.
Footnotes
Declaration of conflicting interests
The author(s) declared no potential conflicts of interest with respect to the research, authorship, and/or publication of this article.
Funding
The author(s) disclosed receipt of the following financial support for the research, authorship, and/or publication of this article: This work was finally supported by the Scientific Research Project of Tianjin Education Commission (2017KJ066); the major science and technology projects of Tianjin (18ZXJMTG00190); the major science and technology projects of Shanxi Province (20181102022), and the University Innovation Team Training Plan of Tianjin (TD13-5043).