
Abstract
In spinning, sizing agent makes originally rigid glass filament yarn soft, smooth, reduces mechanical wear, and alleviates static electricity. In order to produce “stronger, thinner, and more uniform” E(Electronic) fiberglass cloth, the sized filament yarn is required to have good strand integrity and uniform belt-like shape. Currently, the sizing effect can only be evaluated artificially according to the image of cross section or longitudinal section of yarns. The goal of the paper is to find an objective evaluation method for sizing effects on strand integrity and performance of belt-forming of E-glass filament yarn. The image of cross section of yarn is captured by Keyence VK-X110 and analyzed by Image-Pro Plus to obtain the central position and diameter of each filament. The threshold of fiber spacing is set to determine whether filaments are clustered in group. The area of outer enveloping convex polygon containing all the clustered filaments is calculated and fiber-filling rate is calculated accordingly. By using the least square method, the minimum rectangle containing all groups of filaments is obtained to describe the basic contour of yarn cross section. The outer envelope polygon is divided into several equal parts to calculate the coefficient variation of thickness distribution and yarn distribution. These objective values well reflect the strand integrity and feature of belt-forming of yarn, and are consistent with the subjective evaluation. Rank order method is used to compare the sizing morphology of the yarns based on the values. A standard is also suggested for objective grade assessment of sized E-Glass yarns.
Introduction
Special requirements for the morphology of a sized E-glass yarn
Electronic-glass (E-glass) filament is spun by drawing the molten glass ball or waste glass at high temperature with its monofilament diameter ranging from 3 µm to 9 µm, each bundled strand is composed of hundreds of filaments. During extremely short period of spinning, drawing, and cooling, a layer of sizing agent carried by the coating roller is applied to the high-speed (approximately 60 m/s) glass fiber surface, followed by the glass fiber being clustered and wound. The sizing agent must work immediately after application and offer the glass fiber with new properties after drying. Then the E-glass yarns are twisted and woven to form glass fabric. In the processing, the filaments separated from the yarn are subjected to friction and fracture, and the quality of the fiberglass cloth is deteriorated. The E-glass yarn with good strand integrity is not easy to break and fluff during the processing. After being woven, the glass fabric will be used in electrical insulating material or substrate of printed circuit board (PCL), which is required to be thin, uniform, and strong. As the PCLs of electronic components are getting thinner, the demand for plain electronic cloth also tends to be thinner, even as thin as 16 µm [1], which means that there are only two to three fibers in the height direction of an E-glass yarn under the extreme conditions. In this way, the cross section of the E-glass yarn is required to be formed in shape of belt or ribbon as much as possible. After weaving, the E-glass yarn needs to be further compressed through splitting process to meet the requirements of fabric thickness. Therefore, the cross section of E-fiberglass yarn is expected to present a flat ribbon shape for a thinner fabric and the convenience of the subsequent splitting operation on the woven fabric, which is quite different from the circular cross section under the ideal shape of an ordinary yarn.
So, an ideal E-fiberglass yarn should have the following morphological characteristics after sizing: (1) good strand integrity, small interfiber spacing; (2) ribbon-like, conducive to the splitting of E-glass fabric to produce the ultrathin products; and (3) uniform in thickness of the cross section, conducive to a smooth product surface.
As for good strand integrity, that is, the filaments are well clustered with high fiber-filling rate; good belt formation means that yarn is expected to be thin in cross section; uniform belt requires the size of uniform thickness, the same number of fibers per layer. Figure 1 is an image of cross section of an E-glass yarn (D900) with good strand integrity and belt-forming performance (photographed with Kenyence VK×110 microscope under 1000× magnification).

Image of the cross-section of an E-fiberglass yarn (D900, Sample R1) with good performance in both strand integrity and belt-forming.
Roles of the sizing agent and shape forming
The shape of the E-glass yarn is formed in spinning process due to the application of the sizing agent [2–6]. Sizing agents are classified into textile sizing agent and enhanced sizing agent. The dispersion medium is usually water. In addition to water, the main components in sizing agents are film-forming agent, lubricant, antistatic agent, and coupling agent. Some wetting agents, pH regulators, preservatives, plasticizers, cross-linking agents, defoaming agents, softeners, pigments, and other auxiliary components may be used in sizing agent formulations. The sizing agent bunches hundreds of glass filaments into a strand, and makes the filaments do not bond with each other after winding onto the cylinder package. It also makes the original brittle and hard glass filaments soft and smooth, reduces mechanical wear and static electricity generation. The coupling component in some sizing agents is used to improve the interfacial properties of the glass fiber and the matrix in composites. The following functions are specially stated in this paper:
Filament clustering and belt forming
The adhesive components contained in the sizing agent can bundle hundreds of glass filaments together to maintain the integrity of the E-glass yarn, which reduces the phenomenon of breakages caused by the formation of loose and broken filaments in the processing process. The yarn is shaped in a belt-like form by the pressure of the circular moving sizing roller.
Separating the fibers
Sizing agent not only bundles fibers together but also forms a barrier among the fibers to maintain the flexibility of yarn. The fibers are kept separate by the barrier effect of insoluble small particles in the sizing agent. The size of the particles is generally <0.5 nm, which can be seen in scanning electron microscopy (SEM) images of the longitudinal section of the yarn, but hard to be distinguished in a 1000× magnification image.
Size manufacturing is a key technology to the production of glass fiber, which is directly related to the process of twisting and weaving. The variety and quality of the sizing agents have a decisive influence on the manufacturing, processing, and final product quality of glass fiber and composites.
Current study on evaluating the sizing agents and drawbacks
The composition of the size for fiberglass is similar to that of the cotton yarn weaving. In the development of sizing agents for the E-glass yarn, more consideration is given to the improvement rate of strength of glass fiber yarn, size film strength and elongation rate, stiffness of yarn, antistatic performance, friction coefficient, surface hairiness, and wear-resisting performance, because the evaluation standards and evaluation instruments for the above indexes are determined. For evaluating the sizing effect, Du et al. [7] studied the migration of size in different positions of fiberglass yarn bobbin, and the relationship between the distribution of sizing agents in the length range of bobbin yarn and the processing properties of yarn. Wang et al. [8] studied the relationship between temperature and humidity and sizing effects. Zinck et al. [9] and Frenzel et al. [10] studied the interfacial bond strength between the treated glass fiber and the substrate. All in all, these researchers concentrated on the standards that are universal accepted and evaluated by an objective measured data.
However, few researchers focused on evaluating the morphology of the sized E-glass yarn because there is not any objective measuring instrument. At present, the evaluation of the strand integrity of glass fiber yarn is basically based on qualitative description of cross section of yarn photos by naked eyes, which is inevitably affected by subjective factors and difficult to give accurate discrimination [11–13]. Yan et al. [14] observed the longitudinal image of the basalt filament only with naked eyes and evaluate the sizing effect on the strand integrity after treatment of plasma. Compared with observing cross section of yarn, observing longitudinal image of the fiber is limited in fewer fibers in view and some fibers may be hidden by others. Wang et al. [15] and Thitiwongsawet et al. [16] had to confirm the self-bundling of polymer nanofibers by SEM observation with naked eyes.
There is a quantitative indirect test method for the strand integrity or clustering index of the E-glass yarn. Usually, the large number of yarn fracture is generated by the friction of the glass filament with poor strand integrity in processing. Based on the principle, a laser hairiness meter is fixed on a Karl Mayer warping and slashing combiner machine to measure the length and number of the hairiness at high frequency. However, the formation of hairiness is also affected by twisting and warping technology, and the evaluation of sizing effect is not direct and accurate enough. A patent [17] introduce a device by measuring the original width and expanded width of the carbon filaments to characterize the strand integrity, the principle is questionable.
There are some relative reports on the agglomeration state of particles using image technology, which might be applied to the evaluation of the E-glass filament yarn. He et al. [18] observed the agglomeration of cells, and used the image processing technology to reflect the agglomeration degree of cells by using the reciprocal of the average distance between cells within a certain range. However, the calculation was too complicated. Other researchers focused on the opposite index–dispersion properties. Fang and Li [19] studied the rubber in the distribution uniformity of quantitative measurement of carbon black particles. However, most of them are still limited in collecting images, observing, and subjectively evaluating with the naked eye, for the research of the distribution of soil particles, nanoparticles dispersion degree, or the reunion of the protein in biological pharmaceutical effect, etc. Laser particle analyzer is usually used to assess the particle size and distribution in suspension liquid, which is not suitable to evaluate the distribution of filament in a yarn.
Similarly, there is still no report on the evaluation method of the belt-forming performance of fiberglass yarn at present except for measuring the thickness of the finished fabric. One method was reported by Liu et al. [20] to improve the tapability or belt forming of the basalt filament, but there is not any details of how to measure the tapability of the filament.
The goal of the paper
The goal of the paper is to find an objective, direct evaluation method to evaluate the strand integrity and belt-forming effect imparted on the E-glass yarn by sizing agent. Our plan is to obtain the image of yarn cross section, evaluate the effect of the clustering status and belt-like shape according to the fibers’ diameter and distribution, and obtain several objective numerical values, which can be used to assess the sizing effect of the E-glass filament yarns.
Factors and methods for evaluation
Figure 2 shows the images of five samples of D900 (5.6tex) E-fiberglass yarn under the magnification of 1000 times. It can be seen that the E-fiberglass yarn has the following characteristics: the fibers are basically banded or belt shaped; most of the fibers are clustered in group, and the spacing of most fibers is below three diameters or 3d. A small amount of fibers have not been clustered and are free or isolated from the group. Among the samples, G1, G2, G3, and G4 have good clustering morphology by presentative judgment, while it is obviously poorer for sample G5.

Cross-section morphology of typical samples of E-glass yarn D900. (a) Sample G1. (b) Sample G2. (c) Sample G3. (d) Sample G4. (e) Sample G5.
Factors reflecting strand integrity
The number of fibers in clusters and the number of clusters
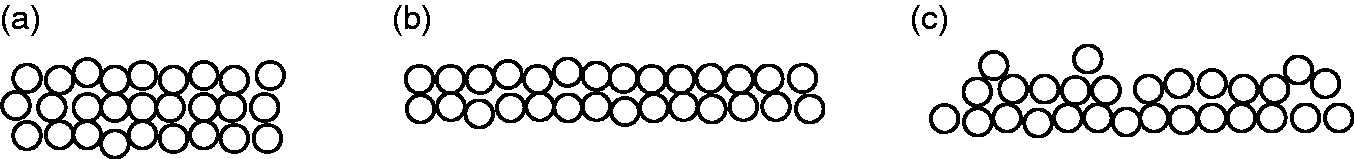
The obvious feature of strand integrity is that the fibers are bundled together into clusters. Therefore, the higher the proportion of grouped fibers to the total fibers in a single yarn, the better the strand integrity. Sometimes, as a result of the poor clustering, cracking of the grouped fibers in the middle of the yarn results in several fiber clusters. Figure 3 shows three yarns of different cross section with significant difference in strand integrity. It is obvious that the strand integrity of Figure 3(b) is better than that of Figure 3(a) and 3(c).

Cross sections of yarn with significant difference in strand integrity.
There are two categories of criteria to be considered: (1) the number of fibers gathered into clusters. If the total number of fibers of different yarn varieties or different manufacturers is considered, the proportion of fiber gathered into clusters is adopted. The larger the value, the better the strand integrity. (2) The number of clusters. If the number of clusters is greater than 1, it means that there are large pores or cracks between the fibers and the strand integrity is suffered. Obviously, the smaller the number of clusters, the better the strand integrity of the E-glass yarn.
Spacing threshold and filling coefficient of filaments
In real yarns, the fibers that form clusters have pores of varying sizes among them. Figure 4 is a schematic diagram of the fiber distribution in the cross section of yarn with three different porosity. Obviously, yarn of Figure 4(c) with the lowest porosity has the best strand integrity. The two factors should be considered. (1) The threshold of fiber spacing for clustering. The number of the clustered fibers being same, the smaller the threshold value, the better the strand integrity. For E-glass yarn, if the distance between the two neighboring filaments is more than 3d (d denotes the average diameter of the filaments), it is unreasonable to regard the two filaments are clustered. For the closest scenario, the distance between the two neighboring filaments is 1d. So, spacing threshold u is set within 1d–3d. (2) The area occupied by the fibers of same number. The smaller the area, the better the strand integrity. For yarns of different linear density, the evaluation criterion is the percentage of the area of the clustered fibers to the area of the cross section of yarn, or the filling rate of the fibers in the yarn. The larger the filling rate, the better the agglomeration effect or the strand integrity. (3) Theoretical average fiber distance. It is obvious that the small the average fiber distance, the better the strand integrity. The index is essential same to the area occupied by the fibers of same number.

Schematic morphology of clustered fibers.
Factors reflecting the performance of belt forming
Ideally, the fiber distribution in the cross section of the belt-like yarn is shown in Figure 5. There are three examples in the diagram. Obviously, the cross section of Figure 5(b) is more elongated with better belt-like effect. Yarn of Figure 5(c) varies in yarn thickness, and the evenness of belt-forming is obviously not so good as that of Figure 5(a) or 5(b). Because the cross section of yarn is expected to be like a belt or ribbon, the similarity between the contour of cross section and the rectangle can be compared to evaluate the effect of the belt-forming. The following aspects can be considered to evaluate the performance of belt-forming.
The cross sections of yarn with different performance of belt-forming.
The overall shape of the cross section
The minimum rectangle surrounding all the clustered fibers will be determined to stand for the overall shape of the cross section of yarn. Then, the length of the long side of the rectangle and the length–width ratio of the rectangle are calculated. It is obvious that the larger the two values, the better the effect of the belt-forming. Supposing all the fibers are closely arranged along the length of the rectangle, the theoretic number of fibers Tf in the height direction will be calculated. Take the examples in Figure 5, Tf is 3 for Figure 5(a) while Tf is 2 for Figure 5(b) and 5(c). The smaller the value of Tf, the better is the performance of the belt-forming.
The uniformity of belt formation
The variation coefficient of thickness is calculated along the direction of the central line of the minimum rectangle to characterize the uniformity of the belt-like yarn. The smaller the coefficient of variation, the more uniform the performance of belt formation.
Methodology and steps for evaluating the morphology of the cross section of yarn
According to the statement earlier, the idea and steps to evaluate the morphology of sized E-glass yarn on strand integrity and the performance of belt-forming are proposed as follows:
Obtaining the central coordinates and diameters of filaments
Obtaining the central coordinate and diameter of each filament in the image of the cross section of the sized E-glass yarn is the key and precondition to the assessment of the strand integrity and the performance of belt-forming. In this study, Keyence VK X110 was used to quickly obtain the cross-section image of E-glass yarn magnified by 1000 times. Image-Pro Plus (IPP) [21] was used to measure the central coordinate and diameter of each fiber, and then the result is outputted in a CNT-formed file [22], which is the same as a TXT-formed file, but with a different name in IPP.
Evaluation of strand integrity
The threshold value u of the fibers spacing is set to judge whether the fibers are clustered into a group. If the spacing distance between two fibers is less than u, they are considered to be clustered into a group. Then, find more neighboring filaments for each member of the group until all member filaments are searched. At last, an envelope polygon shown in Figure 6 that contains all the fibers in the group is determined. The smaller the polygon area, the higher the fiber filling rate, and the better the strand integrity.

Schematic of the outer envelope convex polygon containing all fibers clustered in groups.
Evaluation of belt-forming
Since the cross section of the yarn is expected to be belt-like, the central line of the yarn can be considered to be basically linear. According to the least square method, the linear equation of the centerline of belt-like cross section of yarn is obtained. Based on the centerline, the smallest rectangle containing all the fibers clustered in the groups is determined. Then the values mentioned earlier to evaluate the uniformity of the belt-forming are determined.
Evaluation of strand integrity based on IPP measurement
Measurement of all filaments by IPP
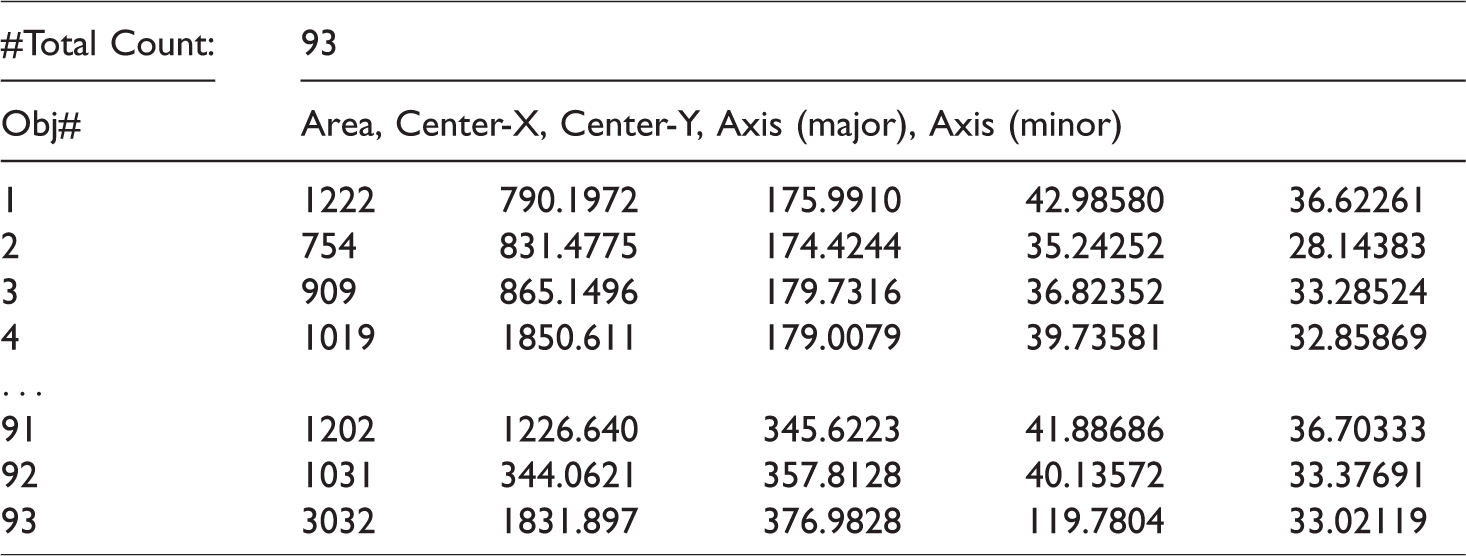
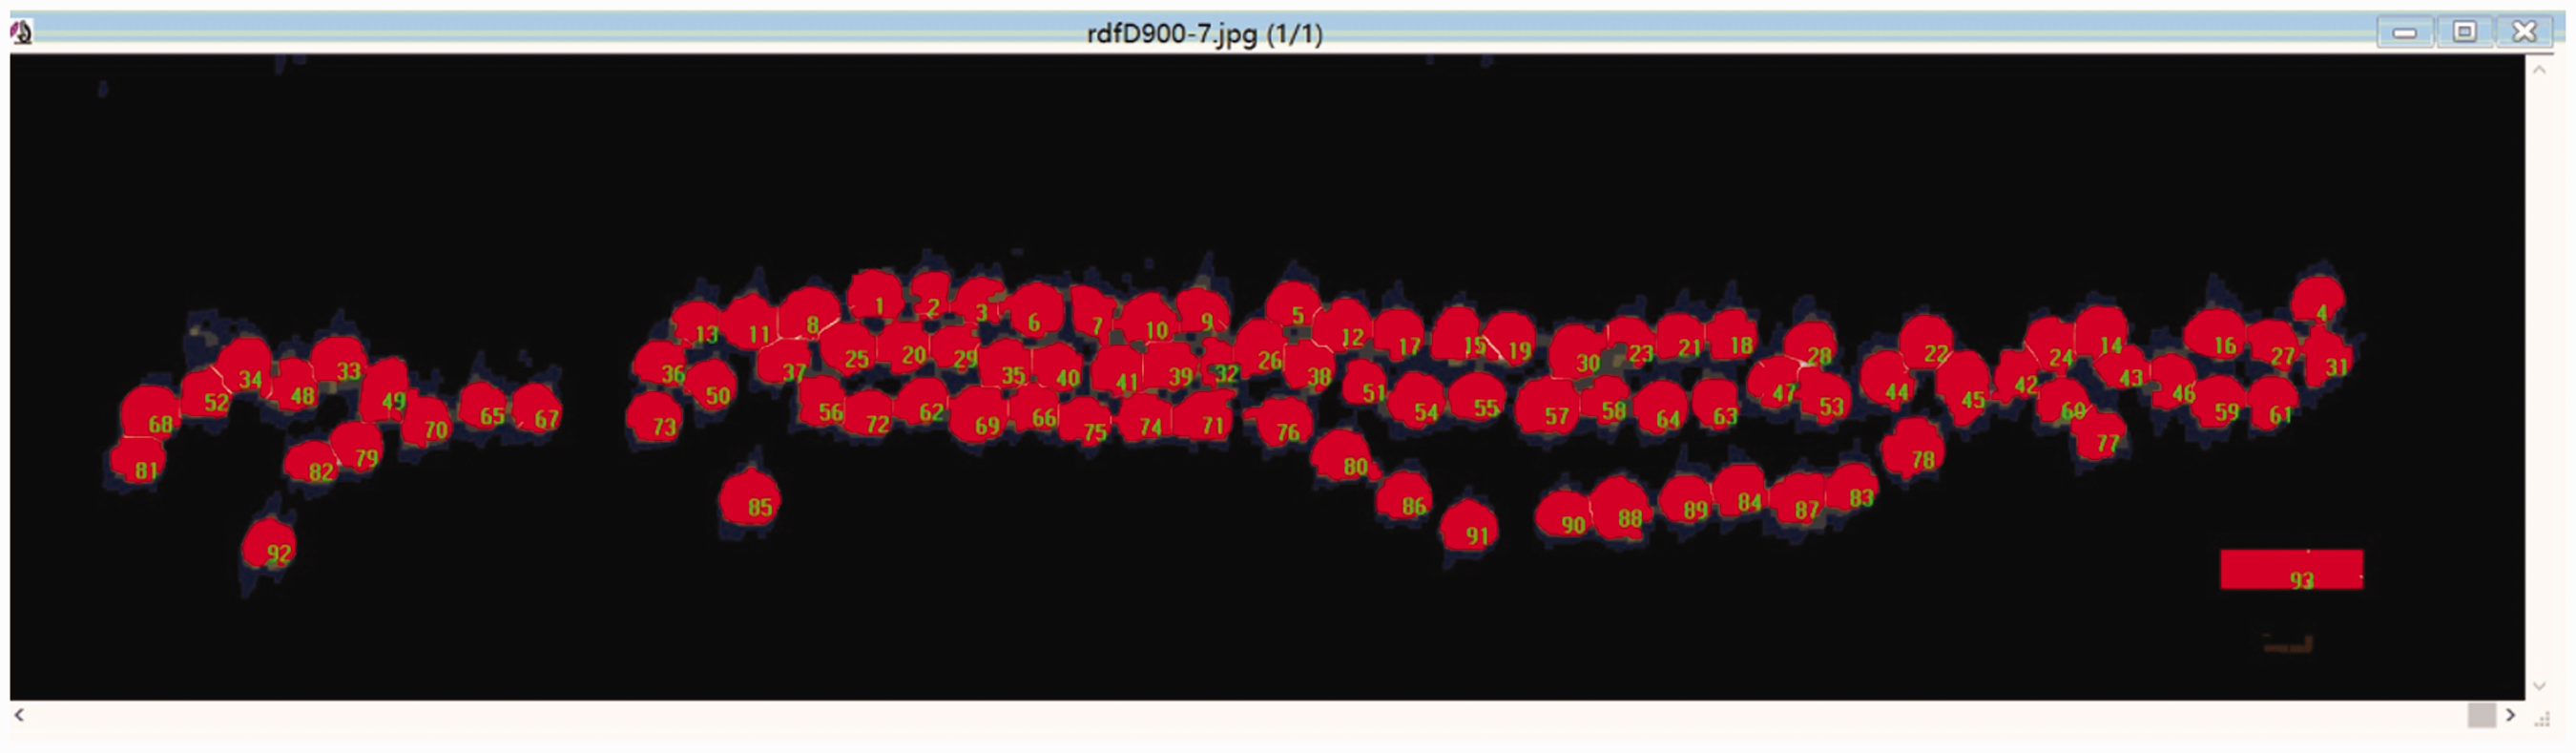
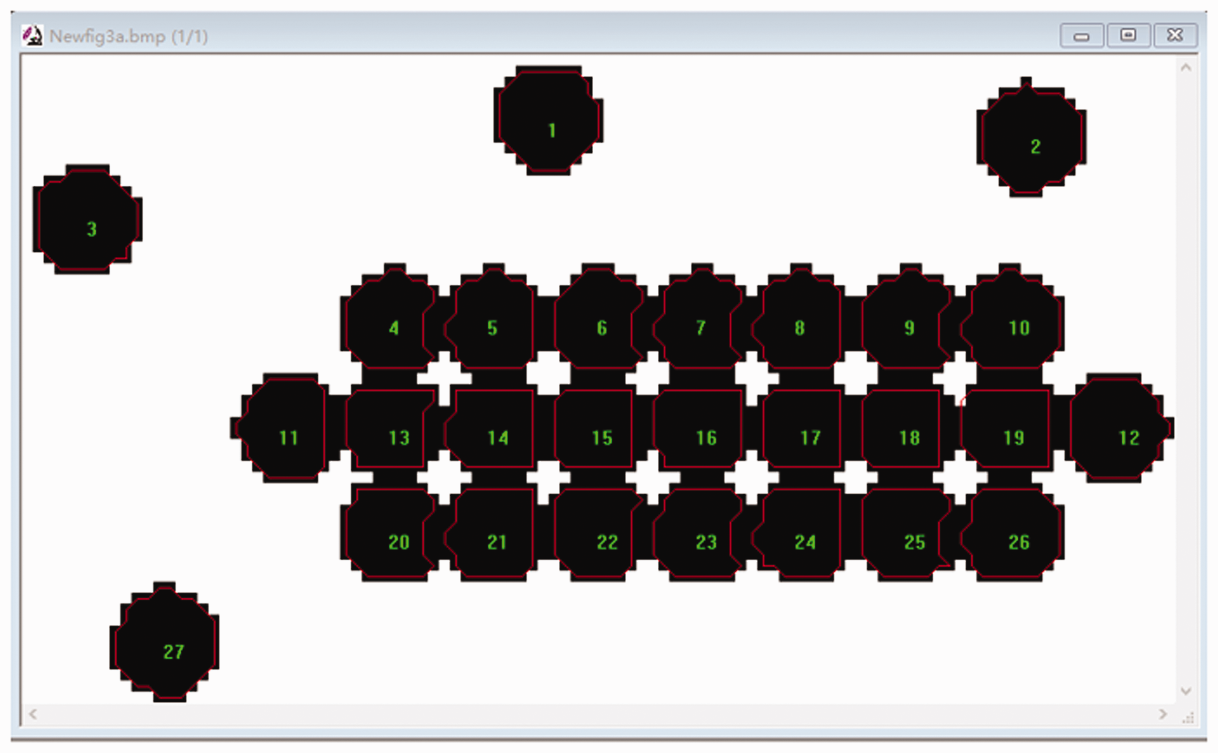
Schematic diagram of the interface of measuring the fibers by IPP.
The corresponding CNT file indicates that 93 objects were measured in Figure 7. The texts in each row describe the fiber’s No. or order., area (pixels), x-coordinate (pixels) of center, y-coordinate (pixels) of center, major diameter (pixels), and minor diameter (pixels). According to literature [15], the minor diameter is used to describe the fiber diameter. Since the object labeled No. 93 in the image is the ruler, 92 filaments are actually identified and measured in the cross section.
It should be noted that the number of filaments measured may be less than the actual number of filaments in yarn due to the fact that some fibers are out of view or hidden by the glue in preparing the sample before photographed.
Evaluation of strand integrity
If the distance between the center of two fibers is within a certain range or spacing threshold u, the two fibers are considered to be clustered. Therefore, the algorithm to judge the agglomeration relationship among all fibers can be expressed as follows: the judgment starts from the fiber No. 1 in CNT file, sets its group No. as 0; goes through all the fibers from fiber No. 2 to No. n to judge whether the fiber may have agglomeration relationship with fiber No. 1, saves the order of the fiber in group 0 if yes, and marks fiber No 1 “FINISHED”; then, from the fiber next to No. 1 in Group 0, find all the remaining fibers in yarn having agglomeration relationship with current fiber, save them in the same group (Group 0), and mark this fiber “FINISHED” again; the process continues until all the fibers in Group 0 are judged, and all the fibers in the group 0 are marked “FINISHED”. Then, the index of group No. is increased with 1, and the process above starts from the first unfinished fiber and is repeated until all the remaining or unfinished fibers are judged and processed. After fibers in group No. 1 are identified, then the judgment for group No. 2 begins. The process repeats until all the fibers in cross section have been identified. This algorithm is represented by N–S flow diagram shown in Figure 8.

N–S flow diagram of the algorithm for clustering relationships among fibers.
If there is only one fiber in some groups after judgment, the fiber is an isolated one and will not be counted in the later operation. Therefore, the rate of clustered fibers is calculated by: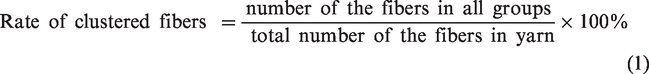
Determine the surrounding envelope contour
Envelope contour is the smallest convex polygon in which all the clustered fibers are encapsulated. Among the centers of all the grouped fibers in the image, find the point with the smallest y coordinate (top) and the smallest x coordinate, and call it point A. Let point A as the origin and scan clockwise along the positive X-axis ray (AX→) to find the central point of the fiber where the rotation angle is the smallest, which is marked as point B. Then take point B as the origin and scan clockwise along the direction AB (AB→) again to find the point where the rotation angle is the smallest, which is marked as point C. The process repeats until point A is found another time. Connect point A, B, C, … , point A, the convex envelope polygon passing through the center of these fibers is plotted as shown in Figure 9.
Schematic diagram of enveloping polygon of scatters.
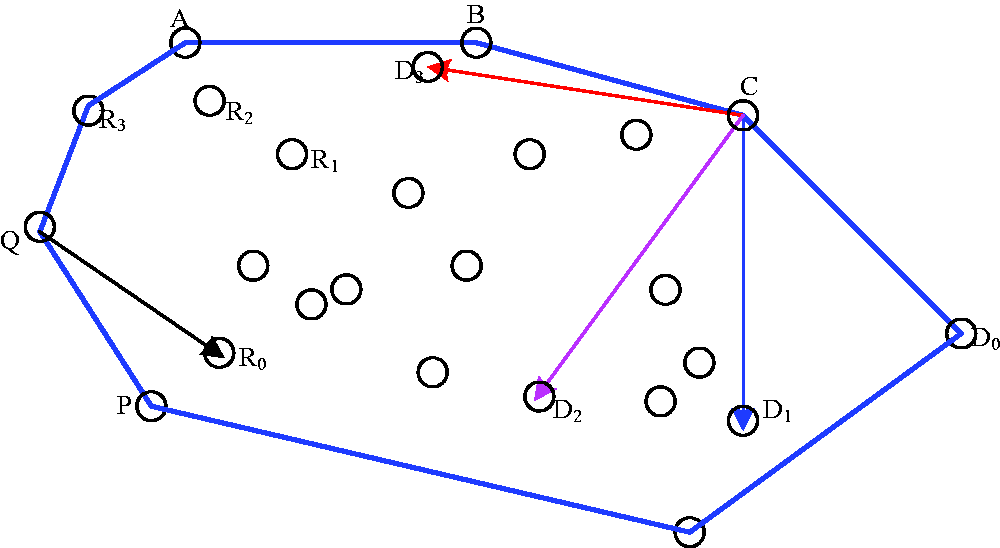
Figure 10 explains the algorithm for obtaining the vertex of convex enveloped polygons. Supposing points B and C have been obtained already, it is necessary to find next point D. At this time, the vector traversal operation is performed for the central points of all fibers starting from point C. Calculate the intersection angle of vector CD i (i = 1,2, …) and vector BC, and point D is the fiber center where the vector with the smallest intersection angle is located. Similarly, if vector PQ is known, the next central point R will be determined by the same method.

Algorithm diagram of obtaining convex enveloping polygon.
Determination of outer envelope contour
The convex enveloping polygon through the center of the fiber only defines the outermost fibers, but it cannot completely contain the yarn. Only with the envelope of the outer edge of the outermost fiber can it completely surround the outer contour of the yarn. In Figure 11, all envelope centers A, B, … are known, and the fiber diameter at each convex polygon vertex is also known. The outer enveloping convex polygon A3B3C3D3Z3 is going to be calculated by extrapolating the distance of the fiber radius of the current vertex from the position of the convex polygon ABCDZ at its respective vertex. The essence of calculating the outer enveloping polygon is to calculate the vertex of the corresponding outer enveloping polygon of each enveloping central point. Take point A as example, it is necessary to calculate the corresponding point A3 as shown in Figure 11. Since all the fibers are considered as circles, the key is to calculate the position of the external common tangent points A1 and A2 with the previous circle and next circle, respectively. However, it is quite troublesome to choose the right 2 common tangent points from four common tangent points. A modification is fulfilled to find 2 points nearby instead but would not affect the final result too much. The difference is that line AA1 is perpendicular to line ZA instead of line Z2A1 as shown in Figure 11 or line AA2 is perpendicular to line AB instead of line A2B1. If the two circles are of same diameter, then there will be no difference for two different algorithms at all. The latter algorithm is illustrated as follows:

Schematic diagram of determining outer envelope polygon algorithm.
Draw a line perpendicular to line ZA passing point A, and find two points A1 and A4 on the perpendicular line, requiring AA1 = AA4 = the radius of the fiber at vertex A.
Draw two lines perpendicular to line AB through point A1 and A4, respectively, get two intersection points M and N. Since point M is on the extension of segment AB, it means that the corresponding point A1 is on the outer side, which will be retained; point N is on segment AB, indicating that the corresponding point A4is on the inner side of the contour, and will be discarded.
Similarly, through the vertex A, draw a perpendicular line of line ZA, find two points A2 and A5 on the perpendicular line, requiring AA2 = AA5 = the radius of the fiber at vertex A.
Draw two lines perpendicular to line ZA through point A2 and A5 respectively, get two intersection points. Since point corresponding to A2 is on the extension of segment ZA, it means that the corresponding point A1 is on the outer side, which is retained. However, the point corresponding to point A5 is on segment ZA, indicating that point A5 is on the inner side of the contour, and should be discarded.
Therefore, points A1 and point A2 are determined. Similarly, the points B1, B2, C1, C2 … corresponding to vertices B, C, … are calculated as well. Then vertex A3 of the outer enveloping polygon corresponding to A is obtained by calculating the intersection of lines Z2A1 and A2B1. On this principle, points B3, C3 … Z3 are also obtained. The external enveloping vertices are connected sequentially to form an outer enveloping convex polygon. In fact, for the sake of simplicity, when calculating the vertices of outer enveloping polygons, an average fiber radius is deduced from the inner enveloping line to avoid the problem that the edges of convex polygons are cut with other circles with larger radius near the boundary due to the small fiber diameter of some vertices.
Supposing the outer enveloping polygon has m vertices, the vertex is V1,V2, … ,Vm, respectively. Then, the area S of the outer enveloping polygon can be easily calculated by adding the areas of m-2 triangles V1V2V3, V1V3V4, V1V4V5 … , V1Vm−1Vm, respectively. Therefore, the filling rate of the fibers is given by the equation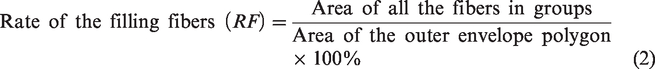
Theoretical relative average fiber distance (TRAFD) is another intuitive index to describe the strand integrity. Supposing all the fibers are evenly distributed in a square area, if RF is known, then TRAFD (g) is calculated based on Figure 12.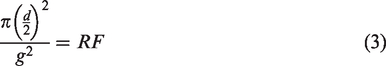


Schematic diagram of evenly distributed fibers.
Analysis of the morphology of the cross section
Fitting the centerline equation based on the least square method
The center line of n fibers clustered in the E-glass yarn can be fitted by least square method [23]. If the central coordinates of the fibers (x
i
, y
i
) are known (i = 1,2,3 … , n), and the center line equation is given by y = a + b x, then the parameters 


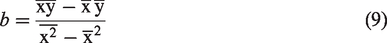

Determine the minimum rectangular box containing all clustered fibers
Based on the central line of the belt-shape cross section, the minimum rectangular box containing all the grouped fibers can be determined by the following steps: Draw the perpendicular lines from the center of each clustered fiber (center of the circle) to the centerline of cross section, the distances from the fiber centers to the centerline of the cross section and the coordinates of the projection points are obtained. Find the two points farthest (F1 and F2 in Figure 13) from the central line on both sides, respectively, the height or the shorter side of the minimum rectangle containing all the groups of fibers is determined. According to the two farthest projection points (corresponding to fiber F3 and F4 in Figure 13) on the central line, plus the average radius of the fiber, the length or the longer side of the minimum rectangle is determined. The principle is well described in Figure 13.
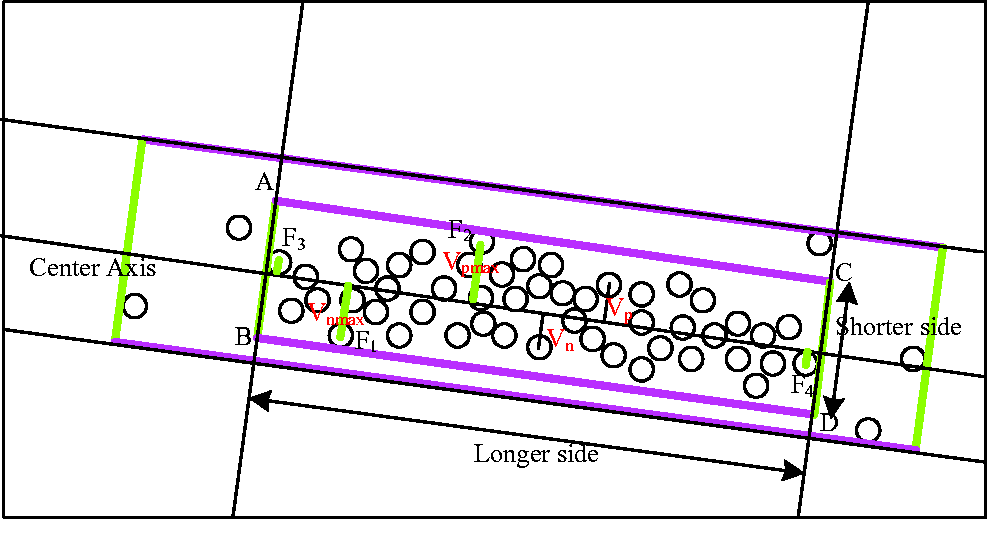
Schematic diagram of the comprehensive determination for the minimum rectangle.
Performance of belt-forming and its uniformity
Performance of belt-forming means that the outline of cross section of an E-glass yarn is expected to be belt-like. The outline of yarn is generally uneven, its contour can be compared with narrow rectangles or belts to calculate the similarity. There are a lot of literatures about the determination of similarity of curves and surfaces [24–26]. However, in this study, there are two implications, namely, level of thinness and its uniformity.
Level of thinness
Belt is a rectangle with a large length–width ratio. In order to obtain extremely thin E-glass fiber fabrics, the cross section of strand is expected to be an extremely compressed strip. Obviously, the longer the length of the long side of the minimum rectangle, the shorter the short side, the better shape of the belt-like yarn. Two indexes are introduced to characterize the features of the contour. Length–width ratio
The length–width ratio, that is, the ratio of the length and width of the minimum containing rectangle, can be introduced to judge the level of thinness. 2. Theoretical thickness of fiber layer
The total number of fibers in the yarn is fixed, ideally the fibers are arranged one by one without spacing in a rectangular as shown in Figure 5(a) or 5(b). Thus, the theoretical thickness of fiber layer Ttfl is given by the formula: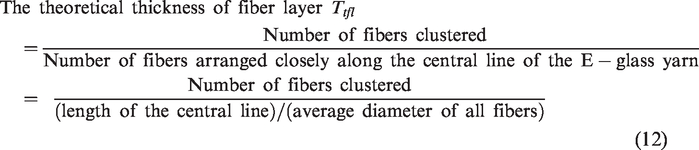
The theoretical thickness of fiber layer Ttfl can also be used to reflect the level of thinness. The smaller the value, the thinner the yarn, and the better the belt-forming.
Generally speaking, the smaller the value, the longer the centerline, the greater the degree of flattening, and the better the performance of belt-forming. If the yarn distribution is sparse, this value is also smaller, but strand integrity is poor. It should be noted that the fibers are generally not closely arranged on the centerline, therefore, the actual thickness of the fiber layer is greater than Ttfl.
Uniformity of belt-forming
Take the central line of the cross section as the reference, divide the line into k equal parts, find k−2 equal division points on the line, draw the perpendicular lines of the center line, get the intersection points with the polygon of contour on both sides, connect the corresponding points, form k−2 parallel dividing lines, then divide the cross section into k parts, as shown in Figure 14.
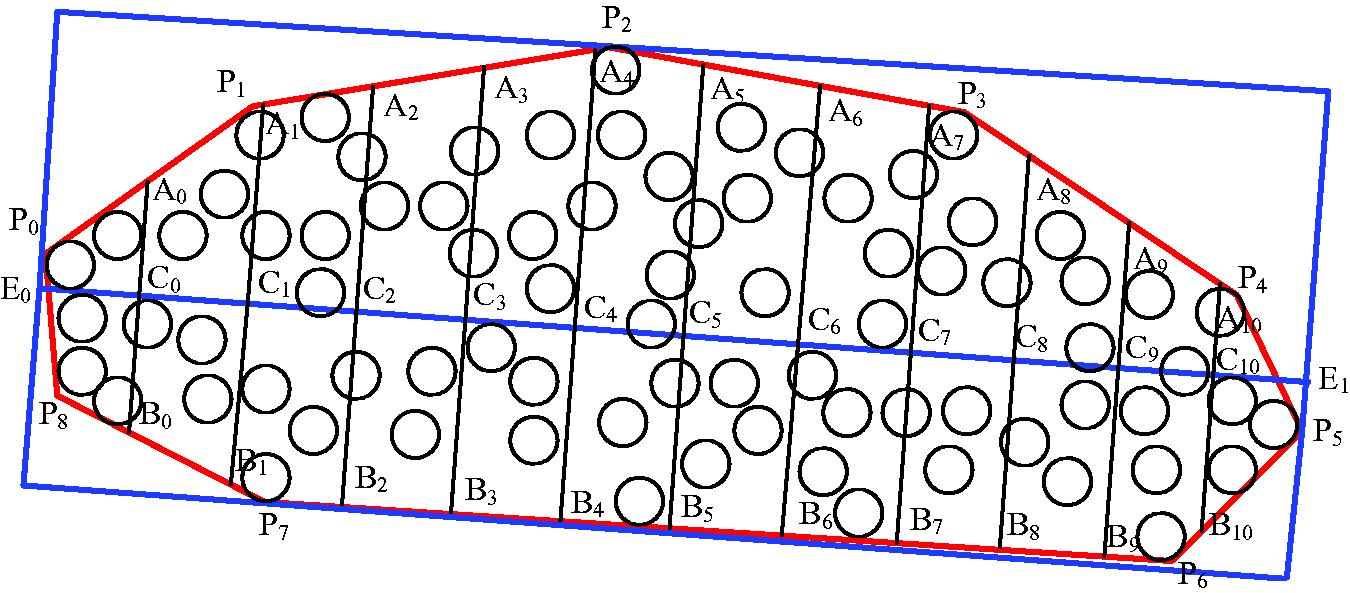
Schematic of cross section being divided into several parts.
Uniformity of geometric thickness
The length of each divider is the geometric thickness of the yarn at this position. The uniformity of the length of these dividing lines is the uniformity of the yarn geometric thickness, and also reflects the similarity with the rectangle. However, from the viewport of the rate of thickness changing, this study used the coefficient of variation (cv) of geometric thickness or contour shape to characterize its uniformity. 2. Uniformity of fiber distribution

The uniformity of clustering can also be discussed according to the distribution of the number of fibers in clusters. In different divided sections, it is possible to contain the same number of fibers, either with a large thickness (sparse fiber distribution) or a small thickness (dense fiber distribution) in space. When comparing in the section P0A0B0P8 and A9A10B10B9 as shown in Figure 14, although the geometric thicknesses of the shape are different, the number of the clustered fibers is the same number, i.e., 5.
Formula (13) can also be used to introduce the cv value of fiber distribution to reflect the uniformity of fiber distribution. The difference is that Li represents the number of fibers in each partition, i =1,2 … , k. If a fiber spans two sections, it is counted only within the section in which the main body is located. A fiber is judged in a partition only when the sum sd of the distances from the center of the fiber to the separation lines on both sides of the partition line is less than the distance between the separation lines. If sd is larger than the span of a section, the fiber is not located in the section.
When the glass fabric is compressed in making composites, the perpendicular distances among the filaments decrease dramatically, and cv of the geometric thickness will change accordingly. However, cv of fiber distribution is almost unaffected. Therefore, cv value of geometric thickness is only good for evaluating a single E-glass yarn and cv value of fiber distribution is good for the E-glass filament in both form of yarn and fabric.
Results and analysis of software test
Validation of the algorithm
According to the algorithms above, an application based on Microsoft Visual Studio 2010 is developed. Virtual yarns based on Figures 3 to 5 are constructed to testify the algorithm. Figure 4(c) is almost the same as Figure 5(a), and is excluded in the experiments. When the spacing threshold is set as 2d, the processed results are shown in Table 1.

From Table 1, it is observed that the algorithm is effective. Taking the strand integrity for example, the values of Figure 3(b) are better as expected than that of Figure 3(a) and 3(c) on the index of number of groups, rate of fibers in groups (%), rate of fiber filling (RF) (%). Similarly, the value of Figure 5(a) is better than Figure 4(b) and 4(a). If for the performance of shape-forming, the values of Figure 5(b) are better than that of Figure 5(a) and 5(c) on the index of average grade (round-off number), ratio of length and width, cv of geometric thickness (%), theoretical thickness of fiber layer (Ttfl), cv of fibers (%). As the reason for the value of theoretical thickness of fiber layer (Ttfl) is little low than what we may imagine is that the measured diameter of the fiber is a bit lower than the real diameter as shown in Figure 15 because the fibers are too crowdy. Figure 15 demonstrates how IPP automatically segments the images of the cross section of E-glass yarn and counts the areas of the filaments. Meanwhile, Figure 15 also indicates that the value of the measured diameter is quite accurate if the fibers are separated. If the average diameter decreases, then the number of the fibers along the axis of the cross-section yarn will increase, and the thickness of fiber layer (Ttfl) is reduced. Because the total number of the fibers in all these virtual yarns is <30, but there are 11 parts to place the fibers, which will result in a big fluctuation of fiber numbers. Therefore, cv of fibers (%) fluctuate dramatically in the experiment. Fortunately, there are at least 90 filaments in a single E-glass yarn, and the value of cv of fibers (%) would not fluctuate as the virtual yarns.
Schematic of segmenting Figure 3(a) by IPP.
Processing results of real E-glass yarns by software
Now, the real E-glass yarns will be tested by the algorithm. Take the yarns in Figures 1 and 2 as examples, the spacing threshold for clustering is set as 2d (d denotes the average fiber diameter) and each group is composed of two fibers at least. Therefore, the two fibers within 2d spacing will be regarded as clustered in group. Then, the processed images in Figure 16 are corresponding to the images of the cross sections in Figures 1 and 2, respectively. In Figure 16, the fibers in the same group are drawn in a color, and the isolated fibers are drawn in white color and marked with its order in the CNT file. The outer envelope polygon containing the clustered fibers can be adjusted automatically as required. The ruler drawn in white and marked with its order in the CNT file at the low right corner will not be counted and isolated away from the envelop polygon. The centerline of the cross section and minimum enclosing rectangle of the clustered fibers are drawn automatically simultaneously. By default, the centerline and outer enveloping contour are divided into 12 equal parts, and the number of fibers in the 11 compartments is automatically counted and the cv value of contour shape variation coefficient and yarn number distribution variation coefficient are calculated as well. For comparison, sample R1 and G4 are calculated another time at the spacing threshold of 1.4d. All the related calculated values are recorded in Table 2.

The processed images corresponding to Figures 1 and 2. (a) Processed image of the cross section of yarn R1. (b) Processed image of the cross section of yarn G1. (c) Processed image of the cross section of yarn G2. (d) Processed image of the cross section of yarn G3. (e) Processed image of the cross section of yarn G4. (f) Processed image of the cross section of yarn G5.
The processed results corresponding to Figure 14.

Analysis by rank order method
From a comprehensive view and compared with other samples, R1 has a better strand integrity, a large proportion of clustered fibers, a higher filling rate, a higher ratio of the length to width, and a uniform belt-like contour, while G5 shows the poor values in all aspects. These data correspond to intuitive observations well. Rank order method is used to give a comprehensive assessment for the strand integrity and belt-forming performance. The orders are ranked by the different aspects discussed above and the final rank is made by the sum of the orders. According to the observation by these limited examples, when spacing threshold is set as 2d, the assessment for all the six samples is listed in Table 3. It is necessary to note that RF is equivalent to TRAFD, so only RF is listed in Table 3.
The assessment grade of the six samples by rank order method when spacing threshold is 2d.

According to Table 3, the ranking of evaluation results is G4 > R1 > G1 = G3 > G2 > G5 for strand integrity and R1 > G2 > G1 > G3 > G4 > G5 for belt-forming performance, the ranking corresponds to evaluator’s intuition in most cases.
It is important to select the suitable spacing threshold to get a more reasonable assessment. For example, the evaluation result of sample G4 is quite good and even superior to sample R1 when the fiber cluster spacing threshold is set as 2d, which does not match the artificial observation. The source of the problem is probably that the outer envelope polygon is supposed to be convex to simply the calculation; however, it is not always the case. Take sample R1 for example, the suitable envelope polygon for the contour is actually a concave polygon. Instead, a convex polygon is used to describe the contour of the cross section of the E-glass yarn, the area of the clustered fibers is increased, and resulting in the decrement of RF and increasement of TRAFD. While the threshold value of group spacing is set as 1.4d, the treated result of G4 is shown in Figure 17. There are eight groups, and six fibers are isolated, and all the calculated value gets worse significantly. All the related data of G4 and R1 are also listed in Table 2. This indicates that the strand integrity and the performance of belt-like sample R1 is obviously superior to that of G4 in numerical value, which is equivalent to the visual observation effect. Therefore, before evaluating, it is necessary to test the sensitivity of setting the spacing threshold. A stable result might mean the distribution of the filaments is even, or the value of the spacing threshold is too large, and should be set smaller. To sample R1, it is more reasonable to compare its strand integrity and performance of shape forming at spacing threshold 1.4d rather than 2d. If it is not easy to determine the spacing threshold, different samples can be compared in different spacing threshold to give a comprehensive comparison.
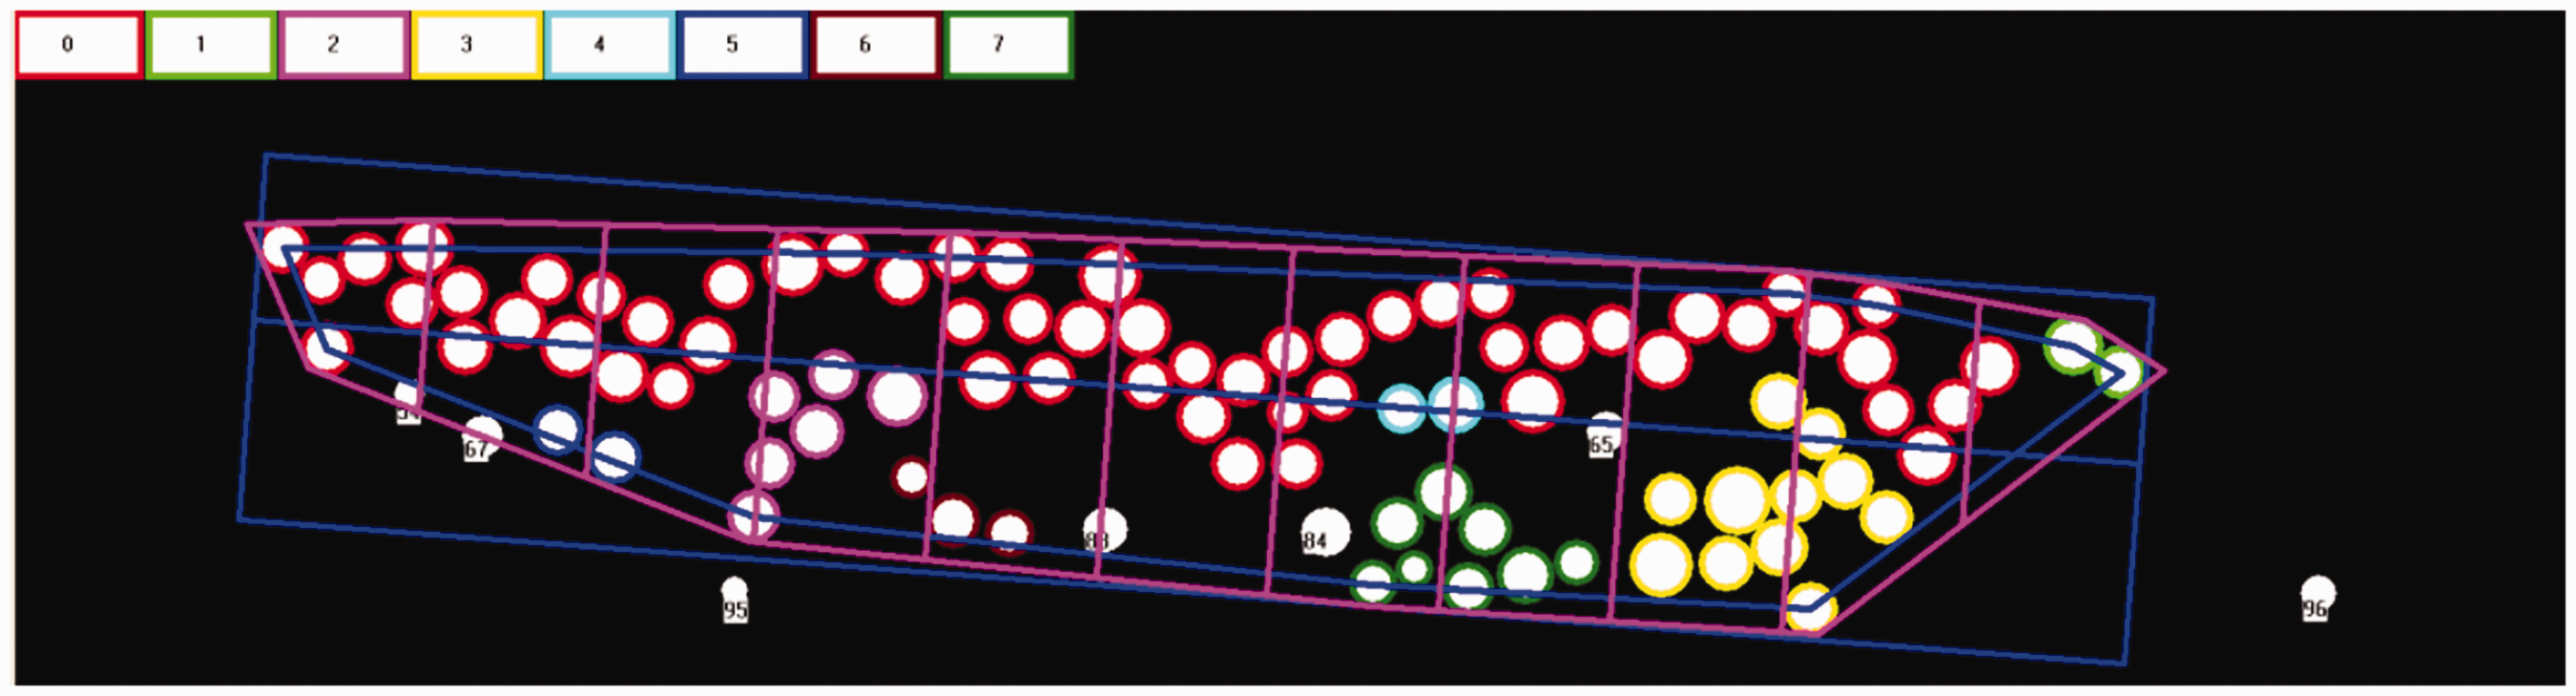
Image of fibers clustered for sample G4 when the spacing threshold is set as 1.4d.
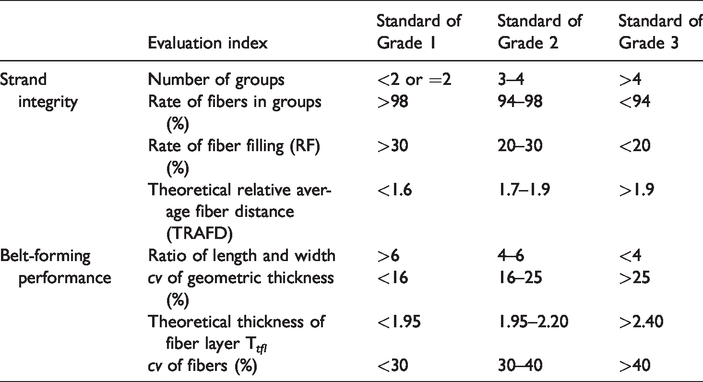
Rank order method can only be used to compare several E-glass yarns. An evaluating standard for E-glass yarn is recommended in Table 4 when spacing threshold is 2d based on Table 2. According to the standard, the evaluated grades of the six examples are listed in Table 5.
The recommended evaluating standard for E-glass yarn when spacing threshold is 2d.
The evaluated grades of 6 examples according to standard listed in Table 2.

The evaluated standard list in Table 4 should be optimized with more samples. Similarly, the clustering algorithm has yet to be optimized, such as for judging a single isolated fiber No. 62 of sample G1 which is surrounded as shown in Figure 16(b). Outer envelope convex polygons are sometimes far away from the real yarn edge, resulting in some fibers on the edge having a large impact on the shape of the polygon and a small filling rate calculation, such as for sample R1 as shown in Figure 16(a).
Conclusions
Through the analysis of morphology of cross section of the sized E-glass yarn and the calculation by software, the following conclusions are drawn: It is possible to objectively evaluate the strand integrity and the performance of belt-forming of sized E-glass filament yarn according to the images of the cross section. The evaluated indexes include number of groups, rate of fibers in groups (%), rate of fiber filling (RF) (%), average grade (round-off number), ratio of length and width, cv of geometric thickness (%), theoretical thickness of fiber layer (Ttfl), cv of fibers (%). The values are dependent largely on the spacing threshold. Rank order method can be used to rank the strand integrity and the performance of belt-forming of sized E-glass filament yarns. A given E-glass filament yarn can be assessed at a grade by a recommended standard, which requires to be optimized in future.
Footnotes
Declaration of conflicting interests
The author(s) declared no potential conflicts of interest with respect to the research, authorship, and/or publication of this article.
Funding
The author(s) disclosed receipt of the following financial support for the research, authorship, and/or publication of this article: This work was supported by Henan Provincial Science and Technology Projects (grant number 172102410045).