
Abstract
At present, there are many methods to measure the diameters of filaments in E-glass yarn, but only the average diameter is reported, which cannot reflect all the filaments in the yarn. The methods based on physical principle are not intuitive, the data based on the longitudinal fiber diameter image measurement method are not comprehensive, the observation on the cross-section image of yarn based on slice-making is time-consuming and labor-intensive, and requires manual measurement or self-developed software application. In this article, Keyence VK-X110 3D laser morphometry microscope was used to quickly obtain the cross-section image of glass filament yarn without making a slice of E-glass yarn, and Image-Pro Plus was used to measure all the filaments' diameters in the yarn automatically. The measurement data and analysis show that under the condition of completely processing all the filaments' image, minor axis of filament cross-section is approximate to the filament diameter. This method is not only able to verify whether glass filament yarn meets the quality criteria of ASTM D578-00, but also provides the diameter distribution of all the filaments in an E-glass yarn. In addition, the data support more comprehensive evaluation standard for the quality of glass filament spinning.
Introduction
Fiber fineness has a great influence on the properties of textiles. The high-grade and ultra-thin copper clad plate manufacturers usually require the suppliers of glass fiber electronic fabric or E-glass yarn to provide the comprehensive information of filament diameter. However, at present, the supplier can only provide the average diameter of the fibers according to the inspection report, but unable to give the fineness information of all the individual fibers.
There are many methods to measure fiber fineness or diameter, which can be divided into indirect physical methods and microscopic image methods. Indirect physical methods include gravimetric method, vibroscope method [1], airflow meter method [2,3], sonic fineness measurement [4], and laser interferometry measurement [5], which generally measure the diameter of a single fiber/filament or the average diameter of a strand of fibers and cannot obtain the information of all the single fibers in an E-glass yarn. The measurement error will increase if the filament comes near 5 µm which is just about the size of the E-glass filament when using laser interferometry method [6]. Micrographic image method for measuring the parameters of the textiles is quick, accurate, intuitive, and easy to understand. For example, twist of the yarn and warp/weft density of the woven fabric were reported to be measured by automatically scanning and processing the images in references [7] and [8], respectively. For measuring more tiny objects such as the fibers’ diameter, the fiber images are magnified, then manually measured [9] or automatically measured by computer image processing algorithm [10–16]. The microscopic image methods can be divided into two types: measuring the diameters along the longitudinal axis of the filaments or the cross-sections of the filaments. When the longitudinal axis of the filament is enlarged, sometimes only one fiber image can be enlarged, or the fibers need to be dispersed in a certain liquid and measured manually with the naked eyes. Only 25 filaments are measured according to ISO 1888:2006 or GB/T 7690.5-2013; however, there are at least 50 filaments in a single E-glass yarn and the number may be as high as 400. In the research of the nano-electrostatic spinning of nonwoven material, the fiber diameters are measured by capturing the longitudinal axis images of the fibers with SEM, and the free software package DiameterJ [17] is used to help measure the diameters. However, only part of the fibers' axes appears in the view of field, it is still difficult to measure hundreds of fibers simultaneously.
Amplifying the fiber image in the yarn cross-section seems to be a solution for this problem since all the fibers can be shown in the image. But currently, both optical microscopes and SEM for obtaining the cross-section images of yarn require ultra-thin slices to observe, which is a time-consuming process and does not necessarily result in a successful fabrication the first time. In the process of making slices, resin is needed to anchor the fibers, which will form a complex image backgrounds, and leads to difficulties in the subsequent image processing and recognition process. Manual measurement might lead to an error and exhausting labors while automatic measurement requires the complex algorithms to process image.
In this study, it is attempted to obtain a clear image of the cross-section of an E-glass yarn quickly by using the laser 3D morphological measurement microscope without making yarn slices, and to measure the diameters of all the glass filaments by using the general image processing software Image-Pro Plus (IPP) that is accessible and convenient to average users.
Rapid acquisition of cross-section image of E-glass filament yarn
The cross-section image of yarn is usually obtained by placing the slices of yarn under a microscope. The diameter of the electronic glass filament is about 5 µm, which requires magnification of 1000× to obtain a clear image. In the case of large magnification, in order to avoid blurry image caused by inaccurate focusing, ordinary microscopes require very thin yarn slices. However, topography-measuring microscope Keyence VK-X110 based on confocal laser technology uses laser scanning in the X and Y directions to get image, then drives the objective lens in the Z-axis direction, so the yarn on the objective stage is scanned layer by layer [18]. There is a difference of illumination height of 0.13 µm between each layer. After several images of multiple cross-sections of the filament yarn are obtained, the imaging synthesis is carried out layer by layer to form a super-clear image with a large depth of field. In other words, a smooth and thin surface for accurately focusing on is unnecessary with the help of Keyence VK-X110. The magnification of the microscope can reach up 18,000×, which is accurate enough to meet the measurement requirements for fiber diameter.
With Keyence VK-X1103D laser morphometry microscope, it is easy and quick to obtain the magnified image of the cross-section of yarn. The steps to obtain the cross-section can be described as following: (1) straighten the glass filament and place it on a narrow piece of adhesive tape; (2) use a pair of sharp scissors to cut off one side of the tape along a straight line so that the top of the glass yarn is roughly leveled with the top of the tape; (3) clamp the tape with two glass slides to make the yarn stand upright on the stage of the microscope, as shown in Figure 1; and (4) close all the windows of the room and switch off the fan or air-conditioner to avoid the air flow to the stage of microscope because a tiny breeze will affect the focusing on the fibers and result in a blurry image; (5) observe the cross-section of the yarn on the screen, set the top position and the bottom position of cut surface of the yarn to observe, set the parameters like pitch, resolution, accuracy and intensity of the light source, and take the picture of the cross-section of the E-glass yarn. In less than 2 min, a clear photo of the cross-section of the E-glass yarn is obtained. It should be noted that the scissors are sharp enough to cut the yarn at a stroke. There is no special requirement for the thickness of the blade. In the experiment, FOREVER COS-HWP scissors made of zirconia ceramics are used.

E-glass yarn (almost invisible) standing upright with adhesive tape (white block) on the stage.
Usually, the scissors cannot cut the filament yarns extremely even, a height range of 2 µm is set to allow the microscope to capture the image of the layers. If the height range is set larger, a long period of composing the images of different layers is needed; however, if the height range is set smaller, the image of the cross-section may be fragmentary due to an imperfect smooth cut surface. Generally, there is a white irregular area at the top of the picture, which stands for the adhesive on the tape. The area can be directly filled with background color and deleted. The obtained cross-section image of the D900 E-glass yarn of manufacturer A is shown in Figure 2. In general, most fibers are clearly visible in the field of vision. Cracks and shade effects are also distinct, which means the cut surface is not smooth. However, it does not affect the measurement but might cause difficulty in preprocessing.
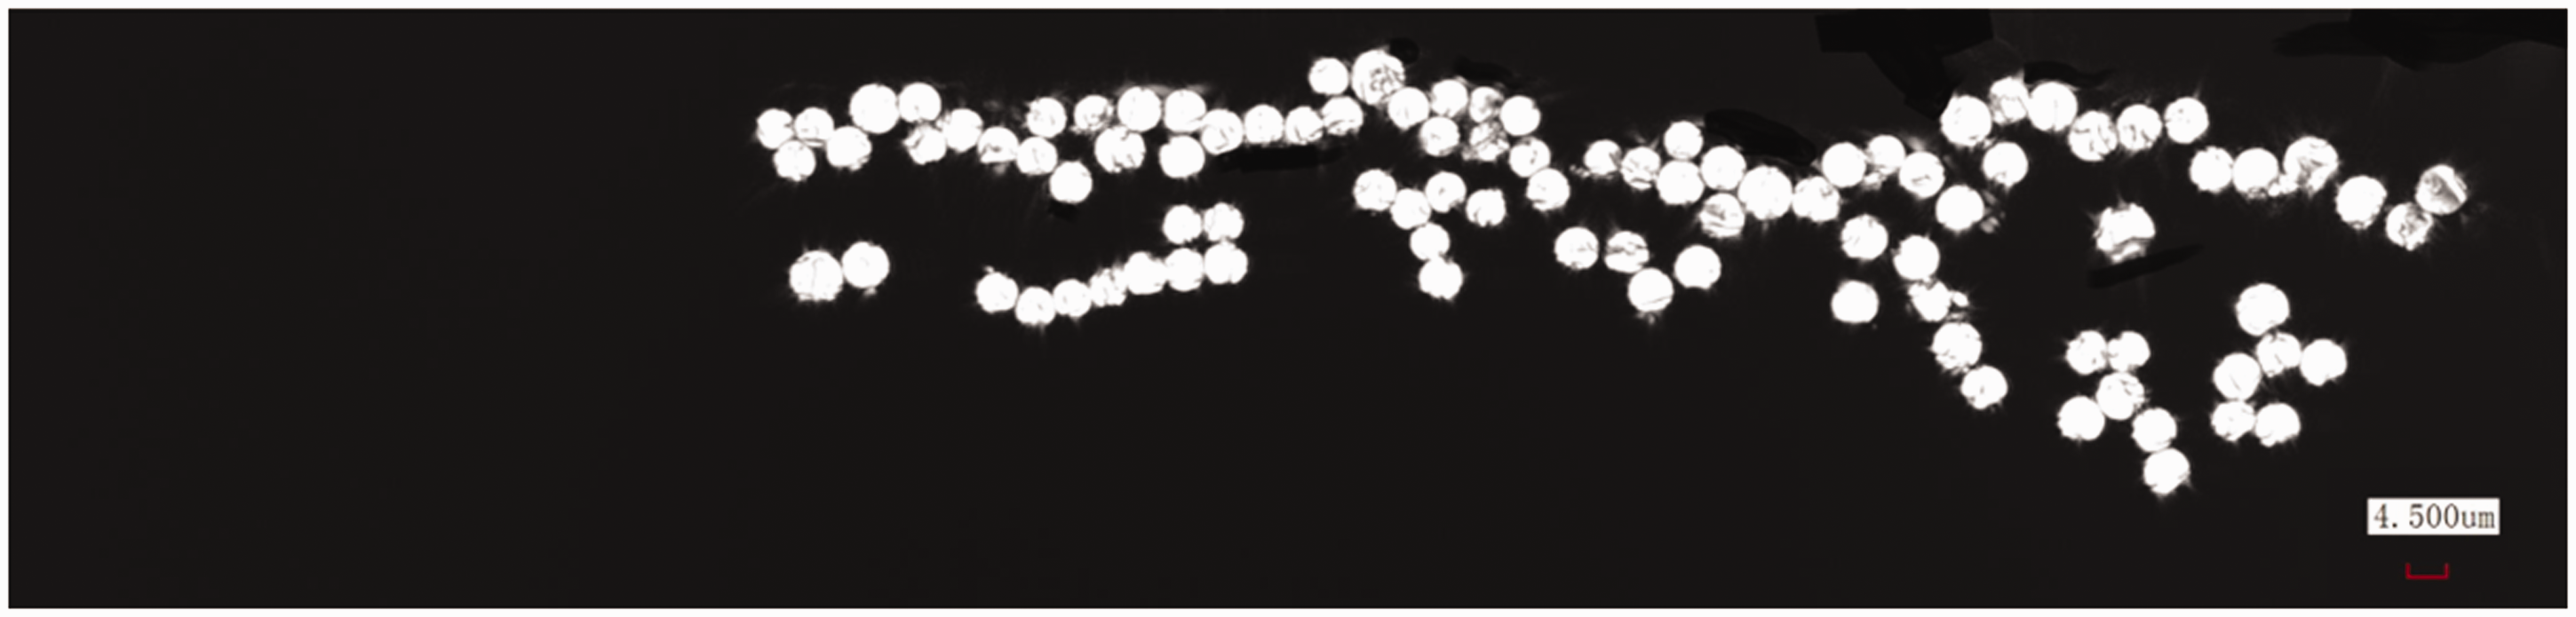
The cross-sectional image of D900 E-glass filament yarn of manufacturer A (hereinafter referred to as yarn A).
If the number of fibers in a single glass yarn exceeds 400, some fibers may not be found in the field of vision. Therefore, it is necessary to use the Keyence topological meter with electric object stage. By moving the object stage accurately, multiple photos are taken, and then the images are spliced automatically.
Measuring all fibers’ diameters with IPP
After obtaining high-resolution cross-section images of yarns, many researchers used image processing techniques to develop applications to measure fiber diameter automatically. But it is a cumbersome and time-consuming process. The specific software is not accessible to most of the average researchers. Some general image processing softwares, such as ImageJ and IPP [19] which are usually applied in biology research, can help researchers to obtain key information in images without developing applications. Image-Pro Plus image analysis software makes it easy to acquire images, count, measure and classify objects, and automate the research work. Since IPP is available on Internet and its accuracy in measuring has been accepted by millions of users, the aim of the article is to use IPP to measure the diameters of all filaments in an E-glass yarn. It is expected that with the help of IPP, each filament in the image of yarn cross-section is enhanced, segmented, identified, and measured in pixel. The results are then outputted for further processing.
Preprocessing and automatic statistics
To measure accurately, the large and irregular white area (adhesive of the tape) on the top area of the original image (which might contain few fibers) is removed at the first step. Then by threshold setting, image balance, scatter elimination, open operation to eliminate burr, closed operation to eliminate internal cracks, the cross-section image of the yarn is enhanced. At this point, the number of objects (filaments) in the image is ready to be counted using the IPP's automatic recognition and statistics function. Since the image itself is actually a grayscale map, IPP can automatically identify and count even without the above operations.
Image segmentation and merging
After automatic recognition, each continuous image block of similar grey is considered an object and is automatically numbered. A part of Figure 2 after operations is shown in Figure 3. As can be seen, this automatic recognition is not perfect. It identifies the fibers close to each other in the image as an object. With the automatic segmentation function of IPP, each fiber in the image is separated and the objects (fibers) will be renumbered, as shown in Figure 4. Obviously, image recognition has been greatly improved, but it still needs to be improved further. In Figure 4, the area P and Q which are excessively segmented are required to be manually merged. The objects No 35, No 41, and No 66 at area P should be merged as an object, so do as objects No 1, No 2, and No 6 at area Q.

Automatic image recognition at first time.

Automatic segmentation of the images.
After each manual operation, IPP automatically measures and counts, and the number of the segmented image is automatically updated. Figure 5 is an interface of IPP in processing image of cross-section of E-glass yarn A at an operation. As can be seen, there are 108 image objects identified in the image, some are very small blocks which should be ignored. These blocks may be the noise points that should have been removed in pretreatment stage, or a part of the fiber whose other part is obscure, or the adhesive particles on the tape. The small blocks can be kept temporarily. Finally, all the numbered objects should be checked to ensure they are processed reasonably manually or automatically. After outputting the measurement results, threshold value is set according to the image area. When the image area of an object is lower than the threshold value, it will be eliminated without any influence on the measurement results.

Interface of counting of IPP.
Measurement result output and Excel data screening and processing
When numbering the objects, IPP automatically or manually measure the relevant information of each numbered segmented image in the unit of pixel, including the central coordinate, area, major axis, minor axis, maximum diameter, mean diameter, minimum diameter, maximum radius, and minimum radius. The meanings of these terms are well explained in Figure 6.

Modes of measuring the size of an object in IPP. (1) Major axis; (2) minor axis; (3) maximum diameter; (4) mean diameter; (5) minimum diameter; (6) maximum radius; (7) minimum radius.
According to IPP, major axis is the length of major axis of ellipse with same moments of order 1 and 2 as object while minor axis is the length of minor axis of ellipse with same moments of order 1 and 2 as object. Maximum diameter is defined as the length of longest line joining two points of object's outline and passing through the centroid while mean diameter is defined as the average length of diameters measured at 2° intervals and passing through object's centroid. Minimum diameter is the length of shortest line joining two points of object's outline and passing through the centroid while maximum radius is the maximum distance between object's centroid and outline. Minimum radius is the minimum distance between object's centroid and outline. In order to obtain a stable result, major axis and minor axis are accepted to describe the size of the cross-section to avoid the dramatic variations due to the hump or the depression of the image.
Figure 7 shows the fiber number and its related measurement information of the corresponding image. These measurements can be output to Excel or in CNT (same as TXT) format. If the result is outputted to Excel, the size information of all fibers is sorted and the objects with extremely small areas shall be deleted according to the threshold. If the result is outputted in CNT file, all the extremely small areas have to be removed by developing a specific software.

Numbered objects and corresponding measurement information.
Accuracy of automatic measurement results
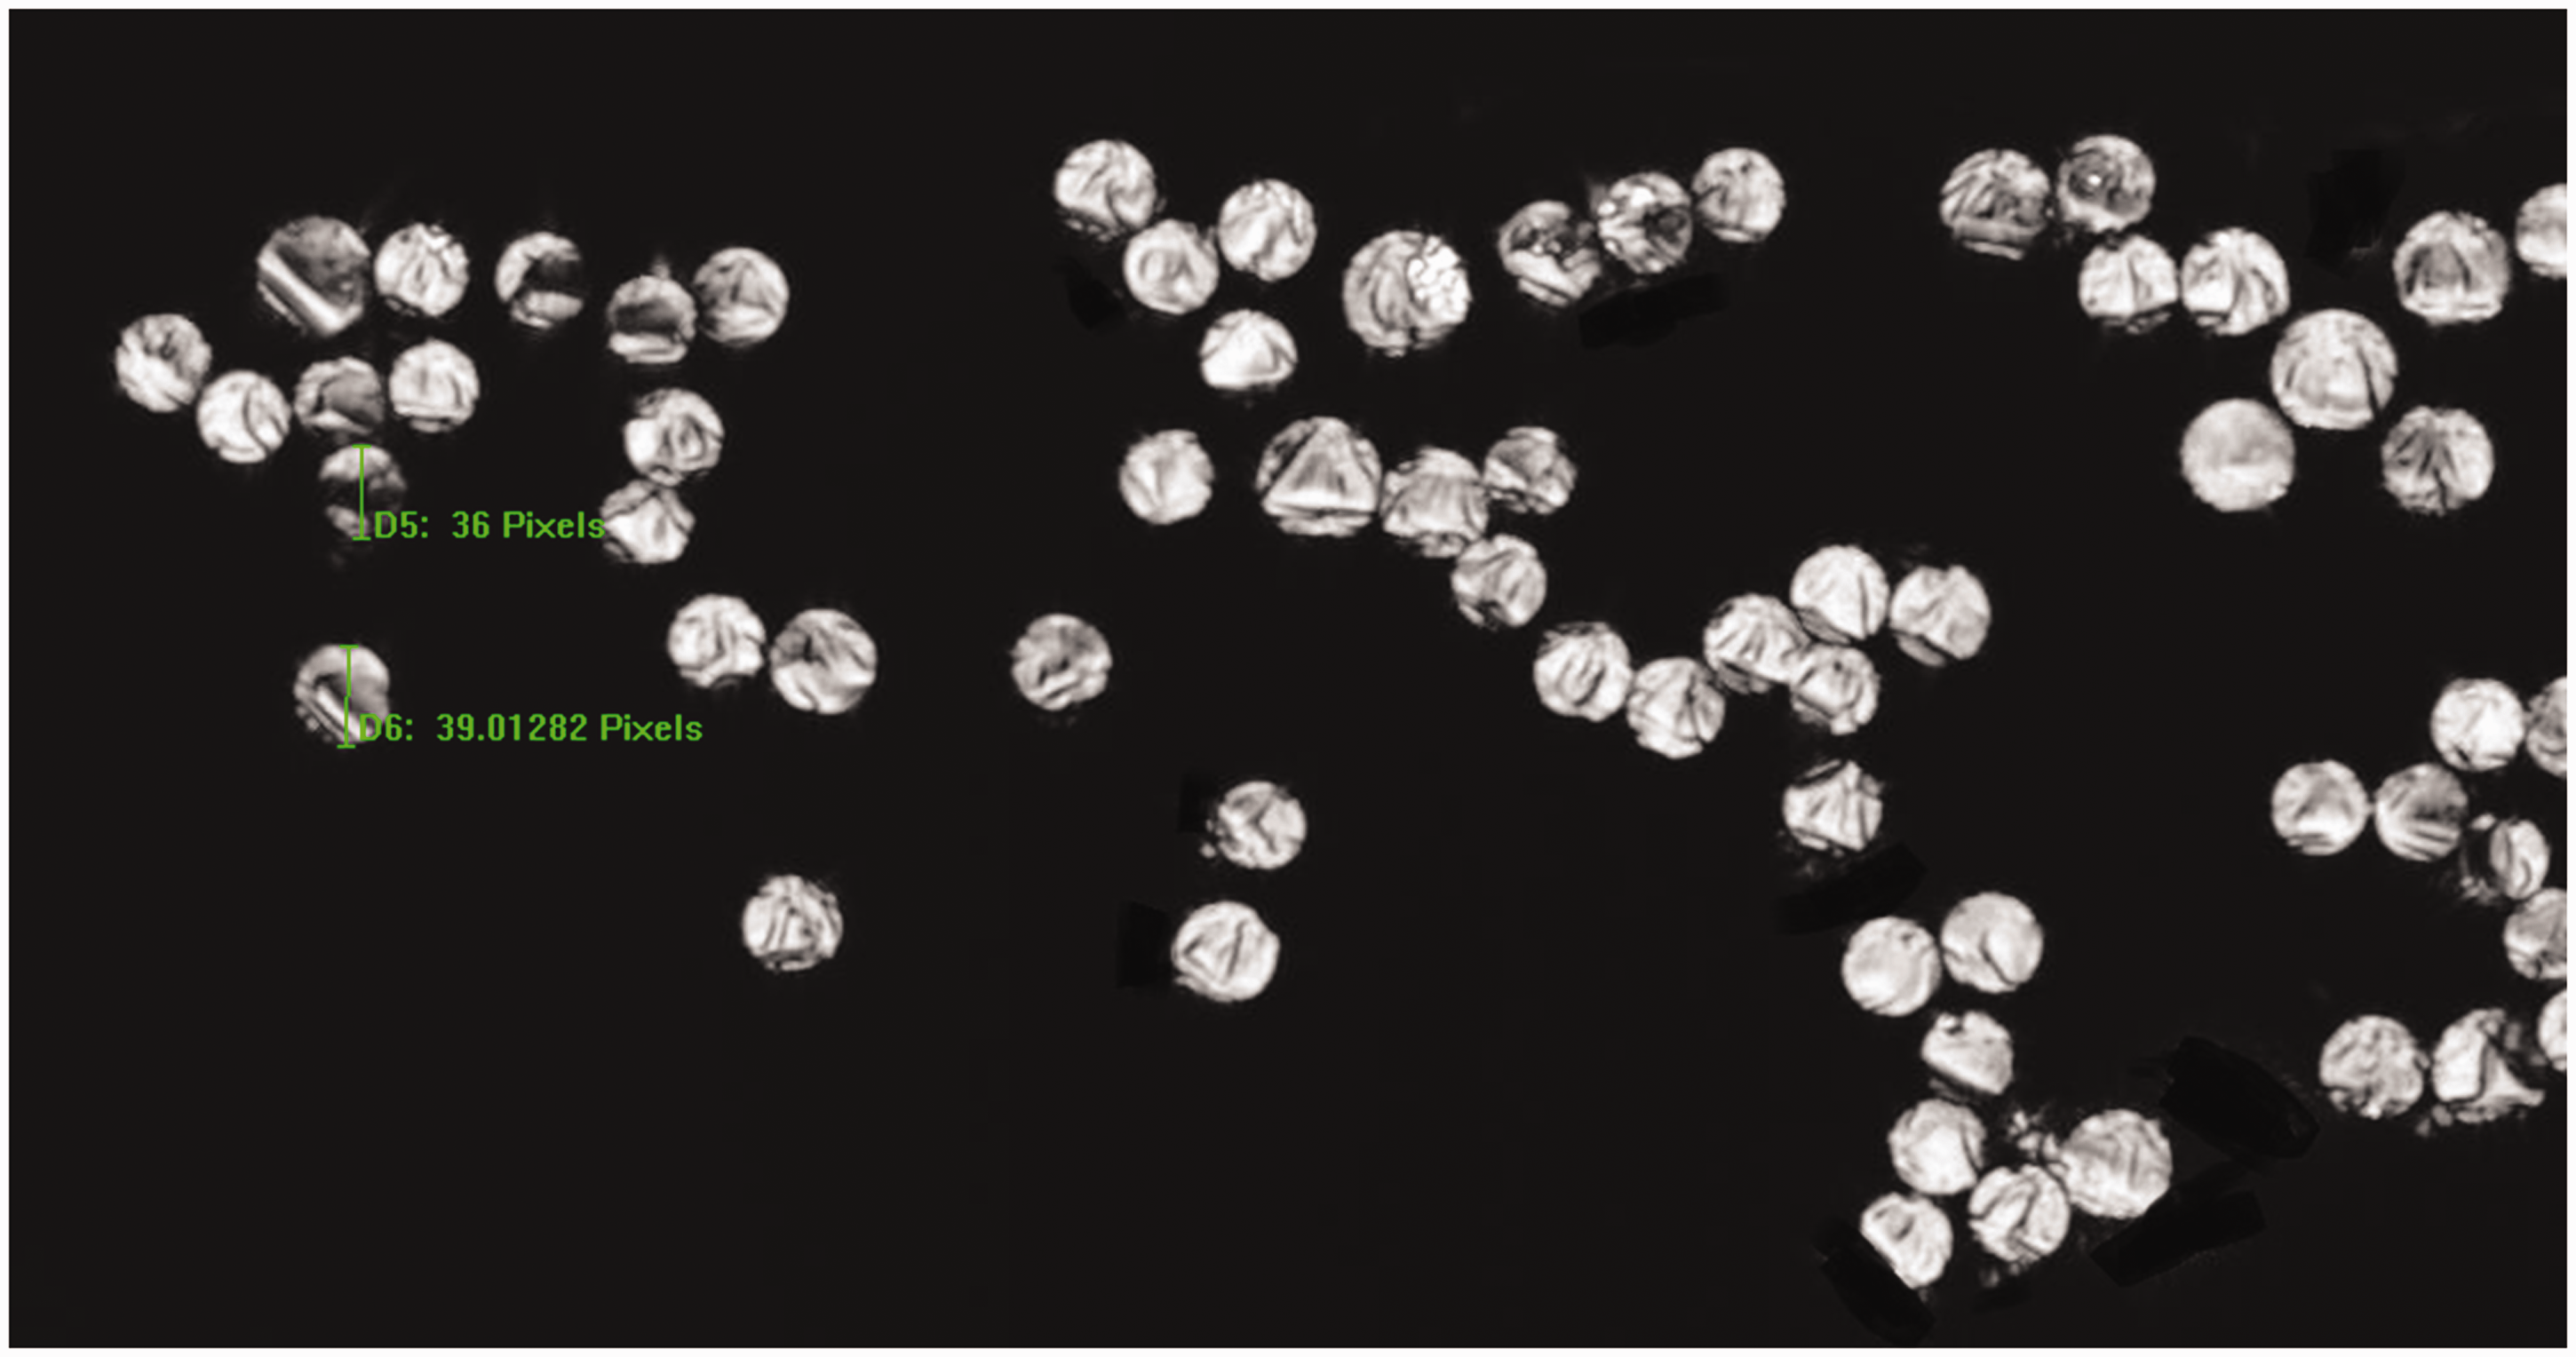
In order to verify the accuracy of IPP automatic measurement, the automatically measured data of the major axes of 39 fibers in the red circle in Figure 8 were compared in Table 1 with the manual measured data of IPP and the manual measured data by Keyence VK110 software. Figures 9, 10 and 11 shows the interface of manual measurement by Keyence VK110, automatically measurement and manual measurement by IPP respectively.

Original cross-sectional image of an E-glass yarn.
Manual measurement interface of Keyence VK110 software (partial data).

The automatic orders of the filaments by IPP.
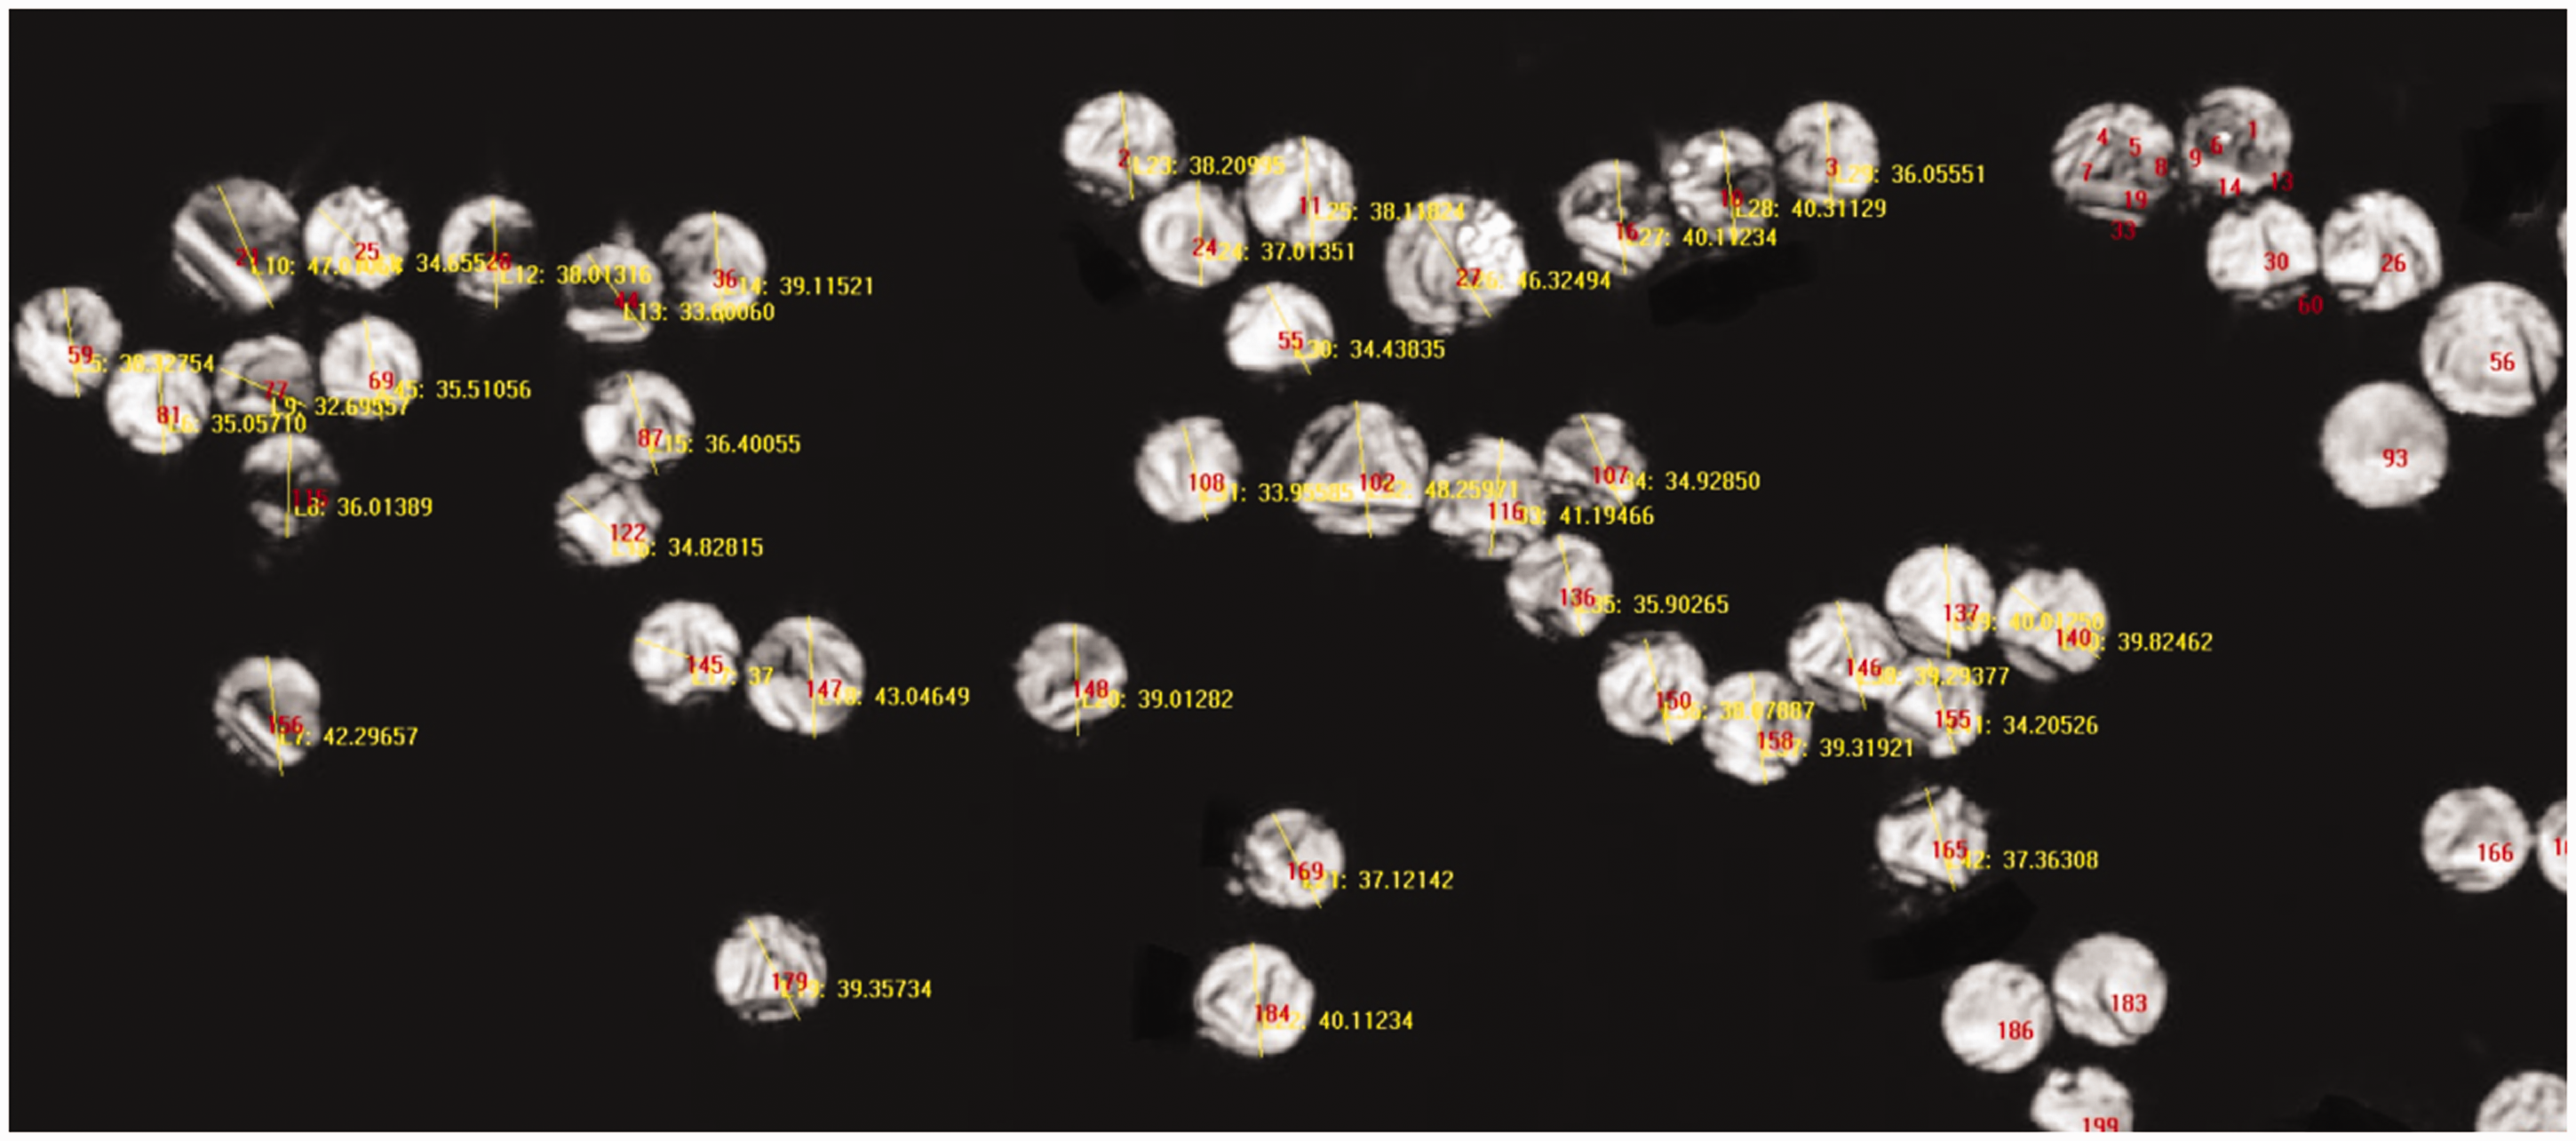
The manual order and the lengths of major axes by IPP.
Comparison of measurement data of fiber major axes by three methods.

As can be seen from Table 1, the difference between the IPP automatic measured value and at least one manual measurement value is within 1.5 pixels (4.5 µm/32 pixels), indicating a tiny error. Only two fibers (with automatic order No. 21 and No. 44) have the difference more than 3 pixels in both the manual measurements. However, if compared with the size of another two fibers (numbered as 116 and 81) of similar size for further analysis, it is found that the automatic measurement results are more consistent with the observation results, that is, the automatic measurement can eliminate and avoid the manual error.
Fiber diameter determination
Although IPP software can be used to measure the major axis and minor axis of each fiber, how to use these two axes to calculate the diameter of the fiber? Fiber diameter may be valued by the following options: major axis a, minor axis b or
The specifications of the yarn A, yarn B, and yarn C.

The measured data of yarn A, yarn B, and yarn C were obtained according to the scale conversion of cross-section images (32 pixels/4.5 µm under the magnification of 1000×), and the mean value, standard deviation, coefficient of variation, and range were calculated, as shown in Tables 3, 4, and 5, respectively. In the observation, 95 effective filaments are recorded while 1 filament is discarded for yarn A, 94 effective filaments are recorded while 3 filaments are discarded for yarn B, and 93 effective filaments are recorded while 6 filaments are discarded for yarn C.
The total area of the cross-section of E-glass yarn of three different manufacturers.

Data of fiber major axes of glass filament yarn of three different manufacturers.

Data of minor axes of glass filament yarn of three different manufacturers.
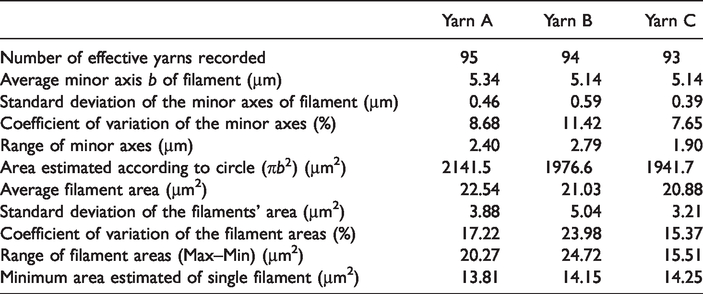
It is generally accepted that the section contour of glass fiber is round or elliptical. According to Tables 3, 4, and 5, it is assumed that all the fibers in yarn A, B, and C are ellipses. According to the value a of major axis and value b of minor axis of each fiber, the total theoretical areas calculated are 2397.5, 2104.6, and 2187.3 µm2, respectively. It is quite close to the measured area of 2377.63, 2083.91, and 2152.06 µm2 and it can be confirmed that the major axis and minor axis of the numbered objects are measured and calculated according to elliptic mode.
Since the glass fibers are spun at high speed, the thickness of each fiber is uniform within a certain length. One problem is that because the three yarns are weighed evenly, it is clear that the sum of the cross-sectional areas perpendicular to the fiber axis should be almost the same. However, according to the IPP automatic measurement results, the measured total area of the fibers (2397 µm2) in the cross-section is quite different from the theoretical value (2150.9 µm2) especially for yarn A which is 10.5% larger. Are there any problems with the above measurement methods?
Since the photo of cross-section is taken by capturing the image layer by layer, it is not important to ensure the cutting is on the horizontal level or the surface of the cut is smooth. To get a clear image, the key point is to keep the fiber in a straight status and fixed at the same position. To recall, when obtaining cross-sectional images of E-glass yarn, the yarn should be laid as straight as possible on the tape, but this does not guarantee that the yarns are perpendicular to the horizontal plane on the microscope stage. At the same time, the yarn has a weak twist, there must be some fibers' axial and yarns' axial that are not consistent when taking photos. Thus, the fiber image may be inclined and present an elliptical state, as shown in Figure 14. The slant angles of the different fibers vary, the larger the slant angle, the larger the height range of focusing, the longer the major axis of the fiber image might be, and the larger the difference between the measured area and the theoretical value. Obviously, the major axis of the ellipse a or
Now, the length of minor axis b measured by the image method is accepted as the fiber diameter, then the total fiber area can be estimated according to the minor axis diameter. In Table 5, the minor axis of yarn A is used as the diameter of the cross-section of glass fiber, then, the estimated total area of 2141.5 µm2 is very close to the theoretical value of 2150.9 µm2. However, the area of yarn B and yarn C based on minor axis b is less than the theoretical calculation area 2124 µm2, and even the area of yarn B calculated according to

The cross-section image of yarn B.

The cross-section image of yarn C.

Schematic diagram of oblique fiber projection.
If it is considered that 8 and 9 fibers are missing in B and C, respectively, then add them to the measured area according to the average fiber area. The total area of yarn B is 1976.55 + 21.03 × 8 = 2144.79 µm2, and yarn C is 1941.68 + 20.88 × 9 = 2129.6 µm2. The difference between the total area and the theoretical total area of 2124.0 µm2 is only −0.98% and −0.26%, respectively. Therefore, it can be concluded that the hypothesis of individual filament loss is valid.
The calculated area of the cross-section of A yarn is basically consistent with the theoretical area. After manual and automatic identification and repeated confirmation of 200 different samples, the maximum number of fibers in yarn A is 97, so it can be concluded that two fibers are lost. In this way, the total fiber area is 2141.5 + 22.54 × 2 = 2186.58 µm2. The difference between them and the theoretical total cross-section area 2150.9 µm2 is +1.65%, which is accurate enough.
Evaluation of fiber quality and diameter interval estimation
According to Table 5, it can be seen that the fiber in yarn A is the thickest, and the average fiber diameter in yarn B is the same as that in yarn C, but the standard deviation, range, and coefficient of variation of the average fiber area of yarn C are the smallest. So, it can be concluded that the filament in yarn C is the most uniform one. Figure 15 shows the distribution of filament diameters in yarn A, yarn B, and yarn C, respectively, and further demonstrates the statement.
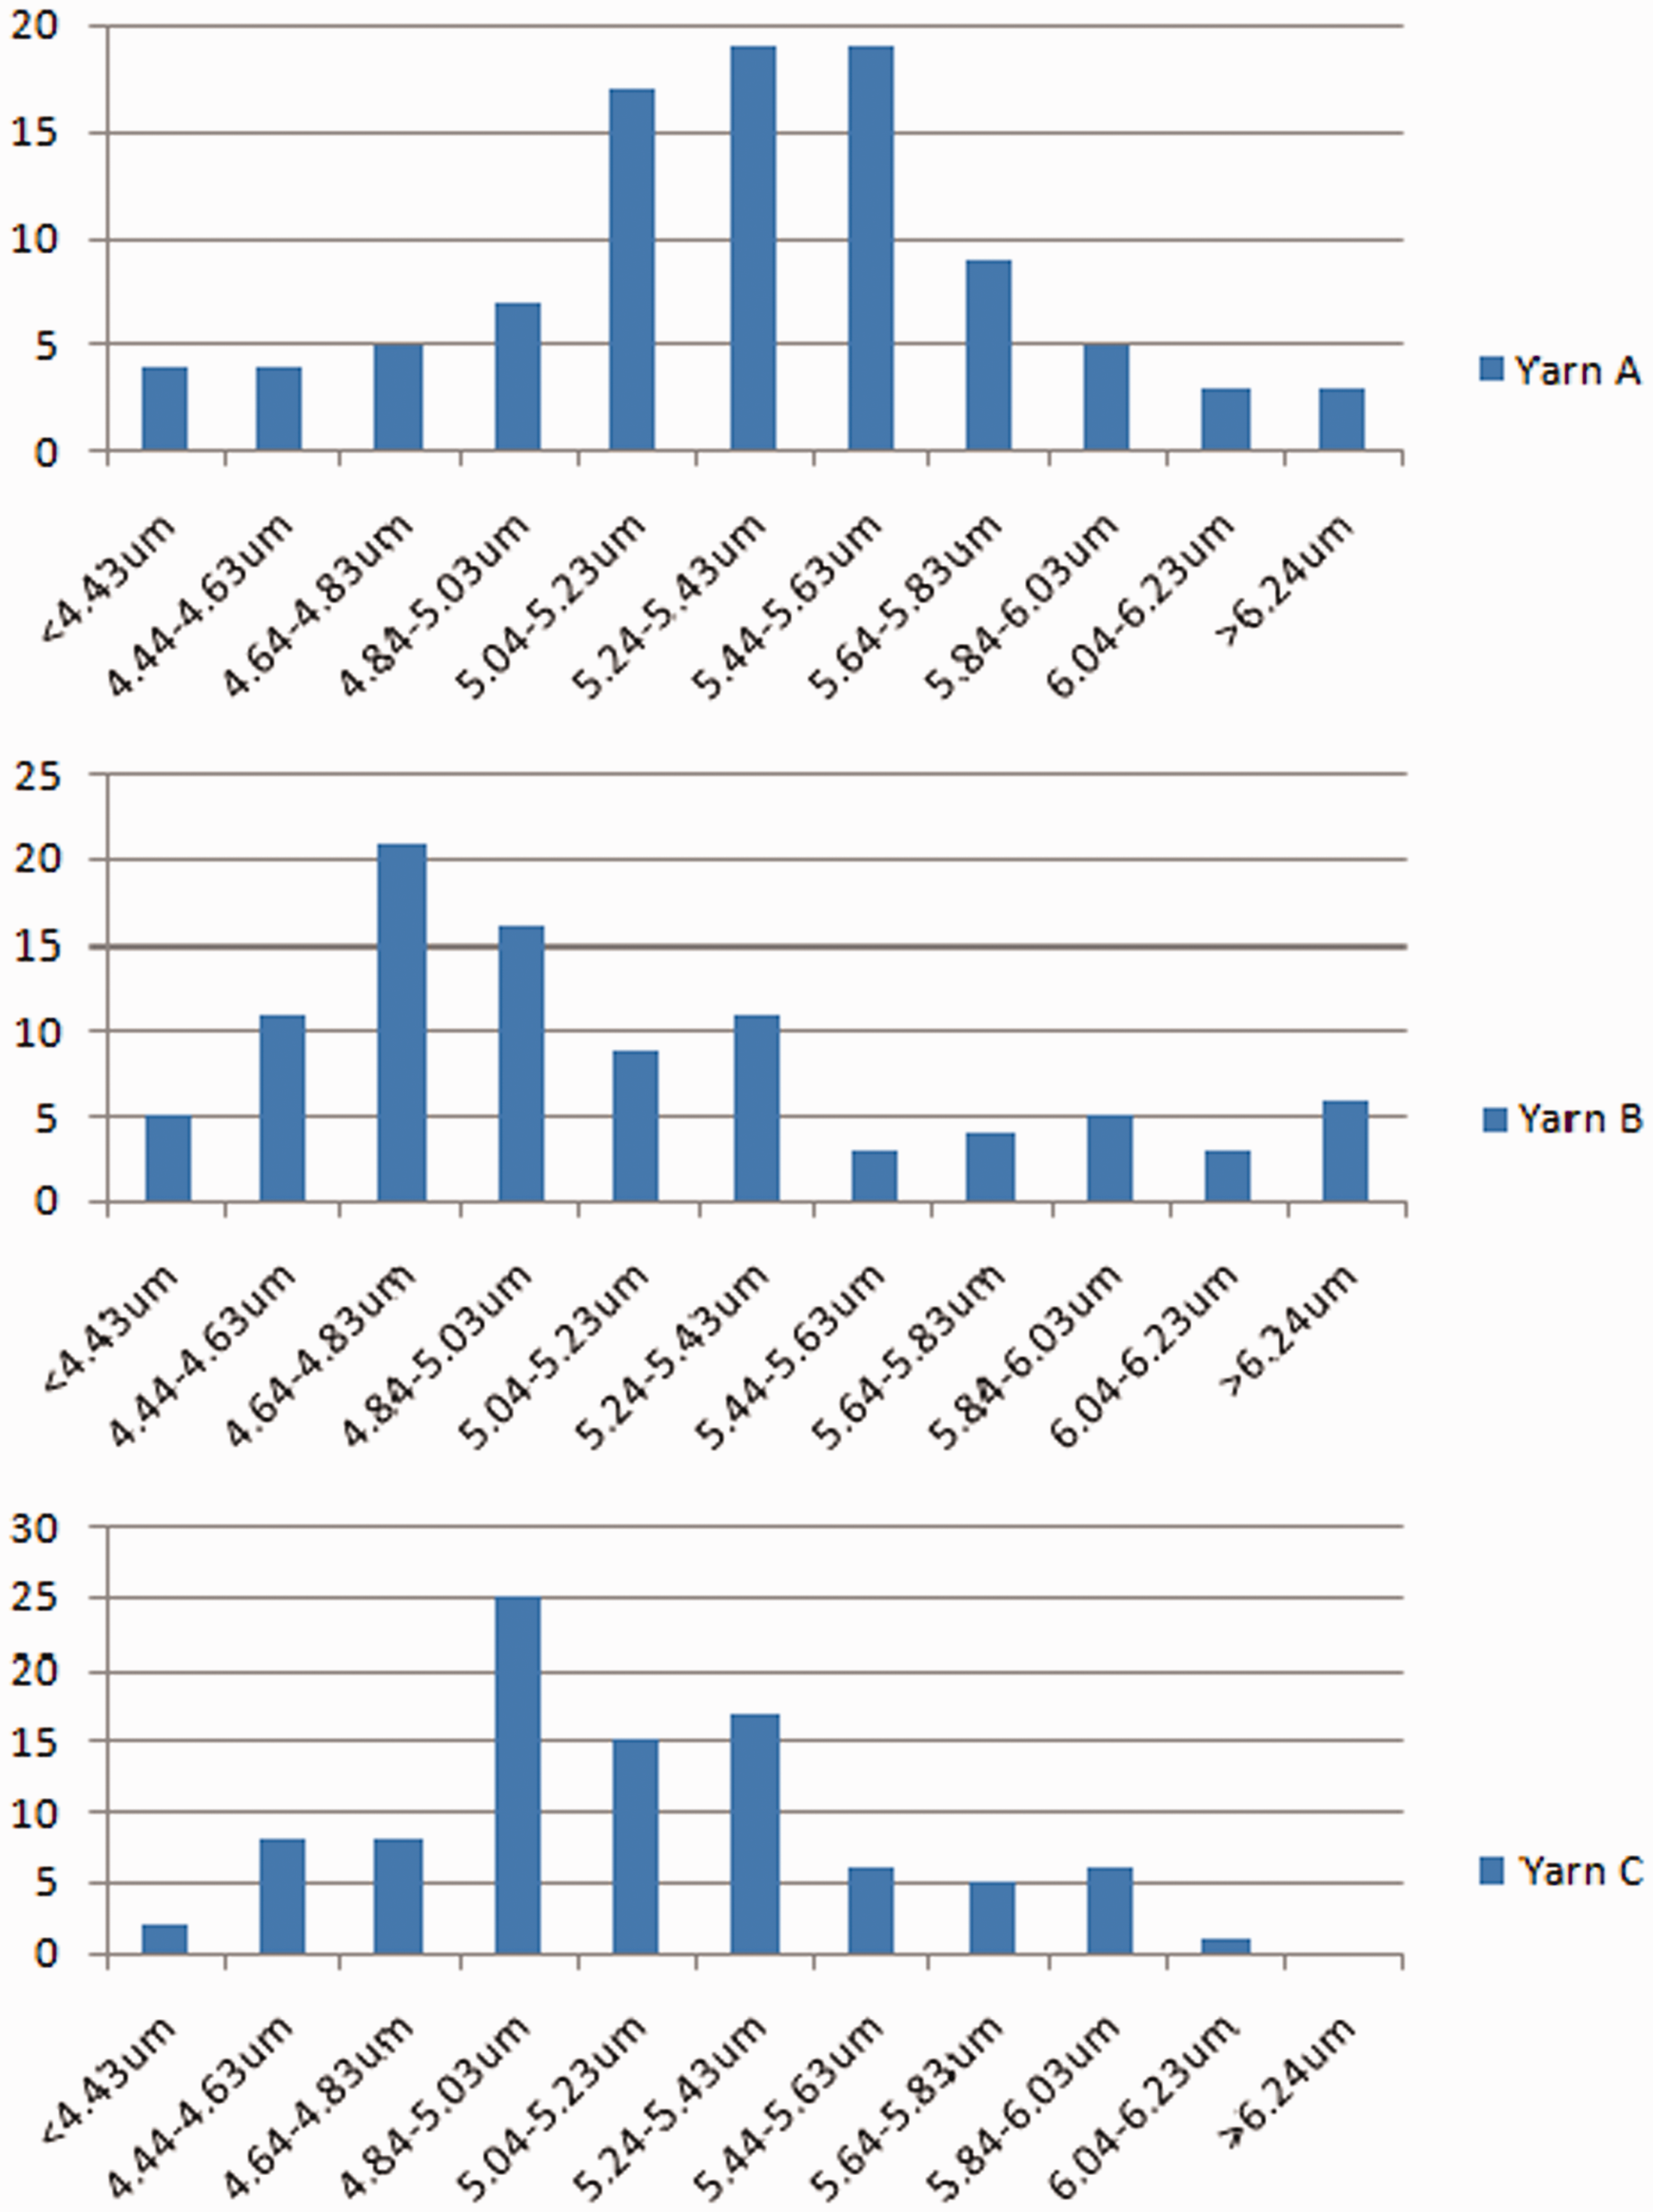
Distribution of filament diameters in yarn A, yarn B, and yarn C, respectively.
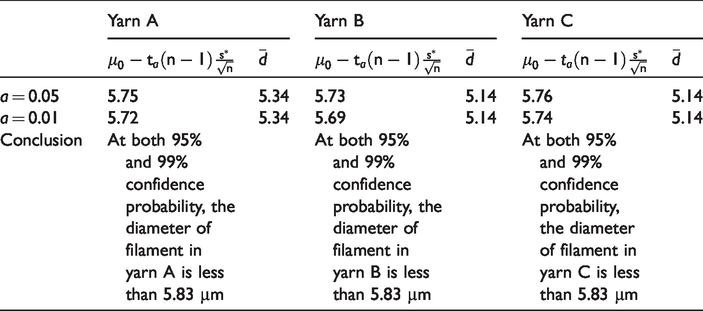
The value of diameters of all filaments in the glass E-yarn can be used to evaluate whether the fiber diameter in the E-yarn meets the requirements of ASTM D578-00 regarding whether the fiber diameter is lower than the maximum limit of 5.83 µm. Since the number of fibers in a single yarn is far more than 50, it can be considered as a large sample in statistics. If the fiber diameter is normally distributed, then T test is used to make unilateral interval hypothesis [21].
Therefore, the question is actually to testify hypothesis
If
Otherwise,
Here,
Results of unilateral test for maximum fiber fineness under different confidence probabilities.
The measured values can also be used to estimate the interval of average filament diameter. Assuming that all filament diameters in the E-glass yarn follow the normal distribution, the confidence probability is 95%, that is a = 0.05, and the values of t0.025(95), t0.025(94), and t0.025(93) are all regarded as 1.96, the confidence interval estimation of the average fiber diameters in the normal distribution is calculated and shown in Table 7.
The upper confidence limit and lower confidence limit of the average diameter of filament.

Since most of the filaments in an E-glass yarn are measured accurately, the data help to evaluate the glass spinning process. For example, the agglomeration effect of the fibers can be evaluated by a software based on the measured positions of each filament in the E-glass yarn. The fibers drawn in different colors show that they are in different groups in Figure 16, and the evenness of the fibers’ distribution can also be judged based on the measurement of the total fibers in yarn C.

Utilization of the measurement of the all fibers in yarn C.
It should be noted that in this study, image of cross-section of yarn can only be obtained for brittle circular filaments, such as the glass fiber, carbon fiber, and basalt fiber, which can also be measured by the method described in this article. For the staple yarn or the textured yarn with low modular elasticity, the top of the cut surfaces of the fibers cannot be fixed in observation; therefore, the area of the fiber varies from layer to layer when scanning by laser although a large scanning range is set, which leads to a blurry image of the cross-section produced. Since the fibers may bend in all directions, even if a clear image of the cross-section of the yarn is obtained, the minor axis is not equal to the diameter of the fiber, but larger than the diameter. Although non-circular fibers can obtain clear cross-section images, special processing is necessary according to the characteristics of cross-section. The method has not been attempted for the staple glass yarn due to its relative higher twist, which may contain excessive slant glass fibers. The fiber with spatial crimp cannot be accurately measured because the three-dimensional layer imaging is fuzzy and the minor axis of the image is larger than the diameter of the fiber.
Conclusions
According to image taken and the analysis, the following conclusions are made: Keyence XK110 3D laser scanning confocal microscope can quickly obtain cross-sectional images of E-glass yarns with good effects without laborious slicing process. The quality of the image is good enough for further measurement. IPP can be used to automatically measure the size of most filaments in the E-glass yarn, which is more reliable than the manual measurement method. By analysis, it is accurate to accept the minor axis of the cross-section image of the filament in E-glass yarn as the diameter. The positions of the fibers can also be obtained according to the total measured fiber diameters, which is convenient for further evaluation of the quality of E-glass yarn and fabric.
Footnotes
Declaration of conflicting interests
The author(s) declared no potential conflicts of interest with respect to the research, authorship, and/or publication of this article.
Funding
The author(s) disclosed receipt of the following financial support for the research, authorship, and/or publication of this article: This work was supported by Henan Provincial Science and Technology Projects [grant number 172102410045].