
Abstract
In the present work, impact and post-impact response of thermoset composite laminates manufactured from glass, flax, jute fabrics and their hybrid combinations (glass/jute and glass/flax) made with various stacking sequences was studied. The low-velocity impact response of these laminates was investigated by drop-weight impact tests at different energy levels (20–50 J). Additionally, their post-impact behaviour was studied by compression after impact tests, measuring their residual compressive strength. Impact test results showed that glass composites had higher impact resistance than natural and hybrid composites. Moreover, the hybrid composites with glass fabric layers in the exterior resulted in better impact resistance compared to composites where glass fabric layers were placed in the interior with flax or jute fabrics. It was also observed that natural and hybrid composites absorbed more energy than that of glass composites between 20 and 40 J. Glass composites exhibited higher compression and compression after impact strength than natural and hybrid composites. However, hybrid composites had higher compression after impact strength retention (%) than glass composites due to less fibre damages. The numerical analysis was also conducted to simulate the intra-laminar damages and delamination failures. Good agreement was observed between numerical and experimental results.
Keywords
Introduction
In recent years, composite materials have increasingly been employed in aerospace, civil and subsea applications due to their novel properties such as high specific strength and stiffness compared to metals and alloys. However, the use of composite materials in many critical applications has been limited due to their failure under accidental impact at low velocities [1]. Therefore, the damage tolerance has become an important parameter for designing composite laminates. Although synthetic fibres (i.e. glass and carbon fibres) reinforced composite materials have been widely used for structural applications due to the weight reduction made possible by their high specific mechanical properties. However, they are expensive and prone to damage under impact loading due to their brittle behaviour [2–4]. Hybridization is a common procedure adopted to improve damage tolerance, obtain specific properties and enhance the flexibility of composite materials [5–10]. Despite the fact that natural fibres as reinforcements in polymers can provide numerous advantages such as low densities, good sound absorption, non-abrasiveness, high specific properties and sharp curvature allowances (with no fracture) [11–13], their applications in the non-structural components such as panels, ceilings, partition boards and interior car components are still limited owing to their low impact resistance and difficulty in assessing the induced damage [14]. Thus, the combinations of natural fibres with low-cost engineering materials and synthetic fibres have generated great interest recently.
Hybrid layers (inter-ply layers) of composite laminates can strongly influence the mechanical properties [15,16], impact loading resistance and damage tolerance [17–19]. Ahmed and Vijayarangan [20] studied the effect of stacking sequence on tensile, flexural and inter-laminar shear properties of jute and glass fabric reinforced hybrid composites. They observed that using glass fibres as extreme layers enhanced the mechanical properties of the composites. Abdul Khalil et al. [21] compared the mechanical properties of oil palm of empty fruit bunch and glass fibre reinforced composites with different layer arrangements. They indicated that using glass fibres as outer layers improved the tensile and flexural strength of hybrid composites. Amico et al. [22] analysed the mechanical properties (tensile, flexural, short-beam strength and pendulum impact resistance) of sisal (S), glass (G) and glass/sisal (GS) fibre composites in various stacking sequences. They observed that highest impact resistance was achieved when glass fibre layers were stacked together in hybrid composite laminates. Ricciardi et al. [23] manufactured basalt/flax composites with three different symmetrical configurations to compare their impact damage tolerance. They observed that complex mode of failures and different damage areas occurred at the interfaces between different fibres types. Gujjala et al.[24] investigated the effect of stacking sequence of E-glass fabric layers combined with jute fabric layers on the mechanical properties of woven jute/glass fibre hybrid composites, i.e. tensile, flexural and inter-laminar shear properties. The results showed significant improvement in inter-laminar shear strength and tensile strength for composites prepared with E-glass fabric at extreme layers; meanwhile, the maximum flexural strength was obtained with composite GJGJ which has a fabric stacking sequence of “glass-jute-glass-jute.”
Many authors have reported the impact properties of natural fibre reinforced composites combined with synthetic fibres, while literature on their performances under post-impact loadings is scant. Rubio-Lopez et al. [25] compared CAI of flax/polylactic acid (PLA) and glass/epoxy composites. They observed that flax/PLA composites had higher normalised residual strength than carbon/epoxy composites. Dhakal et al. [26] indicated that combination of higher strain to failure fibres such as basalt with hemp fibres improved both post-impact and damage tolerance of composites. Ariff et al. [27] examined CAI properties of bamboo/glass fibre hybrid composites containing carbon nanotubes. Ismail et al. [28] analysed impact and compression after impact response of kenaf/glass hybrid composites and observed that larger damage areas reduced the compressive strength for all composites. Habibi et al. [29] investigated the low-velocity impact and post impact performance of flax fibre/epoxy composites under different impact angles. They observed that the impact damage areas increased at higher impact energies and angles while there was a drop in CAI strength with the increase of the damage areas and impact angles.
Up till now, far too little attention has been paid on the effect of stacking sequence on post-impact or CAI behaviour of natural fibre/artificial fibre (hybrid) composites in the available literature. In this work, therefore, we focus on the effect of stacking sequence on both impact and post-impact performance of hybrid jute/glass–epoxy and flax/glass-epoxy composites with different stacking sequences by comparing them with jute-epoxy, flax-epoxy and glass-epoxy composite laminates. Moreover, this paper adopts simulations with adding Abaqus software to predict impact behaviours of these composite laminates and comparison of these simulations with experimental results.
Material
Glass, natural and hybrid composite laminates were manufactured using woven glass, flax and jute fabrics. Details of these fabrics are presented in Table 1. Glass and natural fibre (jute and flax) fabrics were supplied by Fibermak [30] and Kumasci [31], respectively.
Fabric properties.

Hybrid preforms were prepared with different stacking sequences before producing the composite laminates as shown in Figure 1. The stacking sequences of other preforms are also presented in Figure 1. It can be seen that the natural fibre layers are placed either in the interior or exterior of hybrid composites for the comparison purpose. Composite preforms were infused with an epoxy system comprised of FBRMAK 1564 epoxy resin (75% wt.) and FBRMAK 3487 hardener (25% wt.) using vacuum bagging method as shown in Figure 2 at 90° centigrade for 1 h. The properties, i.e. fibre volume fraction, thickness and density of the composite laminates are given in Table 2, where GG, JJ, FF, GJ, GF, JG and FG are referred to glass/epoxy, jute/epoxy, flax/epoxy, glass-jute/epoxy, glass-flax/epoxy, jute-glass/epoxy, and flax-glass/epoxy, respectively.

Fabric stacking sequences of composite laminates (G: glass; F: flax; and J: jute fabrics).

Manufacturing of composites using vacuum infusion method.
Properties of composite laminates.

Test methods
The density of the composite specimens was measured using ASTM D792 - 08 standards through a digital densimeter. Glass fibre volume fraction of glass and hybrid composites was measured using the ISO 1172:1999 standard method by burning the epoxy and natural fibre parts of the composites. However, JJ and FF samples do not have any glass portion, thus burning of the samples may remove all the composite components. Therefore, volume fractions of the JJ and FF composites were calculated theoretically by using equation (1) [32]
Impact resistance of composites was measured using a BESMAK drop-weight impact testing machine as illustrated in Figure 3(a) with a 16 mm diameter striker at Mustafa Koseoglu Composite Lab, Istanbul Technical University. Composite samples were cut into 100 mm × 150 mm dimensions by following the ASTM D7136 standard. Composite specimens were subjected to 20 J, 30 J, 40 J, and 50 J to measure their maximum energy absorption and impact loads. Compression tests and compression after impact (CAI) tests were conducted on the already impacted samples using Zwick Roell/Z100 testing machine as shown in Figure 3(b) at a crosshead speed of 1 mm/min according to ASTM D7137. Impact damage regions were measured using Bs200Pro imaging program. Zeiss-EVO LS10 scanning electron microscope (SEM) was used to evaluate the impact failures of composite laminates at 30 kV.

Test equipment for: (a) drop-weight impact test and (b) CAI test.
Finite element model description
In order to investigate the damage failures of hybrid composite laminates theoretically, modelling methodologies of the composite materials failure and preload have been assessed. For this aim, a finite element model (FEM) with adding Abaqus software was developed using Hashin failure criteria for the composite materials and material model in order to simulate the failure mechanisms, force–time and energy–time histories. In the FEM, the sphere-shaped impactor was defined as a rigid body with radius of 16 mm and was placed right on the composite laminate with a given velocity of 1.12 m/s to give impact energy of around 30 J. Composite laminates were modelled with the S4R conventional shell element. This was a four nodes quadrilateral conventional shell element with a reduced integration scheme (mandatory for an explicit integration scheme) [33]. The finite element model of the impact system is illustrated in Figure 4. Elastic modulus (

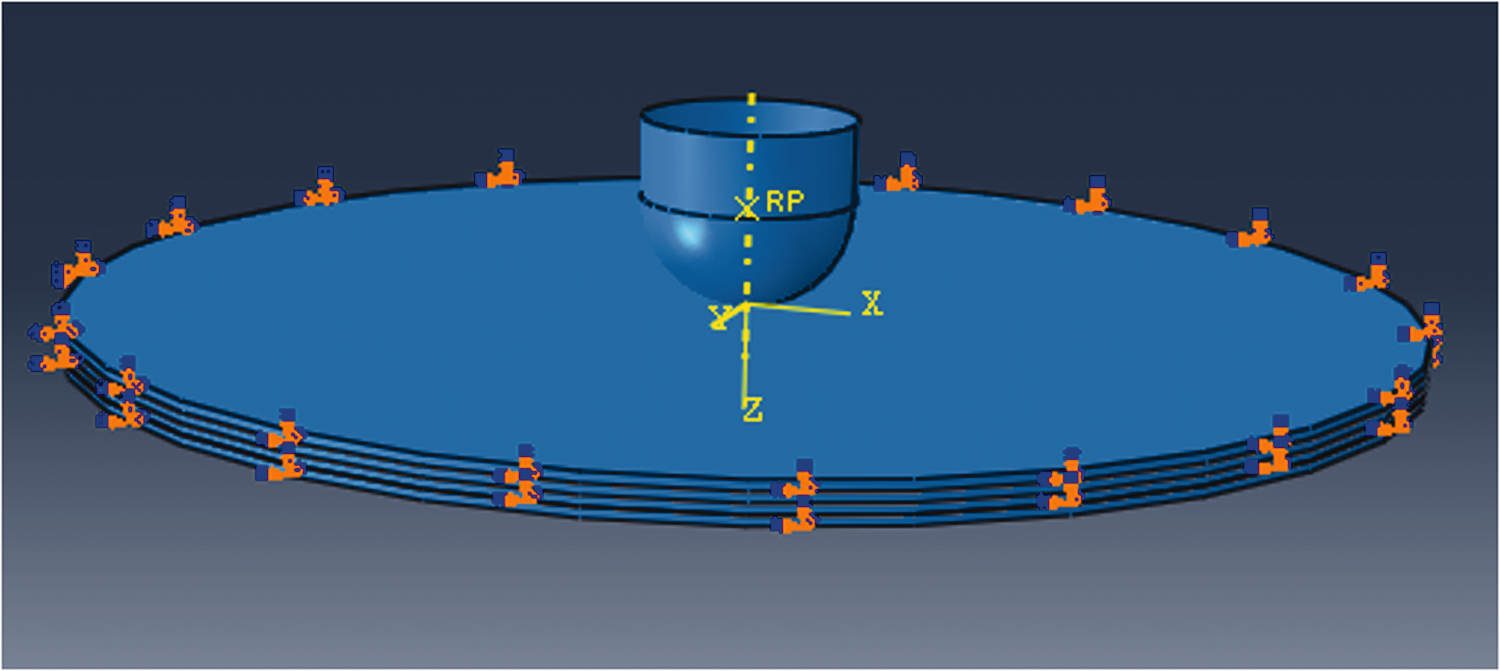
FEM model of the composite laminates and hemispherical impactor.
The longitudinal compressive strength (


In numerical simulation approach, intra-laminar damages in the composite laminates can be quantified either by using stress or strain based criteria or by employing suitable polynomial criteria such as Tsai Wu or Tsai Hill [38]. However, these polynomial failure criteria are not ideal at the ply level and are used only to predict the failure envelope of the laminate which are subjected to different multi-axial loadings. Hashin and Rotem [39] and later modified by Hashin [40] proposed that failure criteria can be applied at ply level. This criteria assume that the damage initiation occurs as degradation of the composite. There are four different damage initiation mechanisms which interact independently at the level of each ply in Hashin criteria. These damage failures are tensile fibre failure


The damage indices

Elastic and mechanical properties of composite laminates.

Tensile strength of epoxy (Zt) is 73 MPa.
Additionally, the properties and fracture parameters of the interface between the adjacent plies in the composite laminates, which are necessary to simulate the interlaminar damage failures, i.e. delamination, are listed in Table 4. Where 
The interfacial properties of composite laminates.

Results and discussions
Table 2 presents the properties of glass, natural (flax and jute) and hybrid (jute/glass and flax/glass) composites. Sample thicknesses are kept similar for the comparison purpose. It is evident that the density of glass/epoxy composites decreases after the addition of jute or flax fibres while the stacking sequence do not change the density values for jute/glass or flax/glass composites. Comparing total fibre volume fractions (glass and natural fibres), glass/flax (GF and FG) composites have higher fibre volume fractions than jute/glass (GJ and JG) composites. Perhaps this is due to the fact that jute fabrics have higher warp and weft yarn gaps than flax fabrics. It can also be seen from Table 1 that flax fabrics have higher yarn density than jute fabrics, resulting in higher composite densities.
Impact test results
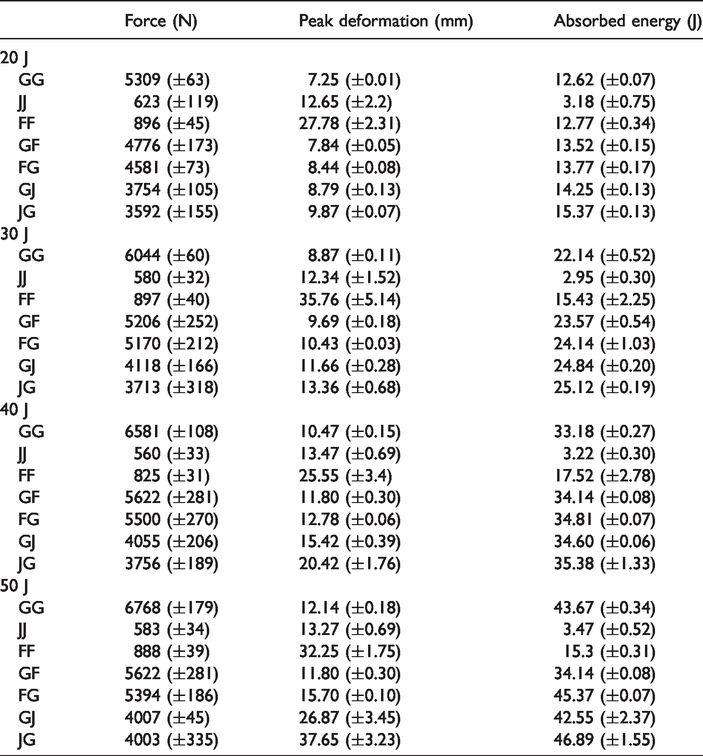
Table 5 and Figures 5 to 7 present drop-weight impact test results of glass, jute, flax and hybrid (glass/jute and glass/flax) fibre reinforced composites at different energy levels (20–50 J). Table 5 and Figure 5 show that glass/epoxy (GG) laminates have the highest impact force than natural and hybrid composites at all impact energy levels which can be attributed to the highest fibre volume fraction of glass composites. Also, the impact resistance of glass fibres is much higher than natural fibres. Comparing natural fibres composite laminates, flax/epoxy (FF) composites have higher impact forces than jute/epoxy (JJ) composites at all energy levels. This can be explained by the fact that flax fibres in the FF laminates have higher volume fractions than jute in JJ composites. Additionally, flax fibres reinforced composites are naturally stronger than jute fibres reinforced composites [34]. Comparing hybrid composites, flax/glass (GF and FG) composites exhibit higher impact forces than jute/glass (GJ and JG) composites at all energy levels. Again, this can be attributed to stronger flax fibres compared to jute fibres. Table 5 indicates the influence of stacking sequence on impact resistance of composites. It is also apparent from Table 5 that stronger glass fibres at the outer face (impacted face) provide higher impact loads than using them at core regions at all energy levels.
Impact properties of composite laminates.

Force–time history of composites at different energy levels (20–50 J).
Figure 6 shows the force-deformation plots of all laminates with two deformation points (peak and permanent) for composite laminates during the impact loading. The peak deformation occurs at the maximum peak force, while the permanent deformation indicates the deformation values after the impactor rebounds or penetrates the samples. It can be noticed that JJ and FF samples have open curves revealing that the impactor has fully penetrated the samples at all energy levels. However, glass and hybrid composites show close force-deformation curves at 20 J and 30 J, indicating that the impactor cannot penetrate those energy levels and rebounds after the impact loading. The penetration starts for JG samples at 40 J as shown in open curve in Figure 6. The impact damage photos of glass and hybrid composite laminates are presented in Figure 8 for all impact energy levels. It can be noticed that the penetration occurs at 40 J impact energy for JG laminates, while GJ samples do not have a clear penetration. Figures 6 and 8 both exhibit that JG and GJ composites have full penetration at 50 J, while GF and FG still have impactor rebounding.

Force–deformation history of composites at different energy levels (20–50 J).
From Table 5, it can be seen that the peak deformation values of GG composites are lower than hybrid composites at all energy levels. This can be explained by the fact that addition of natural fibres reduces the impact resistance of composites, and hence the deflection is greater with higher damage regions as shown in Figure 8. Figure 9 shows that JJ and FF composites have full impactor penetrations at all energy levels, and FF deformation is higher than that of JJ composites. However, JG and GJ composites show higher deformation values than GF and FG composites at all energy levels due to higher damage regions as shown in Figure 8. Comparing the stacking sequence, it is evident that natural fibre layers in the exterior exhibit higher deformation values than placing them in the interior at all energy levels. A possible explanation for this might be that natural fibres fracture or deform earlier than glass fibres enabling the impactor to penetrate deeper into those hybrid composites.
Figure 7 presents the energy–time histories of composite laminates at 20–50 J impact energy levels. The low-impact energy levels produce two energy peak points (I and II) when the impactor rebounds as shown in 20 J impact energy. The peak-I is the absorbed energy due to damage modes such as matrix cracks, delamination, and fibre breakages. Table 5 provides the amount of the absorbed energy for all composites. Peak-II is the excessive energy causing the impactor to rebound. It is clear that GG laminates have both peaks, indicating that full penetration does not occur at all energy levels. However, FF and JJ have only peak-I, and hence the impactor penetrates at all energy levels as shown in Figure 10. Table 5 shows that FF composites absorb more energy than JJ composites at all energy levels. However, under the impact loading, the brittle JJ samples are completely fractured and only a small amount of energy is absorbed. Table 5 and Figure 7 show that hybrid composites absorb more energy than GG laminates at all energy levels due to having higher impact induced areas as shown in Figure 10, since hybrid composites absorb the impact energy with damage modes during the impact loading. Comparing hybrid composites, jute/glass (JG and GJ) composites absorb more energy than flax/glass (FG and GF) composites due to higher impact damage regions as shown in Figure 10. From Table 5, it is clear that using natural fibres at outer regions (JG and FG) enhances energy absorption capacities of composites compared to using them at the core regions (GJ and GF). The possible reason might be that damage propagation mechanics of hybrid composites have changed after changing the stacking sequences of composites. One interesting finding is that jute or flax fibres highly contribute towards the impact damage tolerance of hybrid composites although they have very low impact performances. These results are likely to be related to hybridisation effect of fibre reinforced composites.

Energy–time history of composite laminates.
Figure 8 and 9 show that impact induced areas increase with increasing impact energies. Figure 9 does not present the impact damage areas of JJ and FF composites due to difficulties in measuring the exact damage regions as shown in Figure 10, especially for FF samples. It can be seen that composite samples with outer regions containing natural fibres have higher impact damage areas compared to those composites which have natural fibres in core regions. Those higher damage areas are the result of absorbing more impact energies.

Photos of impacted glass and hybrid composites at different energy levels (20–50 J).

Impact damage areas of glass and hybrid composites at different energy levels (20–50 J).

Photos of impacted natural fibre composites at different energy levels (20–50 J).
Figure 11 presents the cross-sectional SEM images of GF, FG, GJ, JG and GG composite laminates impacted at 30 J. All the composites absorb the impact energy through delamination, matrix cracks and fibre breakages. It can be seen from Figure 11(e) that GG composite sample has lower damaged regions compared to hybrid composites. Also, there are small delaminated regions and matrix cracks with localised glass fibre breakages at the back side of the composites.

SEM images of 30 J impacted composite samples: (a) GF, (b) FG, (c) GJ, (d) JG and (e) GG.
Comparing GF and FG composites, there are more severe damages at FG composite as shown in Figure11(b) due to the presence of weak flax fibre layers in the exterior of the hybrid composites. There are both glass and flax fibre breakages for the FG composites at the back side. However, only glass fibre breakages can be seen for the GF composites as shown in Figure 11(a).
Figure 11 also exhibits that GJ and JG composites have higher impact damage regions compared to GF and FG composites. Similar results can be seen from Figure 8. This is due to flax fibres have higher impact damage resistance than that of jute fibres as shown in Figure 5. Figure 11 also indicates that JG composites have severe damages than GJ composites due to using jute fibre layers in the exterior, resulting in both jute and glass fibre breakages at the back face as shown in Figure 11(d). This result can be supported by having higher damage areas as shown in Figures 8 and 9 for JG composite. Using jute fibre layers in the interior as indicated in Figure 11(c) results in matrix cracks and delaminations rather than fibre breakages while there are extensive damages for the JG composite as illustrated in Figure 11(d).
The results of simulations are presented in Figures 12 and 13 which show the maximum principle stress for all composite laminates at 0.8 millisecond time from impact loading. Different colours in these figures show the level of stresses in the front and back of the composite laminates at an impact energy of 30 J. Generally, the maximum stress occurs at the position directly under the impactor in front of composite plates, and then it gradually spreads towards the back face resulting in bending of the composite structure. Additionally, it can be seen from Figure 12 that there is a wider spread of maximum stress on the jute and flax composites compared to the glass composite due to weaker interfacial bonding between their individual layers.

Maximum principle stress for all composite laminates at 0.8 ms time for GG, JJ and FF samples.

Maximum principle stress for all composite laminates at 0.8 ms time for hybrid samples.
Furthermore, hybrid composite laminates (FG, GJ, and JG composite laminates as shown in Figure 13) illustrate low max stress compared to that natural composite laminates which is due to the placement of glass fabric layers that reduce the damage during impact loading.
Additionally, Figures 14 and 15 compare the experimental and numerical simulation results of glass, flax, jute and hybrid composites impacted at 30 J. It is clear from Figure 14 that for force–time behaviour, there is a close agreement between the experimental and numerical simulations. For instance, JJ and FF composites have very identical impact force values as the force values undulate in similar manners. For GG composites, both numerical and experimental test results give very close maximum force values. Similar results can be seen for the hybrid composites. Figure 14 exhibits that the failure times are higher for the modelling compared to experimental results especially for the hybrid composites. This is due to the fact that composite laminates fractured earlier during experiments, while the simulation is based on the assumption that there is perfect bonding between fibres and matrix. As no surface treatment is done for natural fibres to enhance the interfacial bonding so interfacial bonding between matrix and fibres is poor.

Force–time history of experimental and modelling results for composite laminates impacted at 30 J.
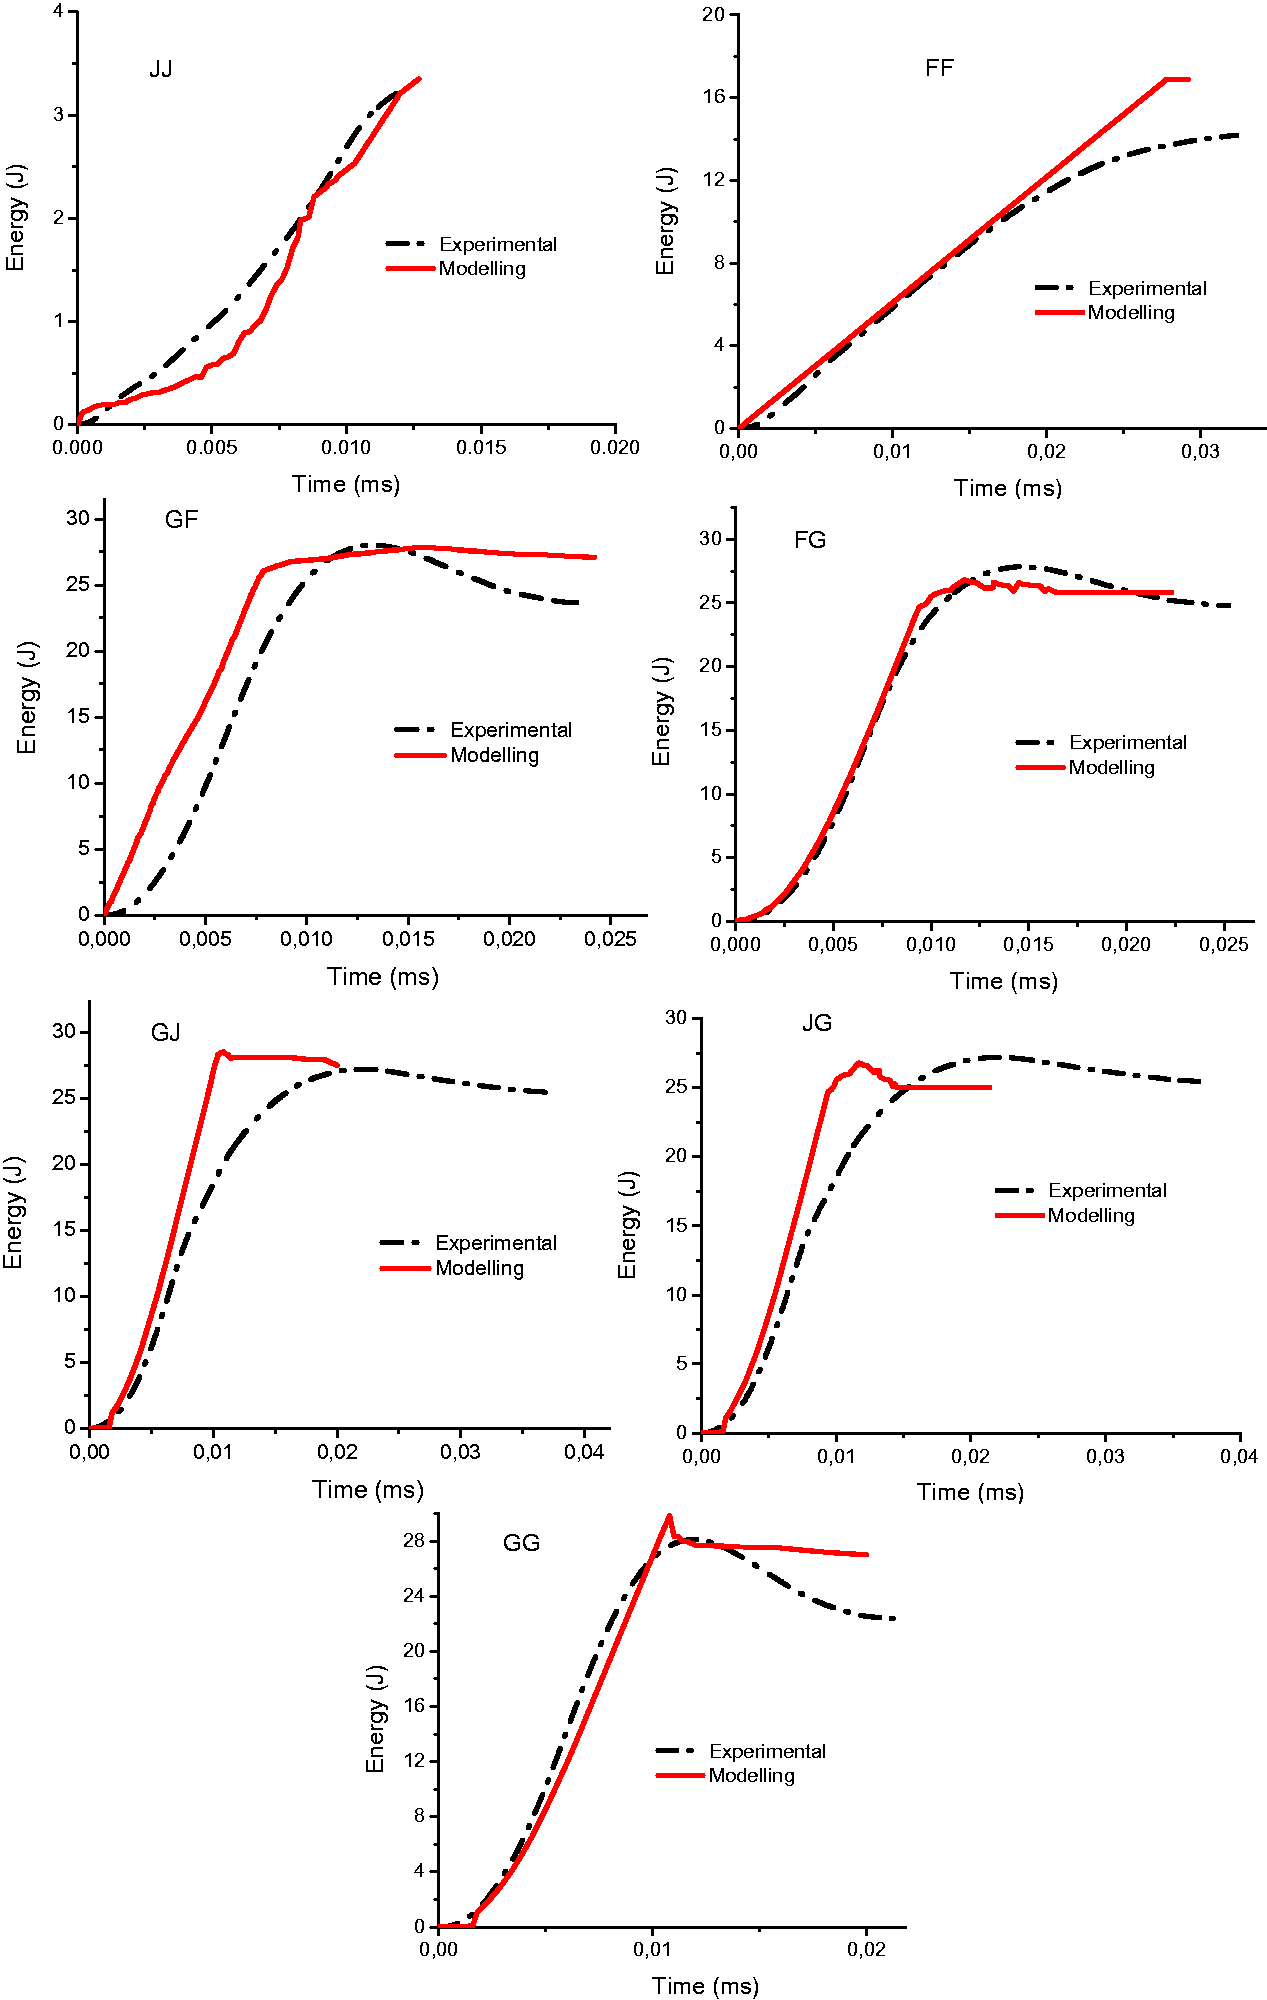
Energy–time history of experimental and modelling results for composite laminates impacted at 30 J.
Figure 15 the shows energy–time histories of experimental and numerical simulations for all composite laminates. It can be seen that FF and JJ composites have very similar energy absorption behaviour with a linear line, indicating that there is full penetration for those samples. For GG and hybrid composites, the modelling results also have two peak points indicating the rebounding of the impactor. Again, there is very good agreement between the experimental and simulation values for energy absorptions.
Compression and compression after impact test results
Table 6 presents the compression and CAI test results of glass, natural and hybrid fabric composite laminates. From the table, it can be clearly seen that the compression strength of GG composite is higher than natural and hybrid composite laminates due to higher tensile strength of glass fibres. Although the hybrid composites have glass fibres, their volume fractions are smaller than the pristine GG composite, since stronger glass fibres carry most of the loads. Comparing natural fibres, jute composites have slightly higher compressive strength than that of flax composites although the fibre volume fraction of flax composite is higher than jute composite as shown in Table 2. This might be due to that jute fibres and epoxy have better interfacial bonding than flax fibres and epoxy, hence they are able to carry higher loads before the failure. Table 6 also indicates that compressive strengths of both glass/flax (GF) and flax/glass (FG) laminates are higher than jute/glass (GJ) and jute/glass (JG) hybrid composites. This can be explained by the fact that flax/glass composites have higher glass fibre volume fractions than that of jute/glass composites as presented in Table 2. It is interesting to mention that stacking sequences strongly influence the compressive strengths of the composites. It is evident that using jute fibres at the outer region (JG) provides about 10% higher compressive strength than using them at the core region (GJ). Similar results can be seen for flax/glass composites, while GF composites have about 20% higher compressive strength compared to FG composites.
Compression and CAI test results for composite laminates.
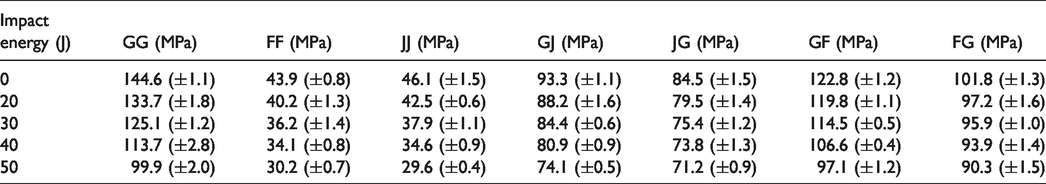
Table 6 also shows that GG composite has highest CAI strength values at all energy levels compared to natural and hybrid composites due to its higher glass fibre volume fraction. CAI strengths of all composites decrease with increasing impact energies. It can be seen that FF and JJ composites have similar CAI strength values. Table 6 also indicates that using glass fibres as extreme layers can provide higher CAI strength values than using them at the core regions for both jute/glass and flax/glass composites. The observed increase in CAI can be attributed to smaller damage areas produced during the impact loadings as shown in Figure 9. Comparing flax/glass and jute/glass hybrid composites, GF and FG composites exhibit higher CAI strength values than that of GJ and JG composites at all energy levels.
Figure 16 presents the compression strength retention (%) which is the ratio of the compression strength of the impacted specimens to non-impacted specimens (

CAI retentions of composite at different energy levels.
Comparing stacking sequences, GJ and JG composites exhibit similar residual strength values for impact energies between 20 and 40 J. However, JG composites have slightly higher retention values at 50 J although JG composites have higher damage areas as indicated in Figure 9. A possible explanation for this might be that the impact loading is first faced by weak jute fibres and the impact energy is mostly absorbed in the initial part. Afterwards, the samples fail due to delamination rather than glass fibre breakages as they are in core regions for JG composite. However, the impact force breaks the glass fibres first due to meeting them at the impact point, and then they reach to core region for GJ composites. Hence, fewer glass fibre breakages occur leading to improved residual properties for JG compared to GJ composite, since most of the compressive loads are carried by the strong glass fibres rather than the weak natural fibres, and fibre breakages significantly reduce the compressive strength of the composite laminates. Similar results can be seen for GF and FG composites where the flax fibres at outer regions provide higher retention values at all energy levels (except 20 J).
Comparing CAI strength of natural fabric composites, JJ and FF composites have similar retention values for impact energies between 20 and 30 J. However, FF composites have higher values for 40–50 J. This is probably due to extensive damage regions for JJ composites at those energy levels as can be seen in Figure 10, and hence they could not retain their strength as much as the FF composites.
As composite samples have different glass fibre volume fractions and density values (see Table 2), the compression and CAI results are presented in Figure 17 after normalisation. Normalisation is done by multiplying the measured compression and CAI strength values by the ratio of common 46.5% fibre volume fraction and 1.81 g/cm3 values to actual composite fibre volume fraction and density as shown in Table 2. Figure 17(a) indicates that GG composites still have highest compression and CAI when all the samples have same density values (except GF for 30, 40 and 50 J). On the other hand, natural fibre composites have the lowest compression and CAI values. It might be expected that the natural fibre or hybrid composites have higher specific compressive strength values compared to glass/epoxy composites. However, jute and flax fabrics do not have any chemical treatments to increase the interfacial bonding between the fibres and epoxy resins. This might have resulted in poor mechanical properties compared to strongly bonded glass/epoxy composites. Figure 17(b) shows the compressive strength of glass and hybrid composites when they all have the same glass fibre volume fractions. It can be seen that hybrid composites have higher specific strength than that of GG composite at all energy levels. It is clear that FG samples have higher specific values than JG sample which is due to their higher glass fibre volume fractions (see Table 2). Similar results can be seen for GJ and GF samples as well.

Results for: (a) Normalised compression and CAI strength to density and (b) Normalised compression and CAI strength to volume fraction.
Conclusions
In the present work, impact and post-impact response of thermoset composite laminates manufactured from glass, flax, jute fabrics and their hybrid combinations (glass/jute and glass/flax) made with various stacking sequences was studied in order to optimize the composite structures for improved impact resistance and damage tolerance.
Hybrid composite laminates consisted from glass and natural fabric layers were manufactured using vacuum-assisted resin infusion method. The low velocity impact and post impact compression response for all composites were characterised by using drop-weight impact and compression after impact tests. The sub-surface damage modes were also investigated using scanning electron microscopy.
Additionally, the proposed simulations for low-velocity impact response of glass and hybrid composite laminates were developed and the experimental and numerical results in terms of time-force and time-energy plots were compared. The following key conclusions can be drawn from the present study: Glass/epoxy composites had higher maximum impact force than jute/epoxy, flax/epoxy and their hybrid forms. Comparing the stacking sequences, hybrid composites manufactured by placing glass fabric layers in the exterior exhibited higher peak force values at all energy levels than hybrid composites in which glass fabric layers were in the interior. This was due to better impact resistance of glass fibres compared to natural fibres. Impact tests results showed that the natural or hybrid composites absorbed more impact energy than glass/epoxy composites due to extensive impact damages. Impact induced areas of glass/epoxy composites were lower than natural or hybrid composites. For stacking sequences, higher damages areas were obtained for hybrid composites in which natural fibre layers were placed in the exterior while composites with glass fibre layers in the exterior mitigated the damage. Glass/epoxy composited had higher compression and CAI strength values than natural and hybrid composites. However, hybrid composites had higher residual compressive strength than glass/epoxy composites. Changing the stacking sequence significantly affected the post-impact performance. Using the natural fibres in the exterior reduced the glass fibre breakages. Hence, higher residual compressive strength values were obtained especially at higher impact energies. Good agreement was observed between numerical and experimental results in terms of time–force and time–energy plots at 30 J impact energy for all composite laminates.
Footnotes
Acknowledgements
The authors acknowledge Prof. Nuray Uçar and Mr. Semih Özkur from Istanbul Technical University for assisting drop-weight impact tests.
Declaration of conflicting interests
The author(s) declared no potential conflicts of interest with respect to the research, authorship, and/or publication of this article.
Funding
The author(s) received no financial support for the research, authorship, and/or publication of this article.