
Abstract
Basis weight distribution of melt-blown fibrous web is attracting considerable interest because it directly affects the application performance of nonwovens. Basis weight distribution is strongly determined by the air velocity distribution on the top surface of the collector. However, how the mentioned air velocity distribution affects basis weight distribution is still unknown. Measurement of the mentioned two distributions is the first step to investigate the influence mechanism. Thus, this work measures air velocity distribution on the collector under different processing conditions. Then the fibrous web is fabricated under same conditions. After fabrication, the basis weight distribution of fibrous web is analyzed by using image analysis method. The effects of processing conditions, including velocity of air jet and suction, die-to-collector distance, and pore size of the collector, on the air velocity distribution and basis weight distribution are quantitatively analyzed. The results demonstrate that higher suction speed and air jet velocity, smaller die-to-collector distance, and larger pores of the collector result in higher air velocity on the top surface of the collector. On the other hand, higher suction speed and air jet velocity, larger die-to-collector distance, and smaller pores of the collector create evenly distributed basis weight. In addition, the correlation between basis weight distribution and air velocity distribution is discussed based on the Spearman correlation analysis method. High correlation demonstrates that air velocity and basis weight display similar distribution on the collector. Namely, both of air velocity and basis weight in the central zone are larger than those in the fringe zone on the collector.
Introduction
In the melt blowing process, the molten polymer is firstly extruded by the die. Then it is drawn and solidified by high speed air jet to form superfine fibers. These fibers are deposited on the grid-like collector to generate fibrous web. The final melt-blown nonwovens are subsequently produced by bonding the fibrous web with two hot rollers. Due to their inherent properties such as large fiber surface area, melt-blown products are suitable in filtration [1], insulation [2], and liquid absorption [3] applications.
It has been reported that there is an important correlation between the above-mentioned applications and basis weight distribution (BWD) of fibrous web [4,5]. For example, the filtration process, a melt-blown nonwoven filter generated by nonuniform (the basis weight is not distributed evenly) fibrous web, may be failure as it allows large particles to pass through the thin spots in the fiber sheet. How to fabricate a uniform fibrous web is a complicated engineering problem, because fibrous web structure is strongly dependent on the comprehensive effect of various processing conditions in melt blowing. Until now, a number of authors have considered the effects of processing conditions involving die-to-collector distance (DCD), temperature, melt throughput rate, and air jet velocity on melt-blown fibrous web structure.
For instance, Chhabra and Shambaugh [6] confirmed that increasing DCD helped to generate fibrous web with thinner fibers. These thinner fibers reduced the basis weight difference between different parts of the fibrous web. Wang and coworkers [7,8] also reported similar conclusion that BWD could be improved with increasing DCD. But, overlong DCD resulted in many smaller and lighter fibers floating in the air, which enlarged the difference of BWD. Temperature had been highlighted as another influence [8], because thinner fibers and evenly distributed fibrous web were observed in the higher temperature air jet. But in the work of Yesil and Bhat [9], temperature only had a slight effect on the fiber and web structure. On the other hand, melt throughput rate could easily change the fiber diameter and BWD [4,8]. However, in terms of air jet velocity, there existed a complex mechanism relating air jet velocity and BWD [4,7,8]. Because higher velocity air jet produced thinner fibers and accompanying basis weigh uniformly distributed fibrous web [4], many lighter fibers were easily blown out of the collector by higher velocity air jet [10]. For investigating the complex mechanism, the air jet had been measured many times [11–13]. In recent years, it also had been further simulated by computational fluid dynamics (CFD) method [14–17]. These researches revealed the air jet velocity, temperature attenuation rule, and fiber motion law. Their reported conclusions explained the aforementioned complex mechanism between air jet and BWD to a certain extent, but ignored the influence of air velocity distribution (AVD) over the collector. In the melt blowing experiment, air jet blew the fibers onto the collector. Then both of air jet and fibers spread over the surface of the collector. The suction under the collector absorbed the supererogatory air. The formed fibrous web was affected by AVD which was composed of air jet and suction on the collector. Although AVD could not directly affect the fiber diameter, it was the primary cause relating to the structure of fibrous web. But, how AVD affects BWD is still unknown. Measurement of the mentioned two distributions is the first step to investigate the influence mechanism.
Therefore, in this article, experimental approach is firstly adopted to allow a deeper insight into the influence of the factors on the AVD, such as DCD, air jet velocity, suction speed, and pore size of the collector. Then, BWD of fibrous web formed by corresponding AVD is analyzed through image processing method. Finally, correlation analysis is applied for studying the correlation between AVD and BWD. The current work provides explanation to fibrous web formation mechanism from the perspective of air velocity on the collector.
Experiment and correlation analysis
Fabrication of melt-blown fibrous web
The employed polypropylene (melt index = 1500, Mw=3 × 10⁵, melting point = 168.8°C) was purchased from Huada Co., Ltd., China. The melt blowing (MB) experiments (Huada Co., Ltd., China) were carried out in a setup with only one orifice and dual slot jets. The die capillary had an inside diameter of 0.42 mm and a length of 10 mm. Each of the slots in the die was 0.65 mm wide and 6 mm long. For investigating the influence of pore size of the collector on AVD and BWD, we designed four kinds of collectors with 0.1 mm, 0.22 mm, 0.42 mm, and 1.14 mm pores. The collectors were made by aluminum alloy and covered by Teflon. The employed melt blowing instrument and collector are displayed in Figure 1.
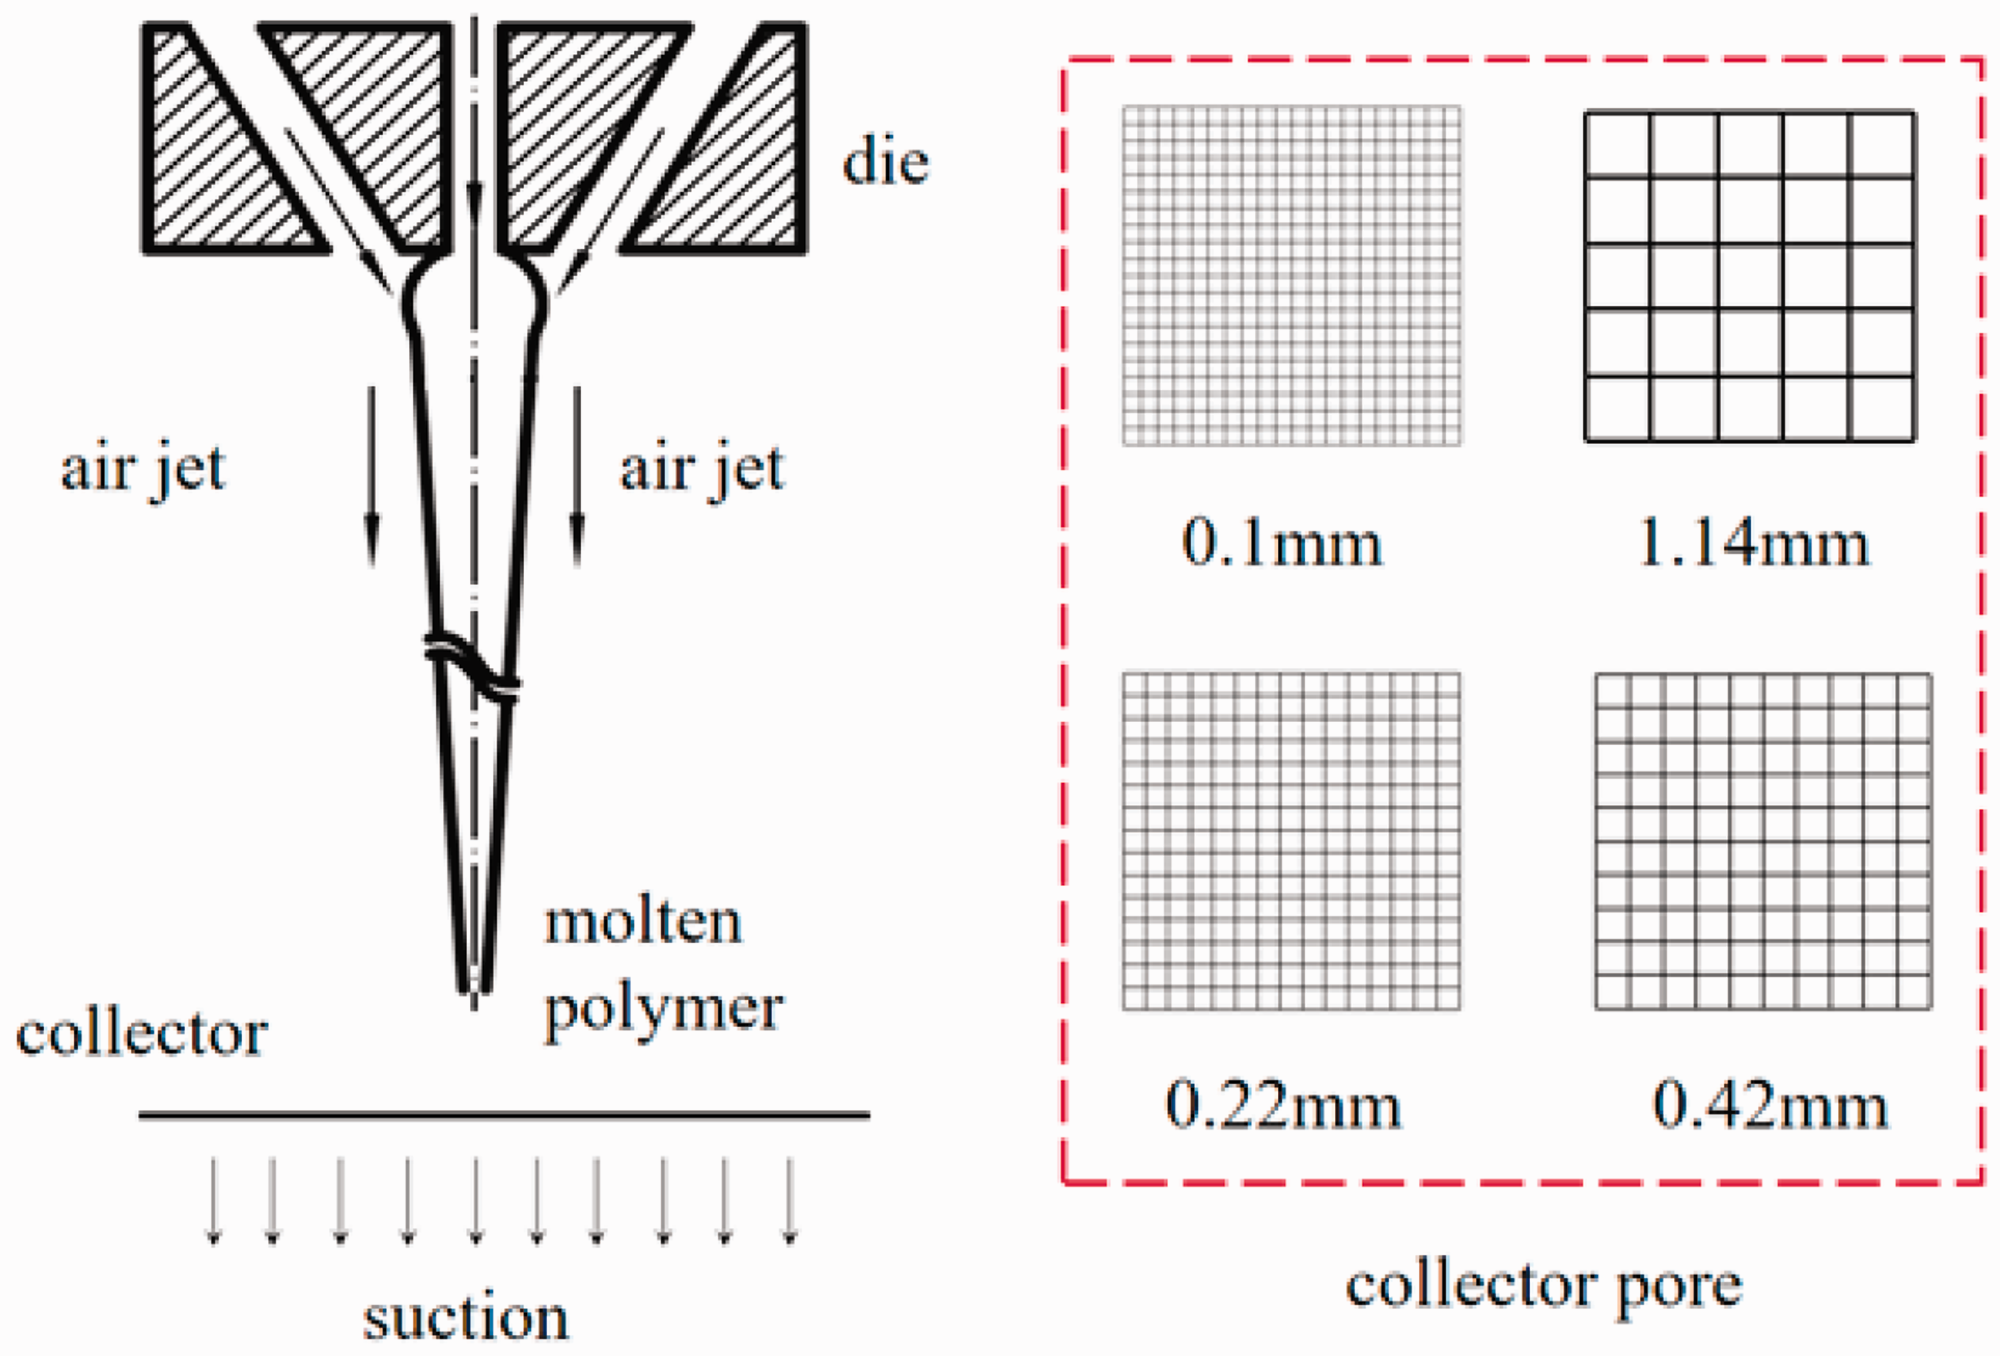
Schematic diagram of melt blowing instrument and collector.
To study how AVD affected BWD, the processing conditions those could change AVD were adjusted in this work. These included air jet velocity with the range of 250–400 m/s, suction speed with the range of 0–30 m/s, and DCD in the range of 5–20 cm. The default air jet velocity was 300 m/s, default suction speed was 0, default DCD was 10 cm, and default pore size was 1.14 mm. Only one processing condition was changed while default values were set for other processing conditions in an experiment. The polymer temperature was 260°C, and the melt throughput rate was 6.5 cm3/min. In order to avoid the effect of the collector’s movement, the collector was set stationary during fabrication. The collecting time is 30 s. Four copies were collected by applying each processing condition in order to remove errors.
Image analysis of fibrous web
Image analysis had served to BWD measurement in many published works. For example, Chhabra [5] proposed two parameters called the standardized index of dispersion and the mass anisotropy ratio to study the BWD of fibrous webs using image analysis method based on reflected/transmitted light of fibrous webs. Liu et al. [18,19] presented two new algorithms called learning vector quantization and the fuzzy neural network which were also employed during analyzing the images of nonwoven.
One of the principles of their articles was that the basis weight was in inverse proportion to the intensity of light which is transmitted through the fibrous web. Thus, in the transmission images, larger gray level represented smaller basis weight value. On the basis of this principle, we presented a method to capture the transmission images of fibrous web in our previous work [10]. The collected fibrous web was respectively moved onto a transparent glass screen which was located at the bottom of a dark box. The setup included a 20 W lamp above the dark box and a digital camera under the glass screen (Figure 2(a)), through which upward view photographs of the fibrous web were obtained (Figure 2(b)). Prior to BWD analysis, gray level value of image was subtracted from 255. Several squares (more squares could generate more accurate result but complicated calculation) were then used to divide the image (Figure 3(a)). Finally, the gray level value of each square could be regarded as basis weight of each square. Therefore, the gray level distribution (GLD) of the fibrous web could be regarded as corresponding BWD.

Image capture: (a) sketch of the photographing experiment and (b) an upward view photograph of the fibrous web.

Image division methods: (a) divided by squares and (b) divided by circles.
The method was rooted in the ISO Standard 536:2012 which specified a method for determining the grammage of paper and board. However, we found that the previous method was not suitable for dividing the circular sample. Once squares were applied for dividing the sample, redundant four parts (correlated here are the red elliptical area in Figure 3(a)) were generated. The divided fibrous web could not cover every part of the entire web. Thus, in this work, as shown in Figure 3(b), the fibrous web was equally divided into several annulus pieces with constant area. The average gray level value of each circular piece was recorded to represent BWD. After capturing image, each fibrous web was cut into the same amount of annulus pieces. To verify the image analysis results in current study, these pieces were weighed on an electronic balance. The obtained gray level should be normalized by dividing the gray level of a piece by total gray level of the entire fibrous web. The obtained GLD are presented in “The influence of processing conditions on GLD” section. The original data of weigh are uploaded as supporting information.
Measurement of AVD
To assess how AVD affects GLD, we measured the air velocity on the collector corresponding to the location of each fibrous annulus piece. The measuring positions were evenly distributed on the location of each fibrous annulus piece and in four directions (up, down, left, and right). The total measuring positions distributed on the collector is shown in Figure 4. The enlarged view of the part in the red window is shown on the upper right in the figure. Central point is the projection on the collector of the orifice in the die. Air velocity value of each annulus is the average value of air velocity at corresponding four positions in the annulus. The air velocity was measured by employing hot-wire anemometer (Model 55P11, Dantec Dynamics Inc., Denmark) installed tungsten wire (1.2 mm length, 5 µm diameter) with 0.01 m/s precision. The hot-wire anemometer was fixed on the removable holder. The tungsten wire was moved a certain distance along a direction after each measurement. Then, the velocity values were recorded after the tungsten wire was stable. For comparing with BWD, consistent processing conditions were employed. The obtained air velocity value also should be normalized by dividing the velocity on a piece by total velocity on the entire domain. The measured velocity is given in “The influence of processing conditions on AVD” section. The original data were provided in supporting information.
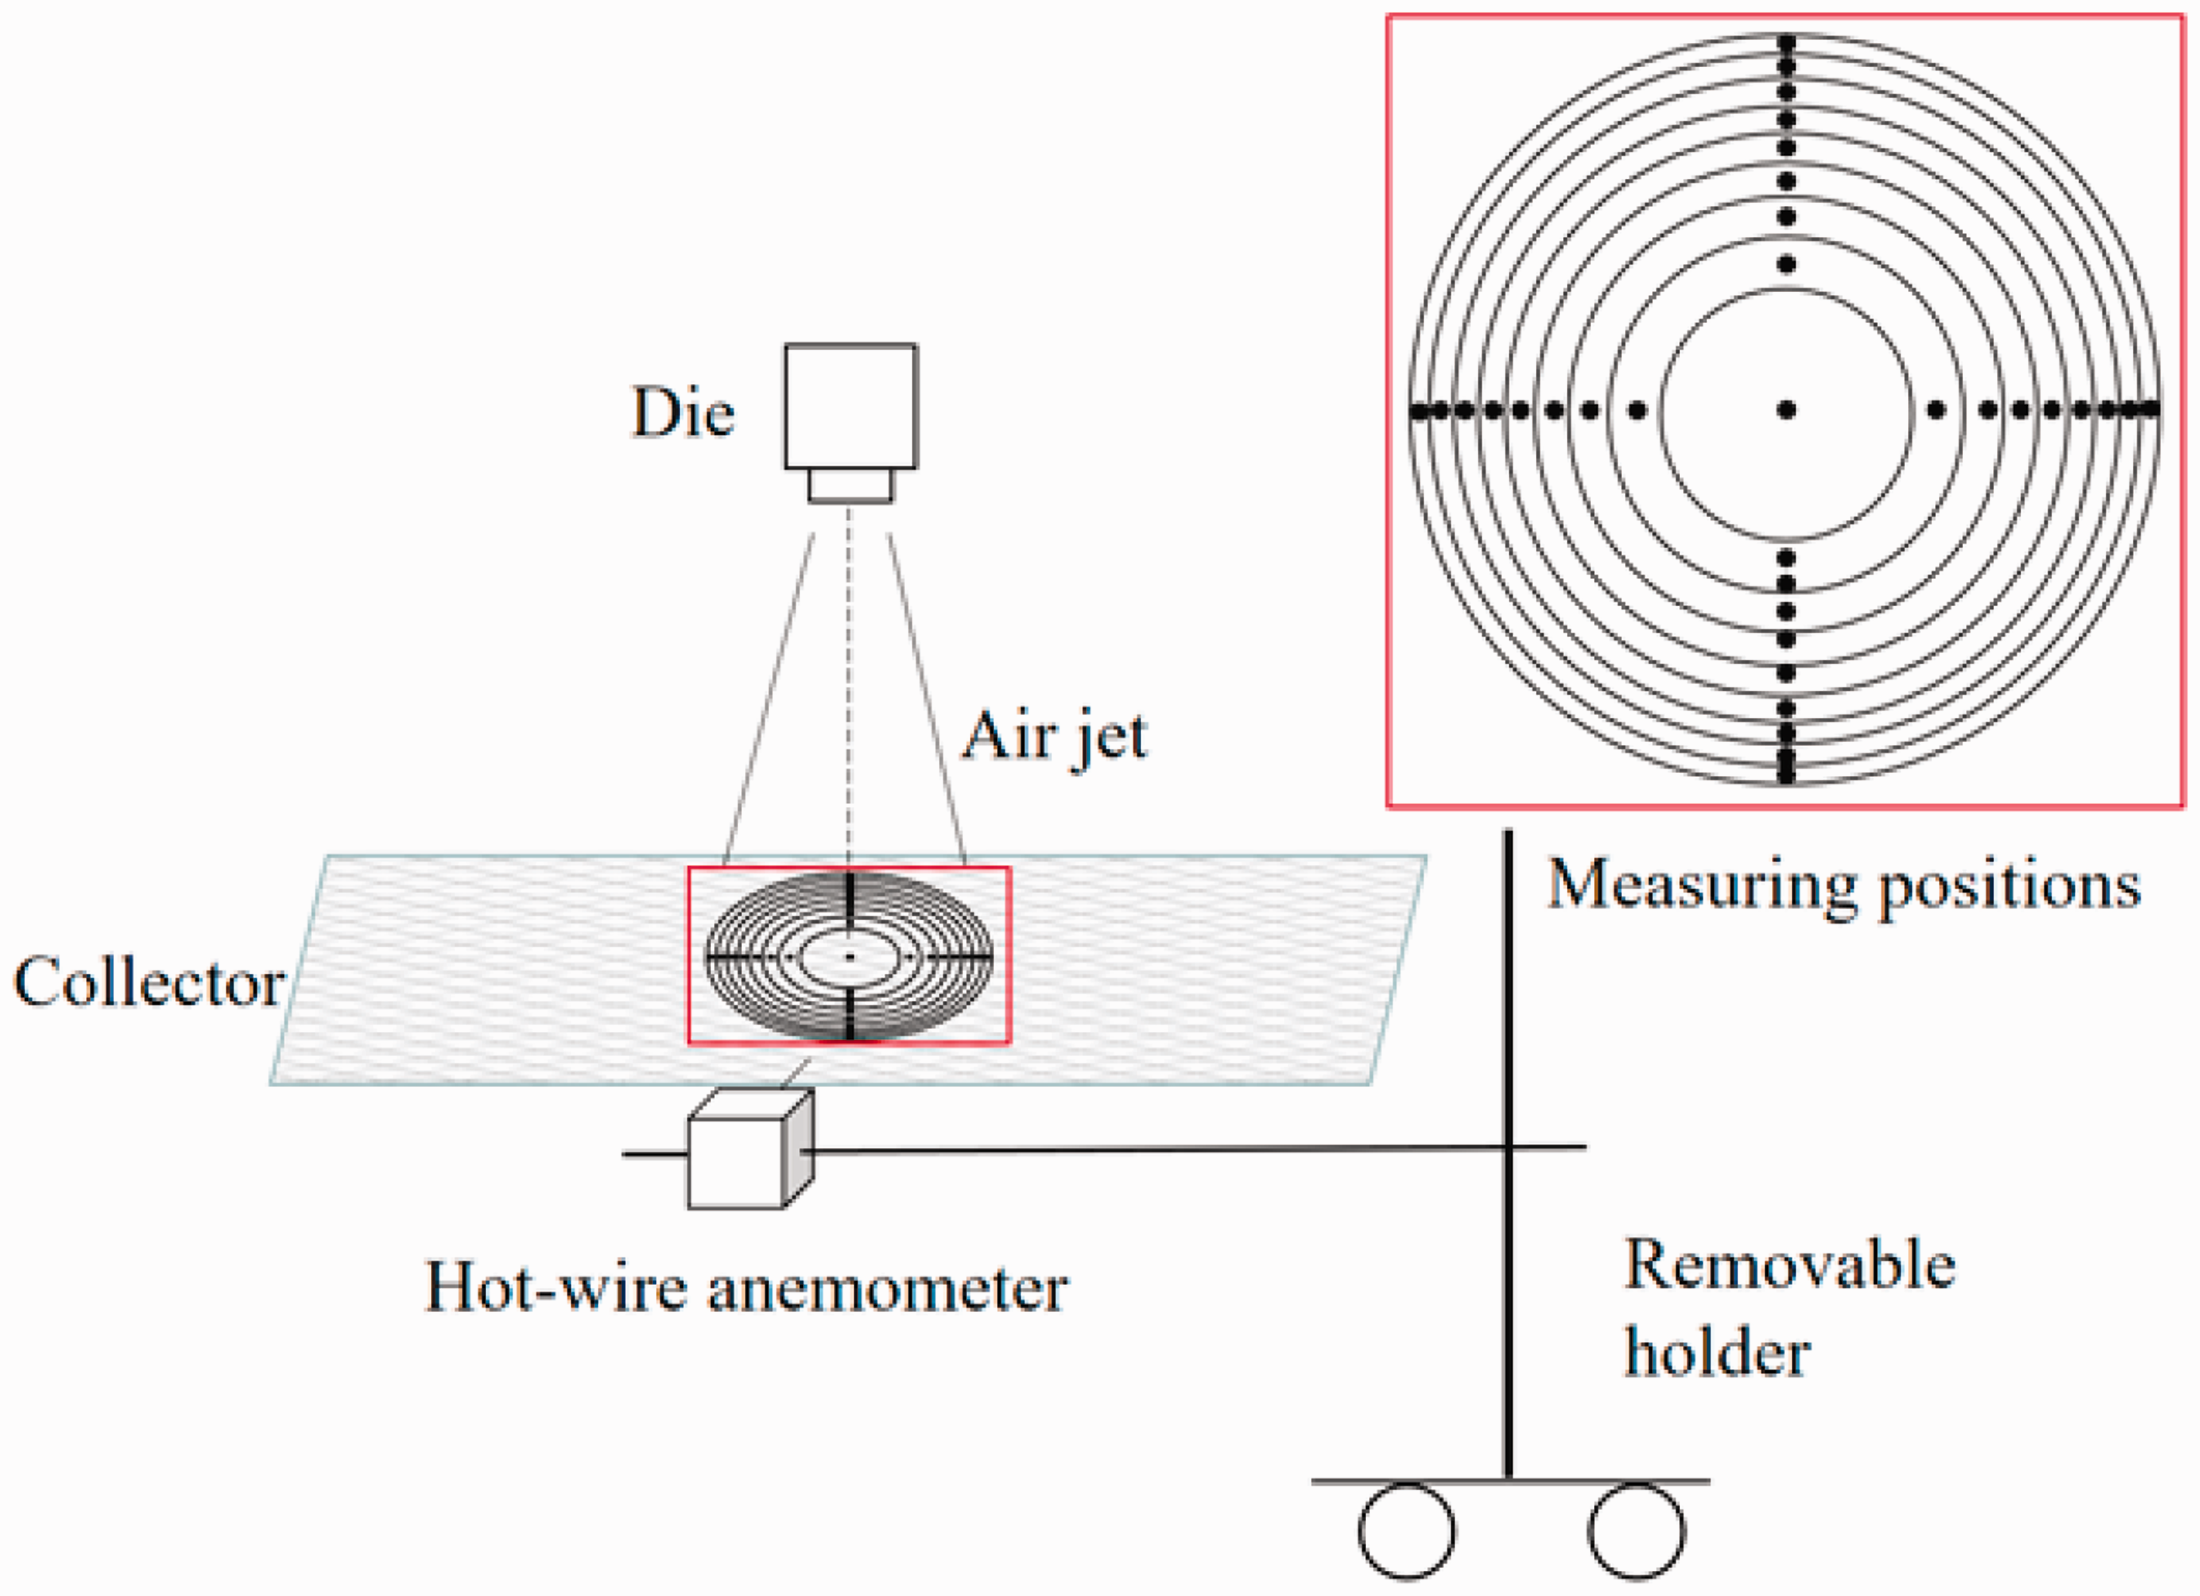
AVD measurement on the collector.
Correlation analysis
Spearman’s rank correlation analysis method is suited for monotonic relationships (whether linear or not). In terms of normalized AVD and GLD, the correlation coefficient ρ is expressed by

Results and discussion
The influence of processing conditions on AVD
The AVD over the top surface of the collector was measured by employing same processing conditions described in “Fabrication of melt-blown fibrous web” section. The experimental results are displayed in Figure 5. The air jet velocity of central zone (the area that is directly blown by the air jet) is higher than that of fringe zone (the area that is affected by the diffused air jet) on the collector. Therefore, in Figure 5(a) to (d), the air velocity is decreased when measuring position to center distance (MPCD) is increased. Furthermore, there is a major decline of air velocity at MPCD < 0.04 m, but a minor reduction at the range of MPCD > 0.04 m. It can be seen from the data in Figure 5 that the processing conditions including higher suction speed and air jet velocity as well as smaller DCD result in higher velocity air flow on the top surface of the collector.

Measured AVD: (a) the influence of suction speed on the air velocity, (b) the effect of air jet on the air velocity, (c) the impact of DCD on the air velocity, and (d) the impression of pore size on the air velocity. MPCD: measuring position to center distance.
The influence of processing conditions on GLD
According to the discussion in “The influence of processing conditions on AVD” section, processing conditions of melt blowing directly affect the AVD on the top surface of the collector. And the latter make a difference to fibrous web structure and BWD. Gray level value is used to describe basis weight. Thus, we examine the effect of processing conditions on GLD. The processing conditions are mentioned in “Fabrication of melt-blown fibrous web” section. Figure 6 displays the measured GLD of fibrous web.

Measured GLD: (a) the influence of suction speed on GLD, (b) the effect of air jet velocity on GLD, (c) the impact of DCD on GLD, and (d) the impression of pore size on GLD. MPCD: measuring position to center distance.
In Figure 6, the gray level is declined when MPCD is increased, which means fibrous web loses its own weight at fringe zone. This result is similar to AVD and can be explained by the fact that fibers frequently drop in the central zone but rarely fall in the fringe zone on the collector. The processing conditions involving higher suction speed and air jet velocity, larger DCD, smaller pores of the collector evenly distribute basis weight (correlated here means the weight gap between central zone and fringe zone narrows) of fibrous web.
In Figure 6(a), larger suction speed can slightly enhance the uniformity of fibrous web. From our observation, a reasonable explanation is higher suction speed enhanced the air velocity on the top surface of the collector. Thus, fibers are easily adhered to the collector. This helps the collector gathering the “flies” (the uncontrolled short fibers) as much as possible. In Figure 6(b), higher speed air jet generates lighter central part but slightly heavier fringe part of fibrous web. According to our observation, most of the fibers lay-down positions are around central zone on the collector. Intense air jet can blow these fibers from central zone to fringe zone. Therefore, stronger air jet can balance the weight gap between central zone and fringe zone. Same tendency is displayed in Figure 6(c), as DCD is increased, central zone of fibrous web becomes lighter but fringe zone gets heavier. Due to fiber entanglement, fibers are hardly spread on the collector when collector is close to the die. When the collector is away from the die, fibrous web tends to cover a larger area on the collector. Thus, fibers declined in the central zone. Gray level is evenly distributed over the entire web. In addition, larger pores of the collector easily evacuate redundant air jet and enlarge the air flow velocity on the top surface of the collector, and fibers are gathered, especially in the central zone. Hence, in Figure 6(d), the gray level value in the central zone is gradually increased when larger pore size is applied.
The correlation between GLD and AVD
The current study finds some correlations between GLD and AVD. The gray level value and velocity are normalized prior to the coefficient of correlation is calculated. The calculation is performed by using MATLAB software. Spearman correlation analysis method is employed by inputting program “corr(x,y,'type','Spearman');”. Correlogram and coefficient are given in Figure 7. High correlation coefficient demonstrates that there is a high correlation between GLD and AVD under all mentioned processing conditions. This coincides with our observation and measured results. Namely, in the melt blowing, it usually generates a heavier fibrous part and higher air velocity in central zone on the collector, but a gradually lighter fibrous part and lower air velocity in the fringe zone.

Correlation between AVD and GLD affected by different processing conditions: (a) suction speed, (b) air jet velocity, (c) DCD, and (d) pore size.
Conclusion
BWD of melt-blown fibrous web directly determines application performance of final products. Fibrous web is strongly affected by the air velocity on the top surface of the collector. For studying the mechanism of BWD, we measure AVD and BWD at corresponding positions on the collector. And then the correlation between both of the two distributions is analyzed. The calculated correlation coefficients demonstrate that there is a high correlation between the two distributions. Overall, these results also indicate that the air velocity and basis weight of central zone are larger than those of fringe zone. Processing conditions provide direct influence on the two distributions. Higher suction speed and air jet velocity, smaller DCD, and larger pores of the collector result in higher velocity air flow on the top surface of the collector. On the other hand, higher suction speed and air jet velocity, larger DCD, and smaller pores of the collector create evenly distributed basis weight. The whole work reveals the regularities of BWD and AVD on the top surface of the collector. Same investigation method will be developed to multiple orifices die. We hope our study could guide the fabrication of melt-blown nonwovens with desirable BWD.
Footnotes
Declaration of conflicting interests
The author(s) declared no potential conflicts of interest with respect to the research, authorship and/or publication of this article.
Funding
The author(s) disclosed receipt of the following financial support for the research, authorship, and/or publication of this article: This study is supported by the National Natural Science Foundation of China (Grant No. 51703124 and 51776034), a Program for Professor of Special Appointment (Eastern Scholar) at Shanghai Institutions of Higher Learning, a Talent Program of Shanghai University of Engineering Science, and an Early Development Program of Shanghai University of Engineering and Science (Project 2018-31).