
Abstract
Thermal shrinkage of flame-retardant fabrics under high temperature exposure would result in the change of air layer under clothing, which can affect the thermal protective performance of clothing. This paper introduces a new image-based device to characterize the thermal shrinkage of the fabrics. The device was aimed to reconstruct the three-dimensional (3D) surface morphology of fabrics based on grayscale images. The imaging collecting system was designed to obtain the grayscale images of thermal-shrinkage fabrics. Then, MATLAB programming of the 3D reconstruction algorithm based on photometric stereo was developed. A comparison of the results of the 3D reconstruction method with the 3D scanning method showed that the 3D reconstruction method was practical and repeatable. The research provides a simple and effective method to characterize the 3D morphology of thermal-shrinkage fabrics, which will help in the quantification of thermal shrinkage of fabrics and the prediction of the thermal protective performance of clothing.
Keywords
Introduction
Many industrial workers, such as firefighters, soldiers and workers in petrochemical industry [1], are likely to be exposed to extreme heat caused by flash fire, which can result in injuries or even death. Thermal protective clothing is the key equipment to minimize the risks from injuries or death [2]. The research shows that the thermal protective performance provided by the clothing comes from the flame-retardant materials used in these fabrics as well as the air gap between clothing and human body. However, most of the flame-retardant fabrics currently in use will shrink when exposed to flash fire [3]. It has been proved that clothing made of meta-aramid shrank severely when the fabric temperature reached 400°C in 4 s flash fire exposure [4]. Researches showed that thermal shrinkage will affect not only the mechanical and thermal properties of the fabric but also the shape and dimension of the clothing. Consequently, it will dramatically decrease the air gap size between the clothing and the human body, leading to an increasing heat transfer of the clothing system and possibly resulting in much severer skin burn [1, 5–7].
Previous studies have focused on the effect of thermal shrinkage on the thermal protective performance of clothing by either bench-scale or full-scale. A cylindrical bench-scale device was developed by Crown, which could capture the situation of thermal shrinkage [8]. Song [6] focused on the skin burn degrees for the manikin parts with different thermal shrinkage and found that clothing shrinkage could reduce the air gap and result in the loss of the thermal protective performance of clothing. Ghazy [9] numerically investigated the effect of the fabric thermal shrinkage on the protective performance of clothing. In his study, the effect of thermal shrinkage was studied by modeling the heat transfer through the air gap between the clothing and the skin, with the view that the air gap responds directly to the clothing thermal shrinkage. However, it was still necessary to validate the relationship between air gap and fabric thermal shrinkage. Both experimental study and numerical simulation showed that fabric thermal shrinkage can seriously affect the thermal protective performance of clothing. Therefore, it becomes necessary to measure and characterize the thermal shrinkage so as to quantify the effect of the thermal protection caused by the fabric thermal shrinkage.
However, it is difficult to measure and characterize the fabric thermal shrinkage due to its irregularity and randomness, limiting the quantitative research on the influence of thermal shrinkage on the thermal protective performance. In literature [8, 10, 11], the problem of the influence of the thermal shrinkage on thermal protection was only mentioned or qualitatively studied. With the application of noncontact 3D scanning techniques, the hand-held 3D scanner have been used to obtain fabric surface morphology data, and with the combination of image processing software, optimization of scan data and extract of morphological characteristics of the fabric are studied [12]. However, the laser scanner is expensive and requires fabric specimen or the scanning sensors be moved constantly so that the surface could be scanned completely. Wang et al. [13] developed a method to quantify the thermal shrinkage of fire protective clothing by a portable 3D body scanner. However, for the 3D body scanner, the scanning location is limited and the requirement of professional skills for the operator is much higher.
Evaluation of the fabric appearance such as fabric surface wrinkle, roughness, and pilling are traditionally rated by artificial visual assessment in accordance with reference standards [14, 15]. Currently, digital image analysis method provides an effective evaluation of the fabric appearance [16]. Considering that the 3D surface morphology with depth information is essential for accurate evaluation; some researchers [17–20] have developed 3D surface reconstruction method based on the stereo vision to analyze the wrinkle, roughness, and pilling of fabric under natural conditions. Yang et al. [17] proposed a photometric stereo method to reconstruct the 3D surface of wrinkled fabric based on successive images captured by a single camera under several known illumination directions. In addition, based the stereo vision method, other researchers [18–20] introduced the 3D surface reconstruction of fabric by using two digital cameras. Compared with the former method with a single camera, the latter method with two cameras is more work-intensive, which adds the step of stereo images matching. These studies indicate that the photometric stereo has a good applicability in evaluation of the fabric appearance compared with the traditional visual rating method.
The aim of this study was to provide an inexpensive, time-effective, and simple method to obtain the 3D surface morphology of thermal shrunk fabrics. In this paper, the photometric stereo was used for the 3D surface reconstruction of flame-resistant fabrics after flash fire exposure. An image acquisition device for the capture of two-dimensional images of shrunk fabric was designed. Based on the stereo vision, the calculation principle of 3D surface reconstruction from the two-dimensional images of the fabric was described in detail. Then, the experimental verification of the 3D reconstruction algorithm was conducted by means of MATLAB software. Most of the previous literature on the reconstruction studies focus on the evaluation of the fabric appearance and verify by comparing with the subjective visual ratings. We introduced 3D scanning images as the comparison basis, which we consider more objective and much closer to actual image. A hand-held scanner was employed to get the surface morphology of fabrics as a reference.
Instrument design and calculation principles
Description of the testing system
In this study, a photometric stereo [17] was employed for reconstructing the 3D surface of fabrics. The basic principle of this photometric stereo algorithm for the 3D reconstruction is based on the theory of reflection map. An image sequence of the fabric is obtained by using multiple light directions, and the normal vector of the fabric surface is calculated with the obtained images; then the surface shape of the fabric is reconstructed based on the normal vector of the fabric surface. The experimental device was designed as shown in Figure 1.

Schematic diagram of the designed experimental device.
The experimental device is mainly composed of four parts: a specimen-placed panel, an illuminate system, a digital camera (NIKON-D7000, with the lens of AF-S NIKKOR 17-55mm 1:2.8 G ED), and a computer. The specimen-placed panel is designed for holding the fabric samples, on which there is a rectangle for the calibration of image pixel. The illumination system comprised eight light sources, which are uniformly distributed on a circle, namely, the distance between the adjacent two light sources is 45° of the central angle. Each light source is independently controlled by the light switch to turn on in the order from light source 1 to 8. And one image of the fabric sample is captured by the digital camera when each light source is turned on. The distance between the digital camera and the illumination system can be adjusted by moving the camera and by also keeping focus of the camera and center of the illumination system in line. The images of fabric samples taken from the camera are input into the computer. The pre-processing and the 3D reconstruction algorithm for the images are conducted in the computer. And eventually, the reconstructed surface morphology of the fabric samples is displayed on the computer.
Calculation principles of the 3D reconstruction
The key process of the 3D reconstruction of photometric stereo method is shown in Figure 2. First, multiple illuminated images in the specific direction of the light are captured. According to the luminance formula of the object surface in the gray image, relationship between the luminance of object surface and its surface normal can be established, and the normal vector field of the object surface is obtained by solving the relational expression. Finally, according to the theory of tangent plane, the relationship between the normal on the object surface and its tangent plane is set up, in which the surface normal is a known quantity while the surface height is an unknown one.

Flow chart of the 3D reconstruction.
Determination of illuminator vector matrix
In this paper, the geometric distribution of the illumination system is shown as Figure 3 [21]. X-Y-Z is the world coordinate, while x-y-z(Z) is the camera coordinate. The fabric surface is irradiated by the light source, and the light is reflected back into the camera.

Geometric distribution of the illumination system.
According to the geometrical position relation of each light source in Figure 3, the unit vector of the light source direction S can be expressed as follows [21]

Solution of normal vector field of fabrics surface
While exposed to light, the surface of an object reflects the light. According to the surface properties of various objects, the reflected light on them can be divided into scattered light or body reflected light and specular reflected one. For the objects with rough surface (many nonmetallic surfaces), the reflection on the object surface is only caused by the scattered light, which follows the Lambert’s reflectance model [22]. Then, the brightness at one point of the fabric surface is only linearly associated with its reflection coefficient and surface normal, which can be expressed as follows [23, 24]

Calculation of surface pixel height
When the normal vector of the fabric surface N is determined, the relationship between the surface point and the normal vector can be used to solve the height of the surface point. Since the normal vector of an object surface is perpendicular to its tangent plane, the normal vector of every point on the surface is perpendicular to its tangential vector, i.e., their dot product is zero.
As shown in Figure 4, with the assumption that P1(x, y, z
x,y
) is any point of the fabric surface, its horizontal tangential direction vectors (positive: V1, negative V3) can be expressed using its adjacent point

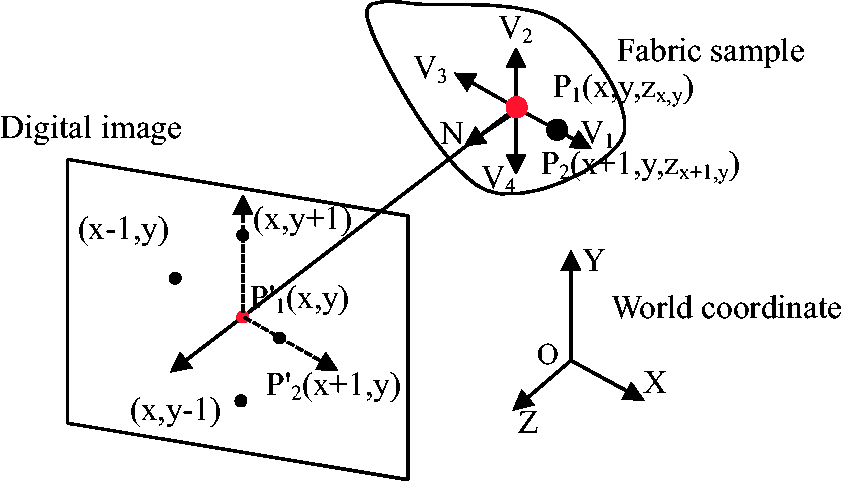
Solution diagram of the surface pixel height of fabric.
As the normal vector (N) is perpendicular to the tangential vector, their dot product is zero, which can be expressed as follows


So similarly, the vertical tangential direction vectors (positive: V2, negative: V4) can be expressed as follows

Therefore, there are two constraint equations for any point on the fabric surface as follows

In this study, the image resolution was set as 128 by 128 pixels. There are two constraint equations for every pixel. Considering the boundary conditions and the location where the surface normal vector is not reasonable, the digital image matrix can be split as shown in Figure 5.

Zone plan for solving height in digital image.
For part A, the value range for the pixel point (x,y) is 1 ≤ x ≤ 127, 1 ≤ y ≤ 127. And for every point, its constraint equations are as follows

For part B, the value range for the pixel point (x,y) is 1 ≤ x ≤ 127, y = 128. And for every point, its constraint equations are as follows

For part C, the value range for the pixel point (x,y) is x = 128, 1 ≤ y ≤ 127. And for every point, its constraint equations are as follows

For part D, the value range for the pixel point (x,y) is x = 128, y = 128. And for every point, its constraint equations are as follows

In summary, for an m × n matrix of image, we can obtain a (2×m × n) ×(m × n) sparse matrix


By solving the above equation, the height matrix of fabric surface can be obtained.
Calibration for pixel height
As the height result obtained above is in pixels, it is necessary to convert the pixel size to actual size. In actual operation, if the actual length is recorded as L1 mm, and the size in image pixels is L2 pixels, the calibration coefficient should be L1/L2 mm/pixel.
Experimental verify
Materials
Ten fabrics typically used as outer shell of the firefighters’ protective clothing were selected, as shown in Table 1. Different fibers, weave structures, weights, and colors have been considered.
Basic physical parameters of experimental fabrics.

The 10 fabric samples were exposed to fire on a TPP tester (CSI-206, Custom Scientific Instrument Corporation, USA). The TPP tester consists of two Meker burners and nine heated quartz tubes which can produce a heat flux of 84 kW/m2 mixed with 50% convective and 50% radiant heat. An automatic water-cooled shutter was equipped to insulate the fabric specimen from heat exposure and to ensure accurate time of exposure. In this study, the exposure time was set to 3 s and 4 s, in accordance with the flame manikin test standards ISO 13506 [25] and ASTM 1930 [26], respectively. In standard test for the thermal protective performance of fabrics, a copper calorimeter is used, which restricts the fabric by applied pressure. In current study, fabrics without pressure are needed in order to get the realistic shrinkage fabrics. By burning test, the thermal shrunk fabric samples were obtained.
Methods
Image acquisition and processing
The burned fabrics are placed on the specimen-placed panel in the built experimental device (Figure 1) and ensure that the experimental box is dark. The eight light sources in the illumination system were turned on in sequence and an illuminated image was capture by the digital camera when each light source is on. Then, every fabric sample has eight color images. Considering the computational cost and running time of the subsequent 3D reconstruction, the color images were compressed to 128 pixels × 128 pixels. And the images were cut into squares and removed the image background using the Adobe Photoshop software. Then, the illuminated images were imported into the MATLAB to run the 3D reconstruction algorithm.
3D scanning
In order to validate the result of the 3D reconstruction, a hand-held laser scanner (Handyscan 3D, Creaform, Canada) was used to capture the surface morphology of the thermal shrunk fabrics. As many noise points existed in the scanned fabric morphology, the Geomagic Studio (Raindrop, US) software was employed to deal with the noise points.
Results and discussion
Shape of the 3D reconstruction
Five typical fabrics are displayed in Table 2. From the gray images and the 3D reconstructed Images, it can be seen that the reconstructed shape of the shrunk fabric is virtually the same as the one in the gray image. The designed testing system can be used to reconstruct the surface morphology of shrunk fabric. Moreover, compared to the 3D scanning image, the 3D reconstructed image is more intuitive by using different colors to represent different height values.
Gray image, 3D reconstructed image, and 3D scanning image of shrunk fabrics.

Reproducibility and reliability of the method
In order to prove the repeatability and reliability of the 3D reconstruction method, mean and standard deviations (SD) of the reconstructed height of fabric surface are shown in Table 3 as well as the scanned height. It was shown that the SD of the reconstructed height was in the range of 0.10 to 1.12 mm, depending on the fabric sample and exposure time, while the SD of the scanned height was from 0.14 to 2.95 mm. The coefficient of variation (CV) of height was obtained dividing SD by means.
Comparison of reconstructed and scanned height of fabrics.
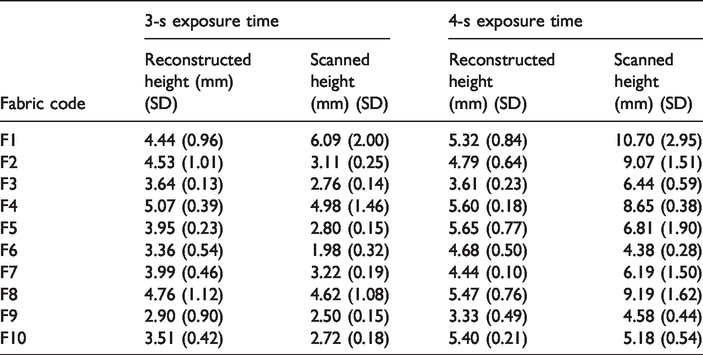
A comparison of the CV of the height obtained from the reconstruction method and the scanning method is shown in Figure 6. The CV value of two exposure time increased from 2.21% to 30.9% for the 3D reconstruction method. And it is from 4.41% to 32.8% for the 3D scanning method. It can be concluded that the repeatability of the 3D reconstruction method is acceptable. The reliability analysis was also conducted to validate the precision of the 3D reconstruction method. The intra-class correlation coefficient in the 3D reconstruction method was 0.813. It could be concluded that the reconstructed height had a good reliability, and the newly designed experimental device could obtain the surface morphology of the shrunk fabrics.

Comparison of CV between the reconstructed height and the scanned height: (a) 3-s exposure; (b) 4-s exposure.
Summary of the 3D reconstruction method
Based on the experimental process, the steps to reconstruct the surface of shrunk fabrics were summarized in Figure 7. The steps were analyzed from three parts. The first part is image acquisition. Eight illuminated images are captured using the self-designed device for every shrunk fabric sample. The second part focusses on the pre-processing the illuminated images in the software. It includes removing the image background, cutting, compressing in Photoshop, and converting to grayscale ones in MATLAB. The last part is running the 3D reconstruction algorithm in MATLAB. Finally, the 3D surface morphology of shrunk fabrics is reconstructed with this method.

Flow chart of the 3D reconstruction method.
On the other hand, as for the 3D scanning method to obtain the surface morphology of fabrics, it takes various time depending on the scanner type, fabric surface complexity, and fabric color. Anyways, the operation process of the 3D scanner included three steps: first, preparation before scanning; second, scanning; and last, data processing after scanning, as shown in Figure 8. For a hand-held laser scanner, some gauge points need to be placed on the fabric surface and the scanner needs to be calibrated to achieve the saturated laser before the scanning. During the scanning, the operator should keep an appropriate distance between the scanner and the scanned fabric. And ensure that the laser beam is perpendicular to the fabric surface as much as possible. After the scanning, the scanning cloud points need to be exported from the bundled software of the scanner named VxScan. Then, the scanned data need to be optimized and processed in the Geomagic Studio (Raindrop, US) software. And the processing consists of the determination of the reference plane, optimization of the point cloud, repairing the polygon and getting the point coordinates.

Flow chart of the 3D scanning method.
In summary, the characteristics of the 3D scanning method prove to be more demanding on the operator’s mastering of the scanner and reverse engineering software, cumbersome operation steps (sometimes even requiring additional supporting device), and expensive apparatus, but the precision is higher. On the other hand, for the 3D reconstruction method, the operation steps are simpler, less time-consuming to operate, and more cost-effective because only one common digital camera is needed. Moreover, the result is more visual, which displays height values in different colors. Therefore, each of these two methods has advantages and drawbacks that we should choose an appropriate one according to the aim of our research.
Conclusions
In this research, a new experimental device based on the photometric stereo has been developed to obtain the surface morphology of the fire-retardant fabrics after flash fire exposure. The developed testing system was able to capture the illuminated images, pre-process the images, and run the 3D reconstruction algorithm. The calculation principles of the 3D reconstruction were explained, which included the determination of illuminator vector matrix, solution of the normal vector field based on grayscale images, and calculation of the surface pixel height based on normal vector field. In order to verify the testing system, 10 fabrics used for the firefighters’ protective clothing were exposed to flash fire produced by the TPP tester. Then, the images of the burned fabrics were obtained, based on which the reconstruction algorithm was running in MATLAB. The results demonstrated that the experimental device could effectively reconstruct the surface morphology of the burned fabrics based on the illuminated images. In addition, the 3D scanning of the burned fabric using a hand-held laser scanner was conducted to validate the 3D reconstruction method. Compared to the 3D scanning method to obtain the surface of the fabric, the 3D reconstruction method had acceptable repeatability. And a comparison of the operation process between these two methods in obtaining the fabric shape showed that the 3D construction method introduced in this study is easy-to-use, less time-consuming, and more cost-effective.
Footnotes
Declaration of conflicting interests
The author(s) declared no potential conflicts of interest with respect to the research, authorship, and/or publication of this article.
Funding
The author(s) disclosed receipt of the following financial support for the research, authorship, and/or publication of this article: The author(s) would like to acknowledge the financial support from the National Nature Science Foundation (Grant No. 51576038), Shanghai Municipal Natural Science Foundation (Grant No. 17ZR1400500), and the Fundamental Research Funds for the Central Universities (Grant No. CUSF-DH-D-2019099, 2232019 G-08).