
Abstract
In last decades, using fibrous piezoelectric materials as energy harvesters and sensors attracted huge attention. Ductile behaviors and biocompatibility are the most beneficial characteristics of polymer-based materials, particularly poly vinylidene fluoride which is used for fabrication of wearable energy harvesters and sensors. Evaluation of piezoelectric properties, especially fiber and nanofiber piezo-polymers, is one of the most important inconveniences mode, particularly to quantify the sensitivity performance of fabricated devices, i.e. output voltage divided by the applied pressure. Conventional methods mostly are indirect, irrelevant and predominantly measure a related parameter instead of the main factor; they are also time consuming, expensive, constrained and have a high error rate. In this study, based on direct effect of piezoelectric, a novel universal system (PiezoTester) is presented to characterize piezoelectric properties and sensitivity of sensors and energy harvesters, especially flexible polymeric devices. This system was used to test three samples that are different in ZnO nanoparticle percentage in poly vinylidene fluoride/ZnO electrospun mats and its results compared by other measuring methods such as XRD, FTIR and differential scanning calorimeter as indirect methods and criterion piezoelectric method as a direct method to validate its performance. Promising evidence inferred PiezoTester could be used as a reliable system to evaluate piezoelectric properties of flexible energy harvesters and sensors as well as wearable gadget and smart textiles.
Keywords
Introduction
Using energy harvesters as green sources of energy which are capable of providing electrical power from the environment and human movements for portable and miniature devices has attracted enormous interest [1,2]. To this aim, various methods such as using thermoelectric materials [2–5], triboelectric materials [6–8] and mechanical energies [9–11] have been developed. Among these methods, deriving electrical energy from vibrations and mechanical movements has received more attention from many researchers as it has numerous advantages such as being independent of environmental conditions and availability at the most times [12–17]. Piezoelectrics, materials with the ability to convert electrical and mechanical energy to each other, are one of the most important materials used in this method [18]. For portable electronic devices, the integration of a wearable piezoelectric energy harvester, which can convert the body movement to electrical power, would be the most promising way to provide a sustainable and portable energy source.
Moreover, the wearable energy harvester should be equipped with flexible polymeric materials like polyvinylidene fluoride (PVDF) to utilize such mechanical energies effectively [19]. PVDF is a semi-crystalline polymer (with a crystalline percentage of between 50 and 60%), which has four crystalline structures α, β, γ and ɛ, and the most important phase in terms of piezoelectric properties is β phase [20,21]. Mostly in lecture, polymer structure is characterized by XRD, FTIR and/or differential scanning calorimeter (DSC) to evaluate crystallinity and β phase as a criterion of harvesting performance [22,23]. Moreover, other methods are used to test piezoelectric and ferroelectric properties directly. Leeuw et al. [24] measured the strain and displacement of ferroelectric domains of active layer caused by an external electrical field to evaluate PVDF nanofiber mats. Öğüt et al. [25] and Mota et al. [26] determined displacement and strain of piezoelectric material owing to electrical field action to measure the piezoelectric response of active layers. Atomic force microscopy (AFM) [27,28], measuring samples output under vibration [29,30], tapping by hand, ball drop [31] or bending [32,33] are some other methods used to evaluate the piezoelectric properties. Fang et al. [34] used thermoelectric instruments to test PVDF nanofiber mats. These methods have particular complexities or indirectly evaluate and characterize the fabricated devices. In this paper, to standardize and simplify the evaluation of piezoelectric properties, a self-designed mechanical-electronic evaluation system (PiezoTester) is presented. One of the main positive points of PiezoTester is its ability to measure the applied pressure which makes it possible to evaluate the sensitivity of mats with predefined forces and frequencies. PiezoTester is recommended for evaluating power-scavenging devices and sensors, especially the flexible fibrous based, due to its simple measurement and high accuracy. In order to evaluate the PiezoTester performance, three PVDF-ZnO nanocomposite mats fabricated with different ZnO nanoparticle percentage and their piezoelectric properties characterized in both direct and indirect methods.
Material-method
Electrospinning of nanofiber mats
Properties of fabricated composite nanofiber samples for device fabrications. All solution prepared in 26 wt%, and stirred for 2 h and sonicated according to previous studies [30].

Energy harvester samples fabricated by a 2 × 2 cm nanofiber mat with 120 µm thickness (measured by Shirley Fabric Thickness Tester, model SDL34, based on ASTM D1777) as an active layer which is placed between two aluminum foils as collectors. A pair of thin paper tape is used across the electrodes to prevent moving of electrodes (Figure 1).
Schematic view of fabricated power harvester devices.
Nanofiber characteristics
Scanning electron microscope (SEM, model: XL30, PHILIPS Co.) was used to characterize the uniformity and morphology of nanogenerator mats. All samples were gold-coated (Bal-Tec. SCD50 sputter coater) and the images were taken at an acceleration voltage of 20 kV. The fiber diameter was measured using image processing software (ImageJ, National Institutes of Health, USA). The crystalline structure of the samples also was tested and evaluated to investigate the structure. DSC (model: DSC 2010, TA Instruments.co) was used at a heating rate of 20℃/min to determine the crystallinity of nanofiber. The percentage of crystallinity of fabricated mats can be calculated by equation (1). FTIR spectroscopy (model: NEXUS 670, Nicolet Co.) was also used to investigate the structure of the fabricated nanofiber mats. The beta phase ratio of crystallinity can be calculated with equation (2), where, Aα and Aβ are absorption in 766 and 840 cm–1 for α and β phases, respectively, and Xα and Xβ are the degree of crystallinity in α and β phases [36,37]


XRD (EQuinox 3000 model, INEL France Co. using Cu-Kα radiation, wavelength 0.154 nm) was used as another method to study the β phase and crystalline structure of mats. The peak at 2θ = 20.5 belongs to the β phase, and 2θ = 18.5 pertinent to the α-phase.
Since the β phase of crystalline part of PVDF is the most important phase in piezoelectric properties [20,21], it can be considered that by increasing the crystallinity and β phase ratio, piezoelectric properties will be increased.
In addition to the structural and indirect tests, the electrical output of samples was examined by standard piezoelectric method (Figure 2) based on the previous study [30] as a direct method. In this method, a standard piezoelectric (which is used in Hydrophone) was placed on the sample (as shown in Figure 2) and motivated in a certain voltage and frequency by a function generator (Synthesized Function Generator - SFG - Gwin Insteck Co.; Applied Voltage and frequency were 21 volts and 75 KHz). Due to the converse piezoelectric effect, standard piezoelectric would be induced and transfer its vibration to the sample. Because of the direct effect of piezoelectricity, this vibration makes an electrical response in the sample that was measured by Oscilloscope (GDS-1102 - Gwin Instek Co.). Since the applied frequency and voltage to standard piezoelectric are specified, the vibration will be the same for all the samples and provide the possibility of comparing the results.
Measuring the electric response of samples by standard piezoelectric method: (a) schematic view, (b) picture of assembled set-up during the examination. In this method, the surface between samples and standard piezoelectric was filled by oil to improve vibration transmission.
Design of PiezoTester
PiezoTester has been designed to evaluate the performance of piezoelectric harvester (especially flexible nano-generators and sensors) based on direct piezoelectric effect in two modes, tapping (pressure) mode and bending.
In tapping (pressure) mode, it is necessary to apply a predetermined load on the samples, followed by measuring their electrical output. Since the frequency has a great effect on the output, frequency should be adjustable too. The load will be applied to the sample using a step motor, an adjustable disc, follower and an impact head with various shapes in order to change the effective surface (Figure 3). The cam convert rotation movement of step-motor to a vertical displacement and follower transfers it to the impact head, and the sample is placed inside the impact head. Impact head is also an electrical shield to protect samples from ambient electrical noises. Effective applied forces were measured by a load cell located exactly below the sample. Effective surface, loading frequency and load are three adjustable parameters in tapping mode. The effective surface can be adjusted by changing the size and shape of the impact head. Frequency can be set by controlling the rotation speed of step motor, and load intensity can be regulated by changes in radial movement. The electrical output load cell is measured by an oscilloscope. The applied load can be calculated by equation (3).
Schematic of the mechanism for applying the force on the samples. Different dimensions and shapes, such as (a) quadrangular and (b) circle, are available depending on the requirements.

In bending mode, a load is applied on the sample and bent to a predetermined radius and electrical output will be measured. Similar to tapping mode, the cam convert rotation movement of the step motor to a vertical displacement and follower transfers it to bending head (Figure 4). Bending head is designed based on three-point bending of flat materials. Effective deflection at the middle of the sample can be adjusted by changing the position of cam axis. Deflection (bending radius) and loading frequency are two adjustable parameters in bending mode.
Bending Head. A spring can be used below the sample for test textiles and thin materials.
The electrical charge created in two sides of active layer as the electrical output of samples and load cell is refined and amplified by noise reduction and amplifier circuits (Supplementary data 1) and then measured by a high inner impedance oscilloscope. The gain of the circuit is variable and can be set for each signal at 1, 100, 250, 500 and 1000. Electrical output can be calculated by equation (4). The minimum electrical output which can be measured is 10 µV and the maximum load is 30 N (7500 N/m2) based on the load cell and oscilloscope sensitivity.

Result and discussion
Indirect reference test results
Suitable and steady piezoelectric properties come from a uniform and beadles nanofiber mat. Therefore, it is necessary to peruse the morphology of nanofiber mats first. The morphology of the samples is shown in Figure 5. The images show an appropriate uniformity for each sample. With the addition of ZnO nanoparticles to the polymer solution, since ZnO is a semiconductor particle, the dielectric constant of the solution decreases, and effects on the instability of the whip and charge density in the Taylor cone led to an increase in nanofibers diameter.
Scanning electron microscopy image of active layers. (S1) Mean Diameter: 675 nm, (S2) Mean Diameter: 757 nm, (S3) Mean Diameter: 814 nm.
DSC test was conducted at the next step to investigate the percentage of crystallinity. As is shown in Figure 6, there is an increase in melting enthalpy which refers to the increase of crystallinity for composite nanofiber. DSC results are summarized in Table 2.
Differential scanning calorimeter (DSC) diagram; by increasing ZnO nanoparticle percentage, melting enthalpy and uniformity of slope increased, which refers to increasing in percentage and homogeneity of crystallinity. Melting enthalpy and crystallinity measured by DSC. DSC: differential scanning calorimeter.

FTIR spectroscopy also was used to investigate the crystalline structure and beta phase ratio of samples. Results showed that by adding ZnO nanoparticles, the β phase would be increased (Figure 7 and Table 3).
FTIR spectra of PVDF and PVDF-ZnO nanofiber mats. PVDF: polyvinylidene fluoride. The important absorption intensity of FTIR spectra and β phase percentage of samples.

Diagrams of XRD test are shown in Figure 8 (and Table 4). As it can be seen, with the addition of ZnO nanoparticles, the peak intensity increases at a 20.5 angle that belongs to the β phase and decreases at 18.5 that belongs to the α-phase. Furthermore, there is a small increase in the α-phase intensity in S3 compared to S2, which refers to increases in the overall crystallinity of nanofibers, as shown in DSC results. These results are approved by DSC and FTIR results.
X-ray diffraction diagram of samples. Samples were analyzed at room temperature. The intensity of XRD angles. XRD: X-ray diffraction.

Generally, structural tests showed that polymer crystallinity would be increased by adding ZnO nanoparticles. The reason for this improvement refers to the formation of crystalline that nanoparticles act as a core which helps crystalline growth, so by increasing the nanoparticle, more cores are available, and it enhances proliferation of crystalline nanofibers. On the other hand, adding nano ZnO, which is a semiconductive nanoparticle, causes changing the conductivity of the solution. During electrospinning process, a large electrical field is applied to the solution and this enhancement in conductivity causes more electrostatic force to act on polymer and backbone and chain of polymer arrangement will be improved and more beta phase will be apparent. These happenings provide more piezoelectric properties in PVDF nanofibers [37]. Furthermore, ZnO nanoparticles are piezoelectric materials intrinsically, so it is expected to improve the harvester performance and its electrical output.
Direct reference test results
The electrical output of samples obtained from the standard piezoelectric method (each sample tested for five times and the average are reported).

As mentioned before, by adding ZnO nanoparticle, the crystalline structure of PVDF improved and ZnO has piezoelectric properties and, in sum, using this nanoparticle brings better properties. Furthermore, adding the nanoparticle changes conductivity of samples and enhances electron transfer. So, it can be seen that ZnO nanoparticles increased electrical output.
PiezoTester results
Prepared samples examined by other methods were tested again by PiezoTester to evaluate its performance. The amplification factor of load cell set in 500 and Amplification factor of the output set in 1000.
Firstly, samples were evaluated in tapping mode and all samples induced by the same cyclic load in 6 Hz frequency and 1.56 N. Output signal of the samples are shown in Figure 9 (Sample S1), Figure 10 (Sample S2) and Figure 11 (Sample S3). Yellow signal shows the electrical signal of the load cell, and the red one is electrical output. The waveform of signals is very important to analyze the piezoelectric responses of each samples. As it can be seen, after tapping, load cell sense a damping signal (Figure 9(a)) that just firs peak belongs to the applied force and secondary peaks come from vibration created in the sensor. Effects of these vibrations can also be seen in the electrical output of the sample (Figure 9(b)). Therefore, the first peaks either in load cell and electrical output are the main peaks.
Output signals of sample S1. (a) Force signal, (b) electrical output of sample. Volt/div of each signal can be adjusted separately, Volt/divsample = 1 V/div and Volt/divLoad cell = 1 V/div, Time/div = 50 ms/div. Part of output signals of sample S2. (a) Force signal, (b) electrical output of sample. Time/div = 50 ms/div, Volt/divsample = 500 mV/div and Volt/divLoad cell = 1 V/div. Part of output signals of sample S3. (a) Force signal, (b) electrical output of sample. Time/div = 50 ms/div, Volt/divsample = 500 mV/div and Volt/divLoad cell = 1 V/div.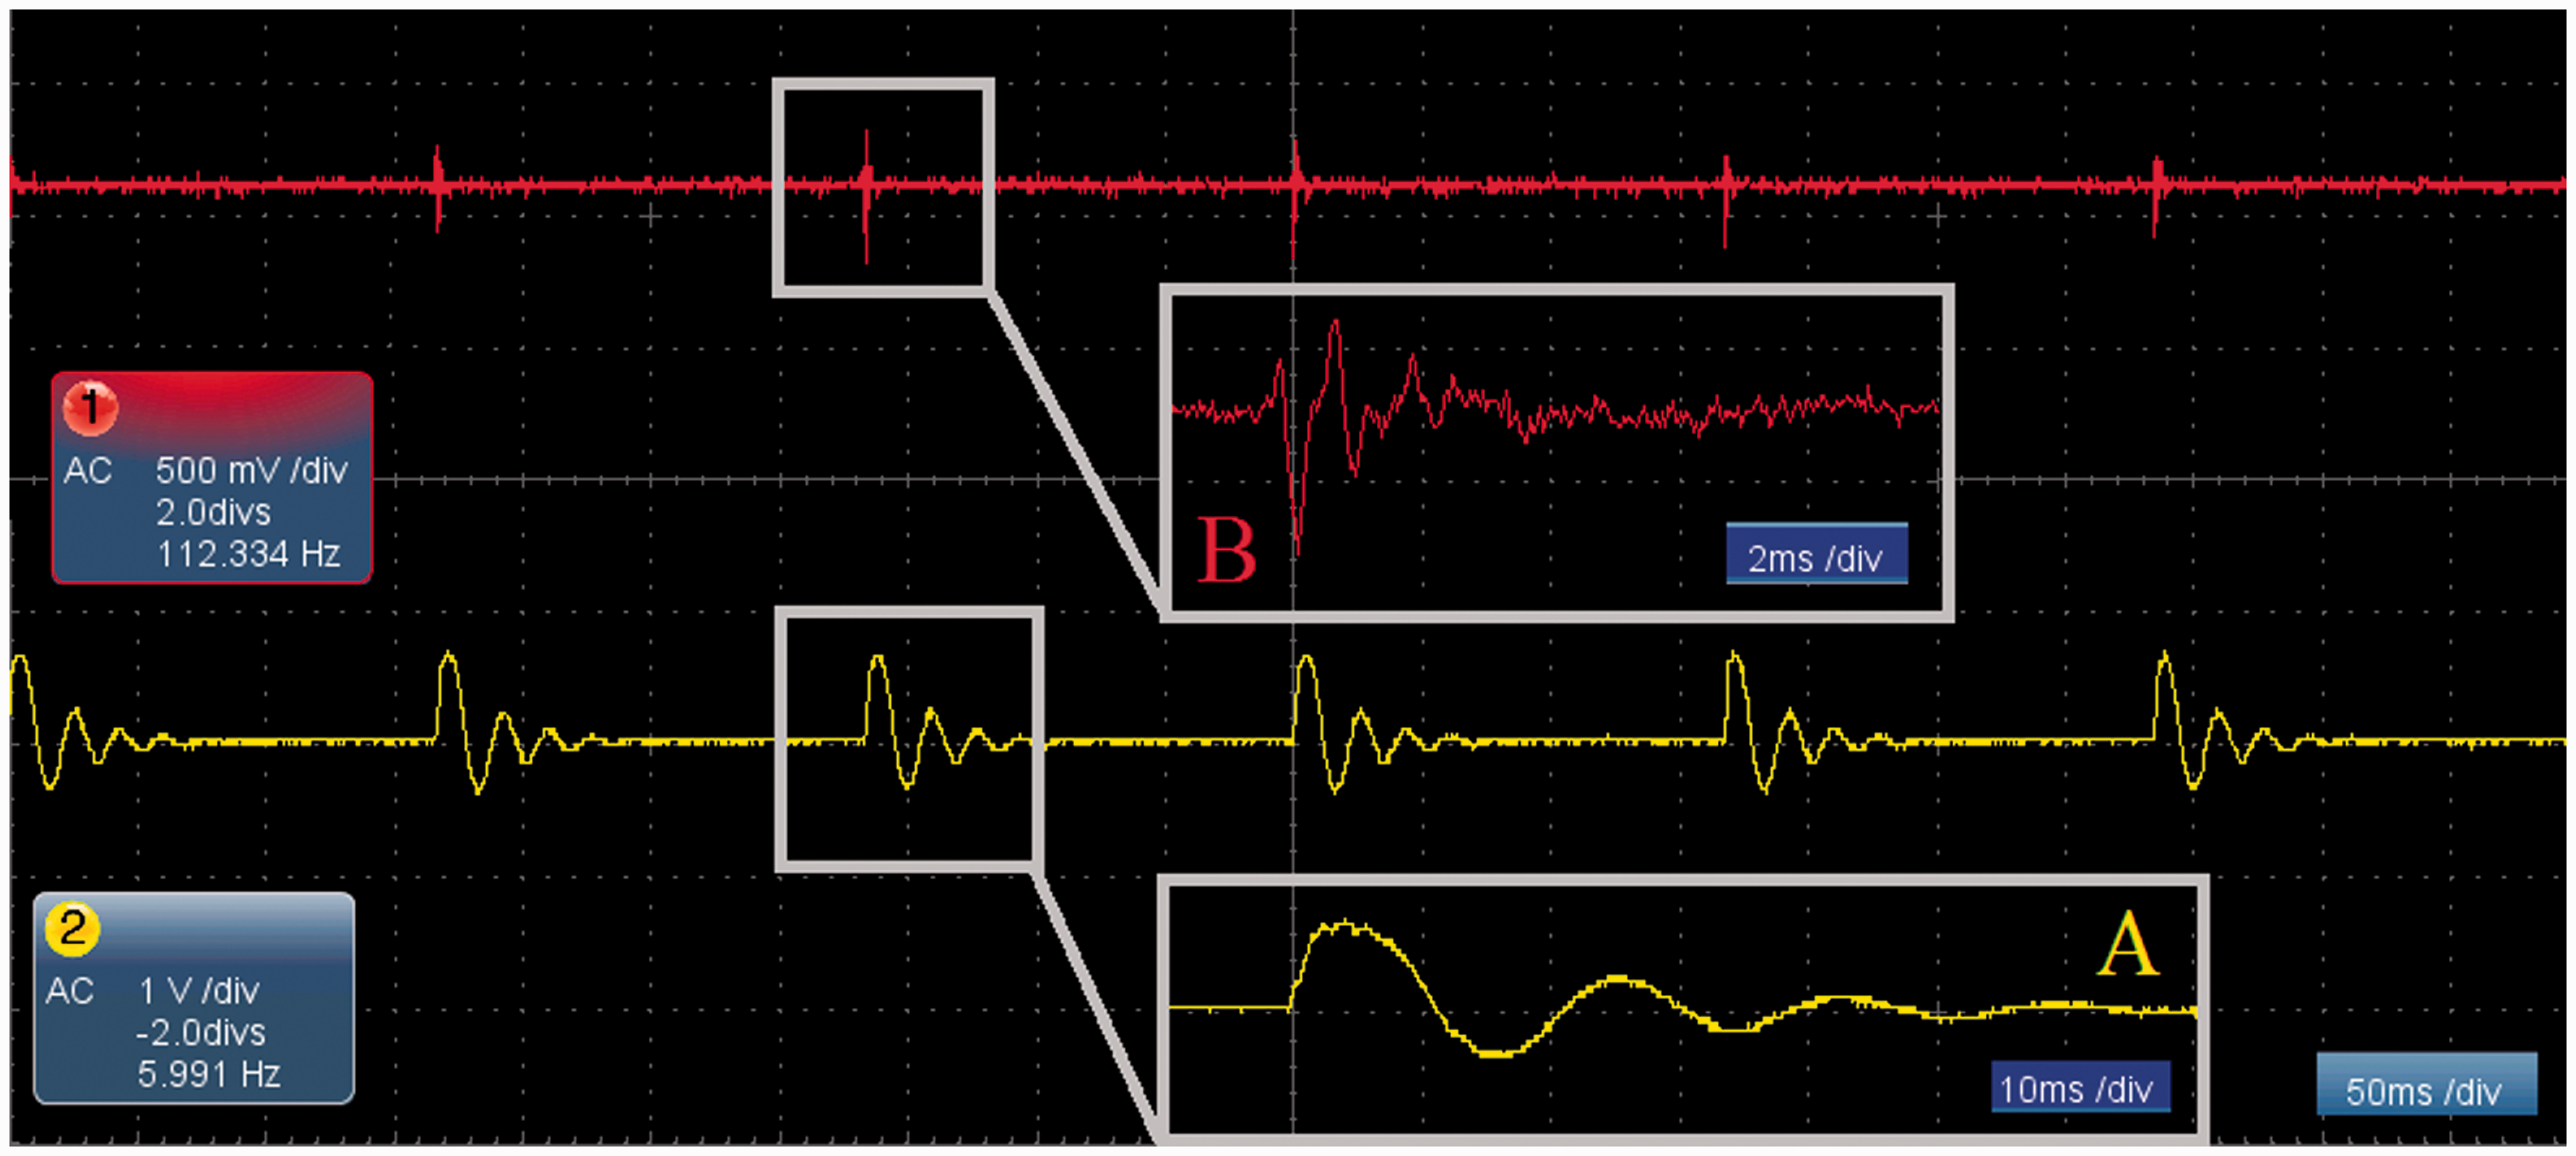


The electrical output of the sample measured by PiezoTester.

Response time is the next important issue; as is shown in Figure 12, for a same applied load, the sample outputs are faster and sharper, which indicates that piezoelectric samples can be used as high-speed response sensors. The response speed indicates the resolution of the sensor and by increasing ZnO nanoparticle, resolution of samples improved. Therefore, response time and resolution of samples can be evaluated in addition to the electrical output by PiezoTester.
Magnified signals of PiezoTester signals. By decreasing time/div, more detail of signals can be seen which are useful for analysis of harvesting properties. Volt/div sample = 1 V/div and Volt/div Load cell = 1 V/div.
The dimension of the tapping head is another advantage of PiezoTester. Tapping head is larger than samples and the entire surface of the sample can be induced. This feature overcomes the non-uniformly distribution of nanofibers diameter within the nanofibrous mats during the fabrication process. This property increases the accuracy and repeatability of testing. Measured electrical output depends on the applied load and by changing the force, the output will change. To remove this correlation between load and output, a parameter is defined, “sensitivity”. Sensitivity can be calculated by dividing electrical output and the applied load, so its unit will be V/N or mV/N. Samples that are tested in different forces can be compared by their sensitivity.
Samples were also tested in bending mode. In this mode, the sample dimension should be changed (5 × 1 cm) based on the bending standard (ASTM E855). Bending displacement was adjusted in 5 mm and load applied in 6 Hz; signal of bending mode is shown in Figure 13. The first point on bending mode is that two peaks can be seen in every cycle of loading, the first part is due to applying the load, and the second part is due to the removal of load; loading output and unloading. Loading output usually is more than unloading peaks.
Electrical output of samples in bending mode; Volt/div = 50 V/div.
The electrical output of samples measured by PiezoTester in bending mode, applied frequency = 6 Hz.

Different values in the electrical response of the standard piezoelectric method and PiezoTester also comes from the difference in mechanical energy applied to the samples. In the standard piezoelectric method, vibration in high frequency is applied on samples, but in PiezoTester a low-frequency load is applied on samples. Therefore, the electrical output are slightly different but in both methods the same trend can be obtained.
Calibration and possible errors of PiezoTester
Calibration can be divided into two parts, first calibration of load cell and second calibration of circuits.
Calibration of load cell: based on datasheet of the load cell, electrical output of the load cell in maximum loading (30 N) is 22.584 mV (when a 12 V power supply is used). When a certain force is applied to the load cell due to the placement of a sinker with specified weight, a certain electrical output can be also detected. For example, a 4.6 mV peak must be seen when a 500 g weight is placed on the load cell. If the output is not suitable, then a correction factor should be used.
Calibration of the circuit: a function generator can be used to test the circuits. A known signal which is created by function generator will be used as an input and the output can be seen by Oscilloscope. The output wave must be amplified according to the amplifier circuit. Otherwise, it will be adjusted by the variable resistance that specifies the gain size.
Possible errors:
Adjusting the cam: if cam screw does not fit well, the applied load decreases in every cycle. It can be seen from load cell peak which will be decreased. Adjusting the load cell: if an unusual signal (very sharp, very wide, two steps peak, etc.) has been seen from load cell, it refers to screws of the load cell. Grand connection: if there are electrical responses during testing a nonpiezoelectric material, the grand connection of oscilloscope must be checked. If oscilloscope is used without an earth connection, each channel affects each other, which might change the output signal. Detecting the true response: the main response of piezoelectric is the first peak. Other peaks are caused by vibration of the load cell. Maximum error of PiezoTester is 5% (refer to the Supplementary data).
Conclusion
Performance evaluation of polymer-based fibrous piezoelectric devices is one of the most difficult task to perform due to their flexibility compared to other types of energy harvesters. Conventional methods mostly are indirect, irrelevant and predominantly measure a related parameter instead of the main factor; they are also time-consuming, expensive, constrained and have a high error rate. In this study, based on the direct effect of piezoelectric, a novel universal system (PiezoTester) is presented to characterize piezoelectric properties and sensitivity of sensors and energy harvesters, especially flexible polymeric devices. To validate the PiezoTester performance, three samples composed of different ZnO nanoparticle percentages in electrospun PVDF fibers (S1: pure PVDF, S2: 7% ZnO and S3: 15%) were tested using the proposed system and their results compared by other indirect measuring methods such as XRD, FTIR, and DSC. However, the numerical value of the results due to differences in the mechanism of loading was different, but all tests showed the same trend that ZnO nanoparticles improved piezoelectric properties of the harvester. PiezoTester could be used as a reliable system to evaluate piezoelectric properties of flexible energy harvesters and sensors as well as wearable gadgets and smart textiles.
Footnotes
Declaration of conflicting interests
The author(s) declared no potential conflicts of interest with respect to the research, authorship, and/or publication of this article.
Funding
The author(s) disclosed receipt of the following financial support for the research, authorship, and/or publication of this article: the ATMT Research Institute, Amirkabir University of Technology and INSF (Grant No. 92004158).