
Abstract
The aim of this article is to present a new type of testing device used for computer tomographic analysis of the structure of a microfiber fabric and a porous artificial leather under deformation. The load exerted by an occupant sitting motionless on a vehicle seat is to be analyzed. The load is determined on complete seats with test persons (no dummies) carrying out the tests. The result is the specification of a pressure range over the test group of people that is valid for both materials. In the next step, the load condition is adapted to a 1:1 substitute test model and finally to a test device for computer tomography. The description and validation of the load conditions are carried out by finite element simulation, and a comparison with the measurement series is carried out. In summary, it can be stated that the developed loading device represents a good representation of reality. This includes the boundary conditions assumed for the design, the inaccuracies of the finite element simulation, and the measurement systems. The analysis of the structural properties of a reference surface is possible with a resolution of 5 µm.
Introduction
In the literature, there are a large number of test methods which make it possible to test the mechanical properties of a vehicle seat as well as its individual components in a 1:1 scale by simulating the load of a seated person. The majority of these test procedures are used for quality control, material design [1–10], or to objectify the seating comfort [11–16]. A test can be performed either on the entire seat, on parts of the seat, or up to substitute specimens. The shape of the specimen to be tested varies according to the test method. There are significant differences in the level of test force and duration of loading. Many methods exist especially for the analysis of the mechanical structure and the long-term usage properties of foams [1–10]. The effect of these properties on seating comfort has been the subject of numerous different studies in the literature [11–16]. In addition to the standards listed, there are specific test specifications for each car manufacturer. The test methods listed in the literature cannot be applied to the case under investigation due to the following points:
The test methods all have in common that they simulate the load case only on a scale of 1:1. Due to the dimensions of the indentors and specimens used, the test setups shown are usually relatively large and therefore not suitable for a computed tomography (CT) beam path. The existing test setups also exhibit high absorption rates since they are made of metallic components. This is particularly problematic in view of the low absorption properties of the textile and artificial leather to be investigated. Due to the high absorption rate of the emitted rays, the desired resolution cannot be achieved.
Based on the above mentioned points, a suitable device must be newly developed which allows the specimen to be clamped. This must simulate the condition of a cover material on the vehicle seat as realistically as possible. In addition, a test stamp must be developed to simulate the load. From the test methods available for foam testing according to Faust et al. [13,14] and DIN 53579 [6], various stamp shapes are known. These serve as the basis for the test stamp of the new device. Depending on the application, the punches are either spherical or circular in shape. The latter can be flat or convex. For example, a calotte-shaped indentor represents a good simulation of the ischial tuberosity [6,13,14]. In addition to the simple indentor geometries, there are those that simulate a single body part or body region [17].
The aim of this article is to present a novel device for the computer tomographic analysis of seat cover materials. Here, the load of an occupant sitting motionless on a vehicle seat is to be analyzed. There is no comparable test method known from the literature that allows the investigation of the structure of seat cover materials in CT under simulation of the load scenario mentioned. Furthermore, no test method is known that simulates the load condition in a small enough scale. This however is necessary to represent the structure with a resolution of 5 µm as required to examine the inner structure precisely enough for a subsequent research project. In order to achieve a high resolution, it is necessary to develop a test device that can be placed as close as possible to the X-ray source, but at a large distance from the detector.
Methods
The basis for the development of the test method is a test with real test persons aimed at determining the pressure loads on the cover structure as they occur under real customer conditions. The analysis is carried out on two seat structures. The pressure ranges determined and the load condition are then to be simulated as realistically as possible by the newly developed device. In addition to defining a representative clamping, it is also necessary to define a suitable indentor geometry. Furthermore, the indentor must be positioned above the clamping unit by means of a suitable design such that pressure can be applied over the sink-in depth of the indentor. The relationship between indentor travel and compression force is determined by means of an external tensile testing machine.
The indentor is designed and validated in two steps. In the first step, a substitute test is used which shows the human ischial tuberosity in a scale of 1:1. It is known from previous research [18–22] that the highest loads are generated on the vehicle seat under the ischial tuberosity. For this reason, the focus is on the worst case scenario. The load condition is then adapted to the newly developed device. A finite element (FE) simulation model is created as an aid for validation. In addition to the FE simulation, known mechanical material properties, such as the sliding and tensile properties of the investigated materials, are used. The newly developed device will be used in future research work to record high-resolution CT scans of the structure of any cover material under various pressure load conditions.
The determination of the pressure values and the further investigations are carried out on purely synthetic cover materials. The focus here is on a microfiber fabric, a conventional artificial leather (standard artificial leather for seating applications), and a new type of porous artificial leather. The first is a microfiber composite consisting of a microfiber knitted fabric (polyester and polyamide) and a polyurethane coagulate [23]. The porous artificial leather is a hybrid material of polyurethane and polyvinyl chloride. The statistically distributed pores are inserted in situ. Since this material, like all artificial leathers, is a multi-layer composite, a communicating pore network is created by superimposing several porous layers [24]. The standard artificial leather is made of polyvinyl chloride and contains no pores. Both artificial leather variants exist in a condition that is laminated with knitted fabrics. The microfiber fabric is unlaminated. The pressure loads on the overall seat are determined using standard artificial leather and the microfiber fabric. The pressure areas determined are then adapted to the porous artificial leather. All further tests are carried out on the microfiber fabric and the porous synthetic leather.
Determination of the real pressure loads
In the first step, the influencing variables on the load condition of a vehicle seat cover material are determined and boundary conditions are derived for the research work described below. The load acting on a cover material is influenced by a number of factors. Pressure loads on seats have already been determined in previous research work [18,21–24]. Due to the multitude of influencing factors as described below, a re-consideration is required for the specific application to be analyzed. With regard to the occupant exerting the load, the weight and geometry of the part of the body under consideration are of particular importance. In order to take into account the influence of different body measurements and weights, the test group of people is selected as broadly as possible. The cover material also has a significant influence. Depending on the mechanical properties, the tension of the cover material varies in the unloaded state. This in turn depends on the type of lamination applied and the mechanical properties of the surface material. In addition, the substructure must be observed. The foam cushion and any intermediate layers cause various restoring forces and thus sink-in depths of the body into the seat. Finally, the geometry of the seat is important. Assumptions have to be made for the next steps. A fixed seat geometry (multifunctional seat of the current BMW 7 Series) with a defined substructure consisting of foam cushions and climate cotton wool sewn to the surface material (100% polyester fleece with charmeuse) is considered. Since there are no exact specifications for the tension of a cover surface for the seat under consideration, realistic pre-tension conditions are assumed for the research work.
Age and weight distribution of the test group of people.

In the run-up, the test persons are measured according to DIN 33402 [27,28] to determine the parameters: weight, body height, back of knee to bottom length, and shoulder height. These are required for the evaluation of the pressure ranges by the test persons. The width of the bottom and the back are assumed to be constant, based on the research work of Mergl [20,22], Hartung [19,21], and Zenk [18] as it is not possible to measure the spread of fat tissue and possible deformations in this research work. The width of the back is 500 mm and the width of the bottom is 400 mm. To validate these assumptions, the hip width is additionally determined on all test persons.
The seat is in the as-designed position for the 50th percentile to ensure that the seating position is as realistic as possible. The so-called as-designed position is used to determine seat-specific measuring points such as the hip point and has a seat inclination in the middle of the adjustment range and a backrest inclination of 25°. In addition, the test bench is equipped with a foot positioning system based on vehicle-related simulation data. Basics for the simulation of seat positions as well as the definition of specific measuring points for design are described in the literature [24]. The experimental setup is designed as evident from Figure 1. Before the start of the test, the test persons receive instructions on how to take the seat and on the head and foot positions during the measurement. This serves to increase reproducibility. The pressures are detected by means of capacitive sensors in the form of mats (X Sensor X3 LX-100) that are positioned on the seat surface. The measuring error of the sensors is approx. 5% of the measured end value. The alignment of the templates is done with the help of a grid on the mats. This is positioned at a fixed point on the seat and backrest surface. The measured values are detected over the entire contact surface between test person and seat surface and are available in the form of a pressure distribution graph.
Layout of test with real test persons with heel positioning depending on percentile.
The so-called body map according to Hartung [19,21] is used for the body part-related evaluation of the pressure measurement data. In his research project, Hartung developed a model for predicting discomfort from objective parameters of seat pressure distribution. He developed a body map to divide the body into 17 defined areas. This is also implemented in the evaluation software V8 XSensor Auto Seat Mode used for this work and can be individually adapted to the human being with the help of the body parameters (hip and shoulder width, knee-bottom-length, shoulder height). The leg opening angle can also be taken into account. The body map and its implementation in the software are shown in Figure 2.

In this work, the shoulder height and the knee-rear seat length are determined and the templates are adapted for each test person. In this work, the templates are adapted to the individual body dimensions. There is no rotation of the templates to take the leg opening angle into account. By detecting the sitting position while the test is performed, the template can then be positioned exactly on the pressure distribution. The measuring time per test person is 50 s. The measured value is recorded every second. The mean and the maximum pressure of a measuring region (averaged over 50 points in time) are evaluated as relevant measured variables. The zones of the body map serve as measuring regions. When calculating the standard deviation, the assumption is made that the test group of people is a specimen of the population. For further evaluation, only the areas of the body that are in constant contact with the seat in a driving situation are considered. These are the lower lumbar region, the left and right buttocks, and the upper thighs. In the next step, an average value for the mean and maximum pressure per body area and percentile group is determined. In addition, the highest maximum pressure per body part occurring in a test person is evaluated in order to cover the upper limit of a possible load range. In the last step, all values for the mean and maximum pressure are summarized in pressure ranges per body part. For both characteristic values, the range extends across all percentile groups from the minimum value minus standard deviation to the maximum value plus error.
Simulation of the loads by means of a substitute test
In the next step, the determined loads are simulated on flat (sheet) material. The aim is to analyze the structure of the surface of the microfiber material and the porous artificial leather by CT with a resolution of approx. 2–5 µm, unloaded and loaded. The load condition should simulate the test group of people as real as possible. The device shall allow testing of the composite of surface material, lamination, and foam. The developed device essentially consists of four parts. First, a flat surface is used to support the specimen plus the substructure. It also has a fixing unit and a clamping body. The latter is used to apply the clamping force to the cover fabric. The fourth part is a test indentor for applying the compressive loads which is positioned in a frame during the CT scans. The newly developed loading device outside the CT is designed as evident from Figure 3.
Developed loading device with clamped specimen and positioning unit for the test indentor.
The material to be analyzed is placed in the loading device and uni- or biaxially pre-tensioned by means of compressed air cylinders. Based on the defined test surface and the device described below, the specimen geometry of the cover material to be tested is determined as shown in Figure 4. The design of the specimen geometry and the clamping device is based on the premise that the human error during specimen preparation, clamping, and operation is kept to a minimum. A specimen consists of a flat central section and four fastening sections. The geometry of the specimen is selected in such a way as to ensure a continuous edge profile. This serves to ensure that the acting forces are evenly distributed in surface 1 of the test specimen and to avoid stress peaks in the test surface. The area marked with 2 represents the indentor support area.
Specimen geometry of the developed device with marked indentor contact surface (outer area 1) and test surface (inner area 2).
The geometry of the specimen results from the premise that the possibility of a biaxial as well as a uniaxial stress state exists. This is required to ensure the greatest possible flexibility. By using a single pair of clamps (Figure 5: Clamp pair 1), a uniaxial state of stress is possible. In this case, the specimen is only fixed in the clamp pair perpendicular to the direction of tension (Figure 5: Clamp pair 2) after the pre-tension has been applied. A foam block is positioned underneath the middle section in a rectangular recess of the device, which simulates the seat substructure. This is necessary because without foam the load condition does not correspond to that of a vehicle seat.
Fixation unit and middle body of the load application device with clamp position and designation of clamp pairs.
The next step is to develop a suitable clamping system to apply a defined pre-tension and fix it in position. The pre-tension condition must be reproducible and applicable to all cover materials to be examined. It must be possible to apply and analyze this in a defined manner. The clamping of the specimens is realized by means of a fixation unit. The fixation unit consists of four clamps through which the specimen can be fixed and aligned without applying a clamping force. The specimen is then stretched over the support surface by means of the middle body (see Figure 4) which can be moved relative to the fixation unit. This produces a defined and reproducible clamping force on all four sides of the specimen. The clamping body is moved via a compressed air cylinder. An external test device is used to determine the relationship between the pressure prevailing in the cylinder and the traverse path of the clamping body when the specimen is clamped. By means of the relationship between the resulting elongation and the traverse path, the condition can be described. This relationship is determined by simulation (“Validation of the substitute test” section). The set traverse path is checked by means of X-ray image control before each measurement. In a further step, the indentor travel/compression force curve for the pre-tensioned specimen is determined using a tensile testing machine and is available for pressure setting for CT analysis.
An important aspect of the device is that there is no unnecessary absorption of X-rays by the device itself. Therefore, the device was made of plastic and was manufactured with ribbed structures to avoid thick walls. The manner in which the load is to be applied must be defined. It is known from the literature [18–22] as well as from the test persons that the highest load occurs below the ischial tuberosities. The highest deformation of the surface can therefore be expected in this area. After considering the human anatomical conditions of the ischial tuberosity, the calotte-shaped indentor with a diameter of 75 mm specified in DIN 53579 [6] best corresponds to reality. The new indentor is designed on the basis of this indentor. Due to the small dimensions of the planned device, there are two possible solutions.
The first one is based on shrinking the original indentor to a diameter of 1 cm. In this case, it is possible to ideally simulate the global elongation. However, the change in curvature is due to the change in radius and thus the changed load on the fibers is problematic. When shrinking the indentor, it must also be borne in mind that the textile structure (weaves) remains the same and therefore the complex 1:1 shrinkage of the original indentor does not lead to a more realistic reproduction. Alternatively, starting from the vertex, a ball segment of the original indentor can be cut out with an upper diameter of 1 cm. This indentor enables the simulation of identical fiber distortion due to the resulting elongation. However, the problem here is that due to the low sink-in depth of a maximum of 0.34 mm, it is probably not possible to simulate the determined pressure range. Based on the problem described, a new solution must be found for an indentor that is able to simulate the determined load of a seated occupant on the new test device for the CT. If one considers the ratio of the area to be tested to the area of an ischial tuberosity or even the entire body surface, the curvature of the new indentor can be regarded as negligible. For this reason, the indentor geometry will be a disc with a diameter of 1 cm. The area to be tested shall be concentric with the center of the indentor and shall be 0.5 cm2 (see Figure 4). In this way, only areas are scanned that are not exposed to edge effects from the edges of the indentor (Figure 4: Inner area 1). By means of this design, different sink-in depths can be achieved depending on the substructure to be tested. The simple geometry allows an easy conversion of the force to the acting pressure.
Maximum tensile force and elongation according to DIN EN ISO 1421 and picture frame test.

The first step is to create material models for the microfiber fabric and the porous artificial leather. For this purpose, the force/elongation curves determined according to DIN EN ISO 1421 [29] are used (for summary see Table 2). In addition, the shearing behavior of both materials is determined by picture frame testing. This test was originally used for the investigation of fabric reinforced composites [30]. The testing of cover materials by the picture frame process is not standardized but is carried out according to internal company working instructions. The microfiber material shows a more elastic material behavior than artificial leather. The material properties mentioned above cause the tension in the material as well as the force required for the indentor to sink in. Under the same boundary conditions, an elastic material offers less resistance to sinking in of the indentor than a stiff material. By means of these models and the geometric boundary conditions of the described first experimental setup, a purely elastic explicit simulation model (model 1) is created. This is composed of two-dimensional elements of first order (material sample: membrane elements type M3D4R, foam: C3D8 volume elements) and uses linear approach functions. The test stamp is defined as a deformable body to ensure a good contact calculation. For this purpose, the elements of the stamp in contact with the membrane are defined as shell elements. The indentor is made of steel (S420MC-IDS) and can therefore be regarded as a stiff body compared to the contact partners. For the design, the real friction between the top of the specimen and the indentor is taken into account and entered in the model. The sliding friction of μG = 0.43 for the microfiber fabric and of μG = 0.26 for the porous artificial leather determined according to DIN EN ISO 8295 [31] are taken into account. These represent the sliding friction of the underside of the specimen on polyoxymethylene. The upper movable part of the device is made of this material. In the same way the adhesive friction is determined with μH = 0.51 for the microfiber fabric and μH = 0.38 for the artificial leather. The friction between the underside of the sample and the test device is set to 0.05. Since the surface is polished, a low friction is assumed here.
In the next step, the force and pressure curves are recorded as a function of the sink-in depth of the indentor to validate the FE model. A Zwick testing machine (type 1447) and a capacitive pressure measuring mat (X Sensor X3 LX-100) are used for this purpose. With the help of the model the resulting elongation at the vertex of the indentor is then calculated as a function of pressure and sink-in depth (path). Detection of the resulting elongation takes place in a defined preload state. Since there are no regulations in the automotive sector regarding the tension of a vehicle seat cover, this varies greatly depending on the cover design and the force applied by the saddler when applying the cover. The requirement here is that the cover must not crease after clamping. A too firm covering and thus deformation of the foam part is also undesirable. More detailed information on the height of the necessary pre-stressing path and the resulting elongation is given in the “Validation of the substitute test” section. The elongation serves as the target value for the newly developed test fixture. If it is possible to reproduce this condition on the new device it can be assumed that it also simulates the condition of a complete seat in a realistic manner.
In order to validate the newly developed device, a simulation model is also set up and compared with the simulation results from model 1. The construction corresponds in the choice of the elements, etc. to that used in model 1. In addition, a comparison with real measurements must also be carried out for the new models. In the following, a distinction is made between two models for the new loading device. In order to compare model 1 with the loading device, a unidirectional stress state must be generated. For this purpose, on the new device only two opposite sides are clamped and loaded. The remaining sides are then clamped in place. This condition is called model 2 in the following. Pre-tensioning of all four sides and thus the generation of a biaxial state is defined as model 3. In addition, the microfiber fabric under investigation is referred to as material 1 and the porous artificial leather is referred to as material 2. The validations of models 2 and 3 are carried out by measuring the real force/compression curves (tensile testing machine) with defined pre-tensioning paths for materials 1 and 2 at the loading device.
Results and discussion
Real pressure loads
The pressure ranges analyzed according to the procedure described in the “Determination of the real pressure loads” section are shown in Figure 6 for each body region. A total pressure range is also specified for each material. The value in brackets represents the highest pressure measured for a test person.

The final values determined are a maximum pressure range from 0.13 N/cm2 to 1.36 N/cm2 for artificial leather and from 0.12 N/cm2 to 2.09 N/cm2 for microfiber fabric. The results show a similar behavior of both materials without considering the pressure maxima. Including the extreme value, the microfiber fabric shows a much higher load range. As known from [18–22], the highest load occurs among the ischial tuberosities or generally in the seat surface area. The determined ranges correspond well with the values known from the literature. The microfiber fabric shows slightly higher values due to its lower elongation in longitudinal and transverse directions. The question arises to what extent the results can be transferred to porous artificial leather. In order to discuss the results, it is necessary to consider the elongation properties of the materials. Table 2 shows the elongations at a maximum tensile force as determined in the tensile test according to DIN EN ISO 1421 [29].
In the stiffer direction, the porous artificial leather behaves similar to the standard imitation leather. In the softer direction, however, it resembles the microfiber fabric in terms of elasticity. This eliminates the need for a further test loop. The resulting pressure values of the porous imitation leather are thus expected to be in the midfield of the analyzed range. In order to be able to make a globally valid statement about the loads that occur, a much larger number of test persons must be measured. An examination of several seat substructures and geometries increases the reliability of the values. The accuracy of the templates used can be increased by measuring the test persons in the body scanner, by observing the leg opening angle, and by measuring the spread of fat tissue on the hips and back.
Validation of the substitute test
The aim is to simulate the pre-tension in model 1 on the newly developed test fixture. In the first step, the uniaxial pre-tension is considered. In the following, the pre-tensioned direction is referred to as 11. Direction 22 describes the clamping direction perpendicular to it. The elongation in the 11-direction resulting from pre-tensioning the material by 2 mm in model 1 is independent of the material and amounts to approx. 0.94% if the friction values are taken into account. Since the material in model 1 is elongated in one plane and does not undergo any deflections, a very uniform state of elongation results which can be simulated very precisely within the accuracy range of the material models. The force required to apply the pre-tensioning path is lower in the case of artificial leather, as the material behaves much more elastic than the microfiber fabric.
It is expected that the simulation of the elongation in 11-direction from model 1 on model 2 also requires a material-independent pre-tensioning path. On the other hand, the elongations in the 22-direction are 0% in both models, as the sides are only clamped after the pre-tension has been applied. However, the simulation results show different elongation values in the pre-tensioned direction at different measuring points of the specimen. There are also differences between the materials. The highest elongation occurs at the deflection of the specimen. The elongation measured just above the clamps and at the center of the specimen is lower. This is due to the sliding and static friction that is considered in the FE model and is different for both materials. One explanation would be that the specimen adheres to the deflection edge and is unevenly elongated by friction. This is not based on an error in the simulation, but on a phenomenon that also occurs in reality. The simulation results in a pre-tensioning path of 0.72 mm for the microfiber fabric and 0.80 mm for the porous artificial leather. If the specified elongation of 0.94% is to be generated in model 3 in 11-direction, it is assumed under the premise of a friction-free condition that the same pre-tensioning path as in model 2 is necessary due to the constant specimen geometry. The directions 11 and 22 must behave exactly the same due to the symmetrical specimen geometry. Only the forces to be applied are different in the 11 - and 22-directions due to the unequal stiffness behavior within a material. In the case of the microfiber fabric, the increase in force between the uni- and biaxial stress states is lower than in the case of the artificial leather. The reason for this is the greater difference in stiffness between the two sides of the material and the pre-tension of the stiffer side in the uniaxial state. The difference in the force required for pre-tensioning can also be observed in reality on the device. As already described, in reality the pre-tensioning path is set via a compressed air cylinder. The influence of the material on the pre-tension force can be validated by adjusting the pressure. To adjust the biaxial state, a higher pressure and thus a higher pre-tension force is required than to realize the uniaxial state.
By including the friction in the simulation, it can be seen that the pre-tensioning paths required to achieve elongation in 11 are slightly higher for both materials. The pre-tensioning path in 11-direction, and thus also in 22-direction due to the biaxial tensioning, for the microfiber fabric increases from 0.72 mm to 0.75 mm. An increase of 0.06 mm to a value of 0.86 mm can be observed for the artificial leather. Furthermore, a deviation of the elongations in the 22-direction is recognizable. The reason for this is the deflection of the specimen and the degree of accuracy of the material models. In addition, element size, element selection, load application speed at respective system damping, and mass scaling to reduce the computing time have an influence on the accuracy of the simulation. The elements used in the evaluation range or on the planar support surface (see Figure 3) have an edge length of 1 mm. In the deflection area at the edges of the device, these are slightly less than 1 mm due to bending. The elongations resulting from pre-tension pre-tensioning in 11 and 22 for both materials are illustrated in Figure 7. The deviation in the elongation of the 11-direction from the 22-direction for the microfiber fabric is approx. 3% and for the artificial leather is approx. 1%.
Influence of deflection on the resulting dimensionless elongation (–) after pre-tensioning in the biaxial state (model 3).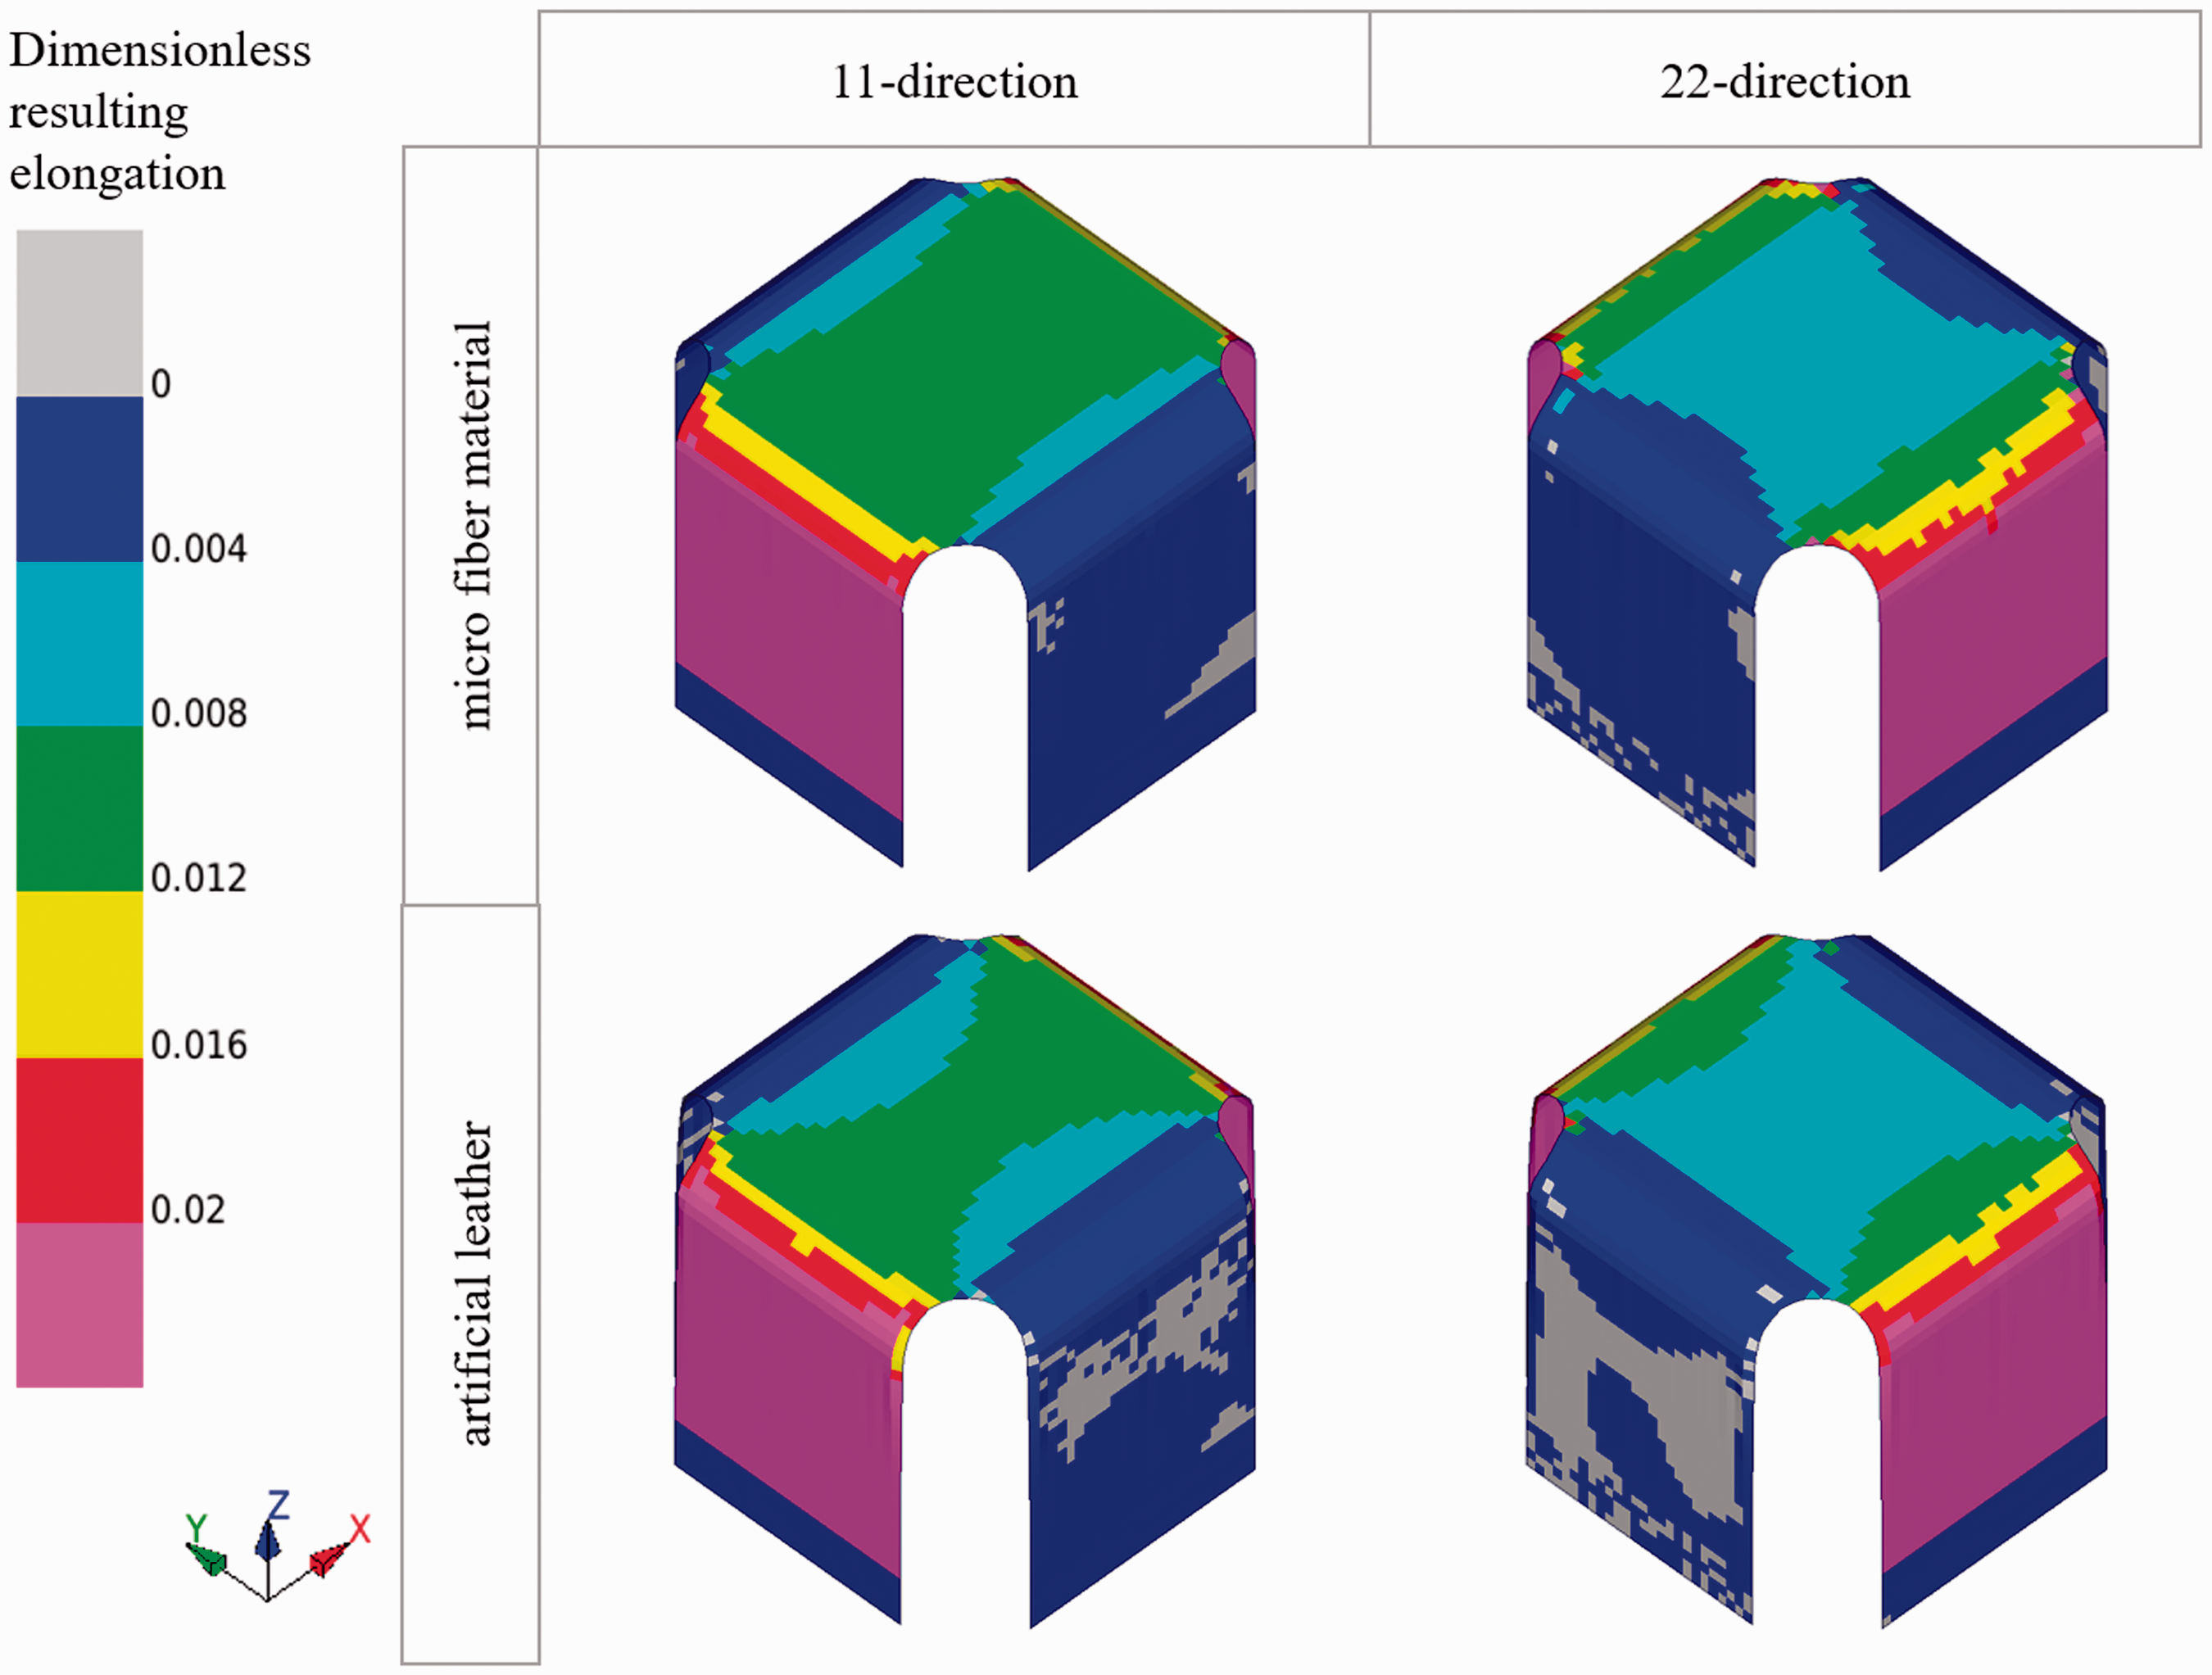
The stress state of models 1, 2, and 3 is evaluated. The following figures show the simulated sink-in depths (Figure 8) and the elongations (Figure 9) in 11- and 22-directions generated at the vertex of the indentor as examples for the pressure conditions 1, 2, and 3 in N/cm2. As simulation result, the pressure as well as the resulting elongation are output in an area of 100 mm2 around the vertex as well as in an area of 20 mm2. This is particularly relevant for the evaluation of models 2 and 3. All pressures shown below refer to the small area because in reality pressure peaks occur at the edges of the indentor due to boundary effects. In the small area, which is also measured in CT, steady-stress curves can be assumed. If now the averaged elongation over the entire indentor surface is evaluated, the real elongation state occurring at the vertex is not described. Due to the edge effects, this value is much higher, for the same sink-in depth, than in the small area.
Calculated sink-in depth in mm for three indentor pressures in N/cm2: (a) model 1: uniaxial pre-tension, (b) model 2: uniaxial pre-tension with subsequent biaxial clamping, and (c) model 3: biaxial pre-tension. Calculated dimensionless elongation for three indentor pressures in N/cm2: (a) model 1: uniaxial pre-tension, (b) model 2: uniaxial pre-tension with subsequent biaxial clamping, and (c) model 3: biaxial pre-tension.

The results (Figures 8(a) and 9(a)) show a higher resulting elongation in the 22-direction for model 1. This is due to the shorter free clamping length in this direction. In the case of a symmetrical specimen as in model 2, a different behavior is expected. The reason for this is that the total elongation in 11-direction is composed of the pre-tension elongation as well as the elongation due to sinking in of the indentor. In the 22-direction, only the pre-tension is active due to sinking in. In model 1, this pre-tension is higher in 22-direction than in 11-direction due to the shorter initial length. The elongation in the 11-direction is very much lower that the value of 22 is not exceeded even by summing up the pre-tension elongation. Following the evaluation of model 1, the load condition of model 2 (Figures 8(b) and 9(b)) is analyzed. The pre-tension condition of xv = 0.75 mm and thus an elongation of ɛ11 = 0.0094 in 11-direction is simulated for the microfiber fabric. For artificial leather, xv yields 0.86 mm, as already described. The objective is to determine the pressure or sink-in depth of the indentor at which the resulting elongation at the vertex of model 2 corresponds to that of model 1. In model 2, the symmetrical specimen geometry results in lower elongations in the 22-direction than in the 11-direction. When the indentor sinks in, the same elongations occur in both specimen directions. Due to the pre-tension in one direction, the value is higher by this pre-tension elongation in the 11-direction. In the last step, model 3 is validated and evaluated analogously to the procedure described for model 2. In order to achieve the target elongations from model 1, the sink paths (Figure 8(c))/pressures (Figure 9(c)) are necessary at a pre-tension of 0.86 mm for artificial leather and 0.75 mm for the microfiber fabric.
In the following, the comparison of the simulation results of models 1, 2, and 3 with reality will be discussed. As already mentioned, the reliability of model 1 is checked by detecting the pressures as a function of the sink-in depth on the real substitute test. This refers to the substitute test on a 1:1 scale. The measured values compared to the simulated values for models 1, 2, and 3 are presented in Figure 10. The verification of the simulation results for models 2 and 3 is carried out analogously to model 1 by recording pressure–displacement curves. The measured values are analyzed for model 3 at the pre-tension path of 0.72 mm (material 1) and 0.80 mm (material 2) determined in the simulation. For model 2, the pre-tension paths are 0.75 mm (material 1) and 0.86 mm (material 2). The load is then applied by the test indentor. Since in reality the resulting elongations cannot be measured, only the comparison of the resulting pressures is made as a function of the sink-in depth.
Comparison of measured pressure in N/cm2 over sink-in depth in mm between test and simulation: (a, top) model 1: microfiber material, (a, bottom) model 1: artificial leather; (b, top) model 2: microfiber material, (b, bottom) model 2: artificial leather; and (c, top) model 3: microfiber material, (c, bottom) model 3: artificial leather.
When evaluating the results, the inaccuracy of the simulation as well as the measurement uncertainty of the real tests must be taken into account. With regard to the simulation, it should be noted that this is a purely elastic simulation model. The material models used have a limited degree of accuracy. In addition to the points mentioned above, the size and type of the elements, the computing time, and the type of damping functions used have an influence. At all points mentioned, the aim was to achieve the best possible representation of reality. However, this is always an idealization and a compromise if a still reasonable calculation time is to be maintained. Also the real measuring device shows a certain measurement inaccuracy of the technical systems. In addition, the human error in clamping the specimen shall be taken into account. The error in cutting the specimen has been minimized by a laser-controlled cut. It is important to observe the cutting direction. In summary, it should be noted that the results show good agreement between the FE models and the values measured in reality. It can therefore be assumed that all the models constructed represent reality within the framework of the inaccuracies already mentioned.
Summary and outlook
In summary it can be said that:
the load device developed is a good simulation of reality. This applies within the framework of the boundary conditions defined for the design, the inaccuracies of the FE simulation, and inaccuracies of the measurement systems the required resolution of 5 µm is achieved by CT. An investigation of the structure of the surface materials at different elongations can be done with sufficient accuracy the biaxial pre-tension state (model 3) can set in a very well reproducible way; this is defined as the optimal test condition for the CT scan.
In further research work, the structure of the two materials must be scanned and evaluated at different elongations in order to show an exact relationship between the elongation and the change in structural parameters. In the future, it should also be possible to apply the compressive load automatically with simultaneous measurement of the compressive force. For this purpose, a device already developed by the research institute “Deutsche Institute für Textil- und Faserforschung Denkendorf (DITF)” is to be used, which enables the application of the pressures as well as their detection within the CT.
Footnotes
Declaration of conflicting interests
The author(s) declared no potential conflicts of interest with respect to the research, authorship, and/or publication of this article.
Funding
The author(s) disclosed receipt of the following financial support for the research, authorship, and/or publication of this article: The author would like to thank the BMW AG, Munich, for financial support.