
Abstract
Surface texture plays an important role in expressing the tactile sensation of leather. The purpose of this study was to develop a combinational panel of physical properties that express the tactile sensations of coarse/fine, uneven/flat, soft/hard, sticky/slippery, and moist/dry. Thirteen synthetic leather samples were fabricated from polyurethane, and eight physical properties were measured as storage modulus, loss modulus, surface roughness, waviness, mean frictional coefficient, apparent contact angle, contact angle hysteresis, and urethane thickness. Thirty adult women performed sensory evaluation of the five tactile sensations by using a semantic differential method based on a five-point scale. The tactile sensation–physical property model for each tactile sensation was explored with logistic regression analysis. Receiver operating characteristic analysis showed that the proposed models based on multiple physical properties clearly distinguish the tactile sensations with higher sensitivity and specificity compared to using a single physical property. The dynamic viscoelasticity contributed to all the tactile sensations when polyurethane was used as synthetic leather. Additionally, the difference of five tactile sensations might be caused by the surface roughness, the mean frictional coefficient, and the polyurethane thickness.
Introduction
The surface structures of synthetic leather are used to design its texture, control its tactile sensation, and improve its water repellency and antifouling ability [1]. The materials used in commercially available synthetic leather are polyurethane and polyvinyl chloride with the former having been introduced more recently [2]. The advantages of the former are: (i) that it is relatively easy to mold micron-sized patterning on polyurethane and (ii) polyurethane-formed synthetic leather offers a soft tactile sensation because it has excellent viscoelasticity; meanwhile, polyvinyl chloride is durable but difficult to mold micron-sized patterning on. Synthetic leather is manufactured using either a dry or a wet process. The dry process offers the advantage of forming various textures because various types of release paper can be used for it; wallets and bags are usually manufactured using the dry process. Release paper is an embossed-shaped piece paper which acts as a template in the production of coated fabrics by transferring the various textures. Therefore, the focus of the present research was polyurethane-based synthetic leather formed by the dry process.
Both designers and engineers are engaged in designing synthetic leather, including the tactile sensation of its surface. However, a quantitative method for designing the tactile sensation is yet to be established. The relationship between the tactile sensation and the physical properties of synthetic leather remains unclear. The mechanism for perceiving tactile sensation has been studied in the field of physiology. Okamoto et al. summarized tactile perception as the five dimensions of (i) fine roughness, (ii) macroscopic roughness, (iii) softness/hardness, (iv) friction, and (v) warmth/coldness [3]. When fingers trace the surface of a material, its fine roughness is perceived by the Pacinian corpuscles of the skin; the resolution extends from a few microns to the span of the epidermal ridge [4–7]. Macroscopic roughness is perceived by the skin's Merkel's disks; this resolution exceeds the span of the epidermal ridge [8–10]. Softness/hardness is perceived by skin deformation and kinesthetic sensations [11], friction is perceived by shear deformation of the skin [12–14], and warmth/coldness is perceived by cold and warm points distributed over the skin [15].
To design the tactile sensation of synthetic leather, the relationship between tactile sensation and physical properties must be quantified. For evaluation by touch, a method for characterizing the physical properties of fabrics has been studied [16–18]. The use of physical properties might be effective for quantifying the tactile sensation caused by the support layer of synthetic leather such as that used for fabrics. However, it is difficult for quantifying the tactile sensation caused by a combination of surface texture and viscoelastic material. For plastic film surfaces, the relationship between tactile sensation and physical properties (e.g. friction, surface roughness (Sa), Young's modulus) has been evaluated [19–21]. For leather, how its surface texture influences tactile sensation and grip comfort has been reported in the context of a natural-leather steering wheel [22]. Previously, the relationships between tactile sensation and the physical properties of viscoelasticity and contact angle hysteresis (CAH) have been reported [23]. However, the relationship between tactile sensation and physical properties remains poorly understood and is difficult to measure because the tactile sensation caused by the combination of surface texture and viscoelastic material have not been studied. Therefore, it is very important to identify how each physical property influences tactile sensation.
The purpose of the present study was to propose models that describe each tactile sensation of synthetic leather by several physical properties. Based on the explored tactile sensation–physical property models, the overall relationship between tactile sensation and physical properties was evaluated. To achieve this purpose, 13 samples of polyurethane-based synthetic leather formed by the dry process were fabricated. For each sample, the following eight physical properties were measured: (i) storage modulus (E′), (ii) loss modulus (E″), (iii) Sa, (iv) waviness (Wa), (v) mean frictional coefficient (MIU), (vi) apparent contact angle (θ′), (vii) CAH, and (viii) polyurethane thickness (D). Then, using 30 adult women as the subjects, five tactile sensations were evaluated in sensory-evaluation experiments. Next, logistic regression analysis to explore the tactile sensation–physical property models was performed [24,25], using the p-values as indicators to select the best model from the multiple explored models. Finally, the model performance was assessed by receiver operating characteristic (ROC) analysis [26].
Materials and methods
Synthetic leather samples
Thirteen samples of synthetic leather were fabricated using polyurethane (Rezamin NE-8811 and Seikaseven NET-5794 Black; Dainichiseika Color & Chemicals Mfg. Co., Ltd, Japan) on polyester base fabric (twill woven fabric, thickness: 0.87 mm, Kinkivinyl Co., Ltd, Japan). The textures of the samples were selected considering a large sales volume and with the expectation of different tactile sensations. The textures were enamel, cordovan, sheep A, sheep B, lamb A, lamb B, elk A, elk B, smooth, fine grain, cow, textile, and nubuck. As a skin layer, the polyurethane was coated on release paper (DN-TP; Dai Nippon Printing Co., Ltd, Japan) using a wire bar (No. 12; Daiichirika Co., Ltd, Japan). The skin layer was dried in an oven (PVHC-212; Espec Co., Japan) at 60℃ for 15 min, an adhesive layer was formed on the dried skin layer by coating more polyurethane using the wire bar, and the base fabric was pressed onto the adhesive layer. The adhesive was dried in the oven at 80℃ for 15 min. Finally, the release paper was peeled off to reveal the synthetic leather sample formed by the polyurethane and base fabric.
Sensory evaluation
Prior to the sensory-evaluation experiments, the study protocol was approved by the Ethics Committee of Shinshu University (No. 163). The subjects were informed sufficiently both verbally and in writing of the purpose of the sensory evaluation, and all gave written informed consent. The sensory evaluation was performed using 30 adult women (mean ± standard deviation (SD) = 22.3 ± 1.1 yr) as the subjects. They were selected because the consumers to buy leather products frequently than men were focused on. A commercially available iPhone case (polyurethane, 70 mm × 140 mm × 4 mm; Highend Berry; GBS Co., Ltd, Japan) was used for the sensory evaluation because of its familiarity for most of the subjects. The synthetic leather samples (140 mm × 150 mm) were attached to the iPhone case with double-sided adhesive tape (no. 5010, thickness: 0.17 mm; Nitoms, Inc., Japan) and a mobile phone was inserted into the case. The target experimental environment was 23 ± 2℃ and 50 ± 4% Relative Humidity (RH) based on ISO139 [27], which are the standard evaluation conditions for fibers.
Definition of tactile sensations.
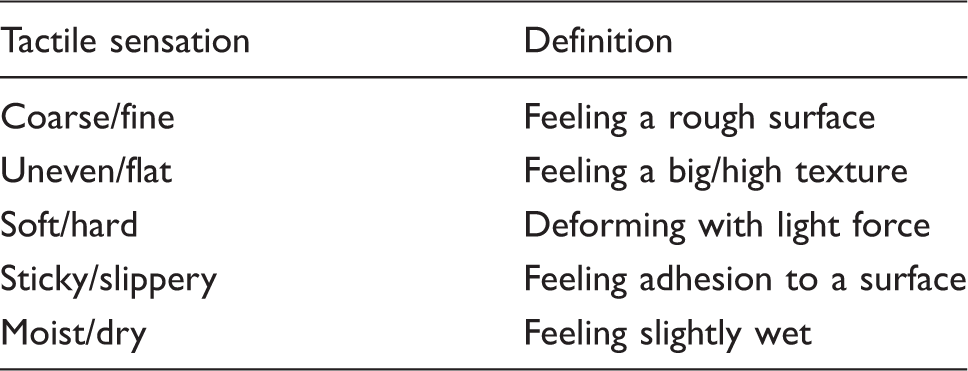
The sensory evaluation was performed with a semantic differential method using a five-point scale (+2 to −2). Figure 1 shows a photograph of sensory evaluation being performed on a synthetic leather sample. To minimize any stimulus other than tactile sensation, each subject sat on a chair and wore an eye mask. Before the sensory evaluation, she washed her hands. She took the iPhone case covered with the synthetic leather sample from the desk, rubbed it in a circle (roughly the size of a two-euro coin) with the index finger of her dominant hand for roughly 5 s, and then gave her evaluation orally, this being recorded by the experimenter. The evaluation time was determined from previous research into the cognitive processes of human tactile sensation [28]. The time for sensory evaluation was about 3 min for each sample of synthetic leather (39 min in total).
Sensory evaluation using sample covering an iPhone case.
Physical properties
The storage modulus (E′) and the loss modulus (E″) were measured with a compression method using a dynamic viscoelasticity measuring tool (resolution: 1 Pa; temperature: 23.0℃; Rheogel-E4000; UBM Co., Ltd, Japan). For the preparation, one synthetic leather sample (thickness: 0.913-0.995 mm) was cut into a disk shape with a diameter of 12 mm. The measurement frequency was set to one of 0.1, 1, 10, and 100 Hz, and the average storage and loss moduli were obtained by measuring three times.
The arithmetic mean Sa of the two-dimensional plane (x and y directions) was measured using a laser microscope (resolution: 0.12 μm (x and y directions), 0.01 μm (z direction); OLS4000; Olympus Corp., Japan). The threshold between fine roughness and macroscopic roughness was taken as 800 μm as determined from previous research that the threshold levels of fine and macroscopic roughness are similar to the pitch of the epidermal ridge [3,29]. Roughness below this threshold was deemed Sa, and roughness above threshold was deemed Wa. Nine consecutive images were measured to obtain an average value.
The MIU was measured using a surface friction measuring device (NT-01; Kato Tech Co., Ltd, Japan). The MIU is proposed as the average friction coefficient per unit length using a finger imitating pickup (mass: 26.2 g). The pickup was a 10-mm square stainless plate with 20 piano wires of 0.5 mm diameter. The measurement length was 100 mm and the speed of movement was 10 mm/s. The MIU is expressed as a dimensionless quantity, and the average of MIU was obtained by measuring five times.
The apparent contact angle (θ′) and CAH were measured using a contact angle analyzer (resolution: 1°; DM-701; Kyowa Interface Science Co., Ltd, Japan). The apparent contact angle corresponds to the stable equilibrium state [30]. The CAH is defined as the difference between the advancing and receding contact angles [31]. The sessile-drop method was used to measure the apparent contact angle. The water volume was set to 2 µL, which is a frequently used volume in this method [32]. The extension-and-contraction method was used to measure the CAH. The water volume was set to 30 µL, which was selected to satisfy the following two conditions: (i) minimize the deformation due to gravity and (ii) increase the capillary force enough to be stable on the measured surface. The averages of θ′ and CAH were obtained by measuring each five times.
The thickness of each synthetic leather sample (D) was measured using a digital scale (pressure: 15.7 kPa; TH-104; Tester Sangyo Co., Ltd, Japan) that was used to measure thin samples. The thickness of the polyurethane was calculated by subtracting the thickness of the base fabric from the total thickness. The average value was obtained by measuring five times.
Regression analysis
The sensory-evaluation and physical property results were analyzed by one-way analysis of variance (ANOVA). Next, each physical property was verified by calculating its skewness and kurtosis from a histogram. The physical properties were transformed logarithmically when normality was not recognized. The physical properties were converted into standard normal distributions because their units differ. To avoid collinearity among variables, the variance inflation factor (VIF) was calculated with multiple regression analysis using the physical properties as independent variables and the tactile sensations as dependent variables [33]. The VIF is a detection indicator of multicollinearity among independent variables if its VIF exceeded 10.
To prepare the tactile sensation data, the sensory-evaluation results were divided in two groups, namely those of a positive reply (+2 or + 1) as 1 and those of a negative reply (−2 or −1) as 0.
Each tactile sensation–physical property model describing a tactile sensation with a combination of physical properties was explored using logistic regression analysis (IBM SPSS Statistics 24; IBM Japan, Ltd, Japan; p < 0.05) [34]. The tactile sensation outcome variables were 0 for “no” and 1 for “yes.” Five tactile sensations were selected as the dependent variables, and the physical properties were set as independent variables. First, the physical property with the minimum p-value was selected, and the tactile sensation–physical property model was generated with backward elimination. The influence of a variable on the likelihood of detecting the tactile sensation was expressed as the odds ratio (OR) and 95% confidence interval.
Finally, the performance of the tactile sensation–physical property model was assessed using a discrimination test combined with ROC analysis. ROC curves were generated to verify the discriminatory power of the tactile sensation. An ROC curve expresses a relationship between sensitivity and specificity [35,36]. The areas under the curves (AUCs) were calculated to provide an overall summary of the diagnostic accuracy of the tactile sensation. The diagnostic performance was classified as poor (0.50 ≤ AUC < 0.69), good (0.70 ≤ AUC < 0.89), or excellent (0.90 ≤ AUC < 1). The data are expressed as mean ± SD unless noted otherwise.
Results
Sensory evaluation
Figure 2 shows the height profiles of the synthetic leather samples observed with a laser microscope; white indicates a convex area and black indicates a concave area. Figure 3 shows the tactile sensation evaluation results; the scores were −0.3 ± 1.3 (coarse), −0.9 ± 0.8 (uneven), −0.1 ± 0.5 (soft), 0.0 ± 1.2 (sticky), and 0.3 ± 1.0 (moist). The results of the tactile sensation variance analysis were F (12, 377) =60.56, p < 0.05; F (12, 377) = 19.88, p < 0.05; F (12, 377) = 7.47, p < 0.05; F (12, 377) = 42.81, p < 0.05; and F (12, 377) = 38.63, p < 0.05. Significant differences were observed for all the tactile sensations.
Images of synthetic leather surfaces using a laser scanning microscope: (a) enamel, (b) cordovan, (c) sheep A, (d) lamb A, (e) lamb B, (f) sheep B, (g) elk A, (h) smooth, (i) elk B, (j) fine grain, (k) cow, (l) textile, (m) nubuck, and (n) iPhone case. Measured results of tactile sensations of 13 synthetic leather samples using semantic differential scale method.

Physical properties
Figure 4 shows the measured results for the storage and loss moduli. The correlation coefficient at the measurement frequency of 10 Hz was 0.48, and those for 0.1, 1.0, and 100 Hz were 0.95, 0.93, and 0.77, respectively. For the measurement frequency of 10 Hz, the storage and loss moduli were 66 ± 8 kPa and 20 ± 4 kPa, respectively. The ANOVA results for the storage and loss moduli were F (12, 26) = 7.59, p < 0.05 and F (12, 26) = 3.79, p < 0.05, respectively. Significant differences among samples were observed in both moduli.
Double logarithmic diagram of dynamic viscoelasticity with measurement frequency (a) 0.1 Hz, (b) 1 Hz, (c) 10 Hz, and (d) 100 Hz.
The Sa and the Wa of 13 synthetic leather samples were 4.5 ± 3.2 μm and 4.2 ± 8.6 μm, respectively (Figure 5), whereas those of the standard sample (i.e. the iPhone case) were 2.7 and 0.8 μm, respectively. The MIU, the apparent contact angle, the CAH, and the polyurethane thickness were 0.37 ± 0.21, 88 ± 8°, 72 ± 10°, and 0.08 ± 0.02 mm, respectively (Figure 6). The ANOVA results were F (12, 52) = 217.46, p < 0.05; F (12, 52) = 58.87, p < 0.05; F (12, 52) = 8.27, p < 0.05; and F (12, 52) = 15.77, p < 0.05, respectively. Significant differences among the samples were also observed for these physical properties.
Measured results of surface roughness and waviness. Measured results of (a) mean frictional coefficient, (b) wettability, and (c) polyurethane thickness.

Correlation coefficients between tactile sensations and physical properties.
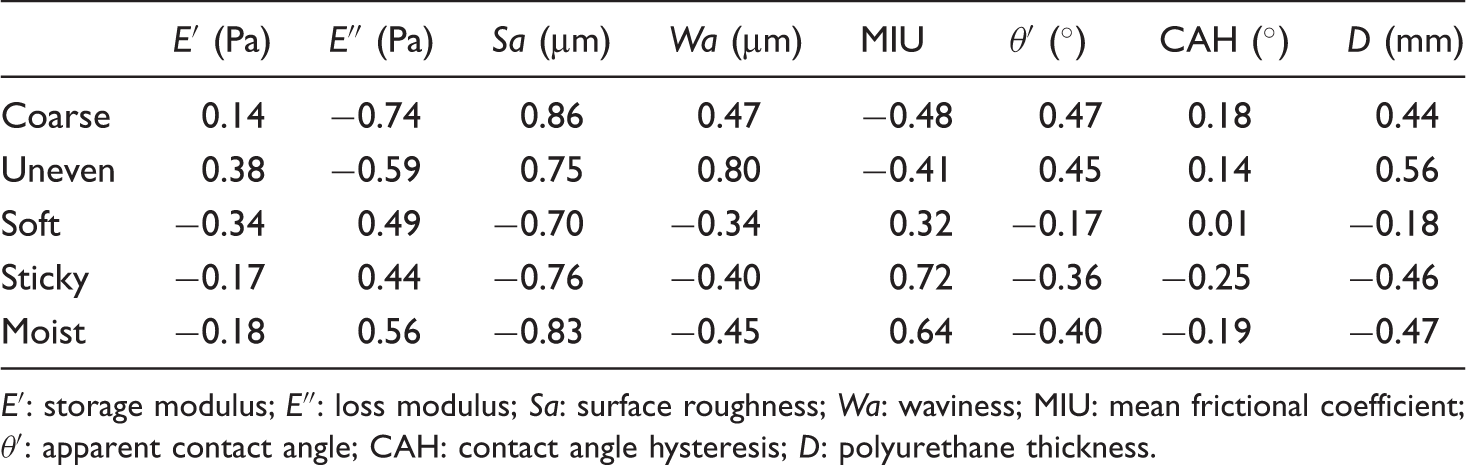
E′: storage modulus; E″: loss modulus; Sa: surface roughness; Wa: waviness; MIU: mean frictional coefficient; θ′: apparent contact angle; CAH: contact angle hysteresis; D: polyurethane thickness.
Regression analysis
Logistic regression analysis was performed by backward elimination. Seven physical properties excluding Wa from all the physical properties were set as independent variables. A measurement frequency of 10 Hz was adopted for E′ and E″. Tactile sensation–physical property models for the five tactile sensations were selected under p < 0.05 as follows:


Results of odds ratio and 95% confidence interval by logistic regression analysis for each tactile sensation.

E′: storage modulus; E″: loss modulus; Sa: surface roughness; MIU: mean frictional coefficient; D: polyurethane thickness.
Figure 7 shows the results of the ROC analysis of the five tactile sensation–physical property models. The diagnostic performance was excellent for coarse, good for uneven, sticky, and moist, and poor for soft. The AUCs of the tactile sensation–physical property models were 0.698–0.912 (Table 4). For all the tactile sensations, the AUCs of the tactile sensation–physical property models were higher than those obtained using a single physical property.
Receiver operating characteristic (ROC) analysis of tactile sensations: (a) coarse, (b) uneven, (c) soft, (d) sticky, and (e) moist. Results of the areas under the curves and confidence interval by logistic regression analysis for each tactile sensation.

Discussion
Different surface textures were formed between 13 synthetic leather samples (Figure 2). Significant differences were observed by ANOVA between synthetic leather samples for the sensory evaluation of all tactile sensations as coarse, uneven, soft, sticky, and moist (Figure 3). These results indicated that the selected 13 synthetic leather samples had different tactile sensations.
Prior to measuring the dynamic viscoelasticity as the storage and loss moduli, its measurement frequencies were examined. The correlation coefficient between the storage modulus and the loss modulus showed the minimum value of 0.48 when the measurement frequency was 10 Hz (Figure 4(c)). Storage modulus reflects the elasticity of the material, and the loss modulus reflects the viscosity of the material. If the ratio between elasticity and viscosity (tan δ ( = E″/E′)) is constant, the dynamic viscoelasticity is similar. When the measurement frequency was set to 10 Hz, the correlation between the storage modulus and the loss modulus was the lowest, and thus this frequency was used for the measurement (Figure 4).
The surface structure of the iPhone case used as the standard sample had relatively small Sa and Wa (Figures 2 and 5). Significant differences were observed by ANOVA between synthetic leather samples for the physical properties as the MIU (Figure 6(a)), the apparent contact angle (Figure 6(b)), the CAH (Figure 6(b)), and the polyurethane thickness (Figure 6(c)). Therefore, these results indicated that the 13 samples had different physical properties.
Prior to exploring the tactile sensation–physical property models, the normality of the physical property data was verified. To adjust a normal distribution, the data of Sa and the MIU were transformed logarithmically.
To avoid multicollinearity among the independent variables in the logistic regression analysis, the VIF for each tactile sensation was calculated among the physical properties. The VIFs for viscosity, E″, and Wa, exceeded 10, showing high multicollinearity. It has been reported that viscosity contributes to the tactile sensation of leather [23]. Therefore, Wa was removed from the physical properties in the present study.
From the logistic regression analysis, the tactile sensation–physical property models were explored for the five tactile sensations using several physical properties. The ROC analysis revealed that all the tactile sensation–physical property models using multiple physical properties showed higher AUC values than those using a single physical property (Table 4). The AUC for soft was smaller than that of the other tactile sensation–physical property models. This result agrees well with the tactile sensation evaluation results that show that the difference in tactile sensations for soft was smaller than the differences in the other tactile sensations (Figure 3). The ROC analysis demonstrated that the proposed five tactile sensation–physical property models offer higher discriminatory power than does using a single physical property.
Next, the relationship between tactile sensation and physical properties based on the explored tactile sensation–physical property models were examined. The dynamic viscoelasticity contributed to all the tactile sensations of the synthetic leather samples (equations (1) to (5)). We reason that this was because polyurethane has a relatively high viscosity and elasticity among resins.
For coarse, the coefficient of Sa exceeded that of the polyurethane thickness (equation (1)). This result showing that Sa has more influence than does the polyurethane thickness agrees with previous findings [3].
For sticky, the Sa contributed negatively to the tactile sensation (equation (4)). The result suggests that the low Sa induces sticking to the fingers (Table 2). This phenomenon may be interpreted as low Sa increasing the van der Waals forces, given that the area of contact with the finger increases with a flat surface. This characteristic agrees with previous findings that the coarser the surface, the less it adheres to the fingers [37–40].
For moist, all the physical properties such as the elasticity, the viscosity, and the Sa were common with sticky (equation (5)). These results agree with previous findings that both moist and sticky are classified into friction and difficult to separate [3]. However, moist and sticky can be distinguished quantitatively if the proposed tactile sensation–physical property models are used.
Finally, we reason that the apparent contact angle and the CAH do not contribute to the tactile sensation compared to the other physical properties.
Conclusion
The focus of this work was to develop a combinational panel of physical properties that express the tactile sensations of coarse/fine, uneven/flat, soft/hard, sticky/slippery, and moist/dry. To achieve this purpose, the eight physical properties of storage modulus, loss modulus, Sa, Wa, MIU, apparent contact angle, CAH, and urethane thickness were measured using 13 synthetic leather samples. As a result, a tactile sensation–physical property model was explored for each tactile sensation. The proposed tactile sensation–physical property models using multiple physical properties clearly distinguished the tactile sensations with higher sensitivity and specificity than using a single physical property. This study revealed that tactile sensations can be distinguished by the type of physical property or the values of the coefficients between tactile sensations. Additionally, the dynamic viscoelasticity contributes to all the tactile sensations when polyurethane was used for synthetic leather. In particular, it was considered that the difference of five tactile sensations might be caused by the Sa, the MIU, and the polyurethane thickness.
The present findings might help improve the quality of products that are made of synthetic leather. In future work, it would be interesting to assess the extent to which the present technique is applicable to other base materials of synthetic leather, such as polyvinyl chloride.
Footnotes
Declaration of conflicting interests
The author(s) declared no potential conflicts of interest with respect to the research, authorship, and/or publication of this article.
Funding
The author(s) received no financial support for the research, authorship, and/or publication of this article.