
Abstract
Polyacrylonitrile can be used as a base material for thermochemical conversion into carbon. Especially nanofiber mats, produced by electrospinning, are of interest to create carbon nanofibers. Optimal stabilization and carbonization parameters, however, strongly depend on the spatial features of the original material. While differences between nano- and microfibers are well known, this paper shows that depending on the electrospinning method and the solvent used, considerable differences between various nanofiber mats have to be taken into account for the optimization of the stabilization conditions. Here, we examine for the first time polyacrylonitrile nanofiber mats, electrospun with wire electrospinning from the low-toxic dimethyl sulfoxide as a solvent, instead of the typically used needle electrospinning from the toxic dimethylformamide. Additionally, we used inexpensive polyacrylonitrile from knitting yarn instead of highly specialized material, tailored for carbonization. Our results show that by carefully controlling the maximum stabilization temperature and especially the heating rate, fully stabilized polyacrylonitrile fibers without undesired interconnections can be created as precursors for carbonization.
Keywords
Introduction
Electrospun polyacrylonitrile (PAN) nanofibers are interesting precursors for carbon nanofibers (CNFs) due to the small diameters of a few hundred nanometers which can be reached by electrospinning, depending on the spinning and solution parameters [1]. Typically, such nanofibers contain only few structural imperfections and are highly oriented [2], resulting in higher mechanical strength of the CNFs compared to common microfibers. Creating mechanically strong fibers, however, necessitates optimized stabilization and carbonization parameters [3].
Needle electrospinning is an easy way to create nanofiber mats. Other variations of electrospinning, such as drum or wire electrospinning, can even be upscaled to industrial production. This allows for the production of CNFs applicable to increase the mechanical properties of composites [4], the electrical properties of batteries [5,6] or super-capacitors [7], etc.
Since PAN is a typical precursor for CNFs, several articles deal with the stabilization and carbonization process and describe the thermochemical conversion of PAN into carbon. Generally, the oxidative stabilization, i.e. the thermal treatment in air, is regarded as a combination of cyclization, dehydrogenation, oxidation, aromatization, and crosslinking reactions [8]. The ideal temperatures for these processes are widely discussed in literature. Microfibers with diameters of approx. 10 µm are suggested to be stabilized in a temperature range between 200℃ and 300℃, e.g. at 270℃ for high-performance carbon fibers [9], while other publications mention temperatures of up to 400℃ [10]. Finding the optimal balance between not burning the fibers and maintaining a sufficiently quick chemical reaction to allow complete stabilization is crucial even for microfibers.
For nanofibers, heat transfer processes inside the fibers are significantly quick due to the narrow diameters [11]. This means on the one hand that shorter stabilization times and lower temperatures are required for stabilizing PAN nanofibers; on the other hand, the process parameters have to be adapted even more carefully.
Several approaches can be found in literature. One of the most detailed examinations was performed by Mólnar et al. who prepared PAN nanofibers with a rotating electrode from dimethylformamide (DMF), working with a fixed heating rate of 5℃/min and isothermal treatment at the maximum temperature for 1 h [12]. They concluded that all nitrile groups were eliminated, and full structural conversion had been reached at 265℃, while differential scanning calorimetry (DSC) and color change investigations revealed that the stabilization process was completed below 280℃ since all available exothermic heat was released and all color changes were set.
Another detailed test series was performed by Gu et al. who used the typical needle electrospinning from DMF and tested stabilization temperatures between 200℃ and 270℃, reached with a heating rate of 2℃/min [13]. They concluded that stabilization has already been completed at 250℃ confirmed by Fourier-transform infrared spectroscopy (FTIR) and X-ray diffraction (XRD) data. Additionally, this paper is one of the few which explicitly mentions the undesired conglutinations between overlapping fibers, starting at a temperature of 250℃ and becoming clearly visible at 270℃.
Both aforementioned papers do not take into account the influence of the heating rate. Different heating rates between 1℃/min and 4℃/min in combination with different end temperatures between 180℃ and 270℃ were investigated by Rafiei et al. who also prepared PAN nanofiber mats by needle electrospinning from DMF [14]. They found heating rates above 2℃/min resulting in brittle products and defined 270℃ as the ideal end temperature with a dwell time of 1–2 h. Here, no undesired fiber conglutinations are visible for an end temperature of 270℃, approached with a heating rate of 1℃/min.
Other groups stabilize electrospun PAN nanofibers with similar, but not identical parameters as described before. The following examples are all based on needle electrospinning from DMF. Gergin et al. found 250℃ to be the optimum temperature in combination with isothermal treatment for 3 h, while even 300℃ was insufficient to eliminate all C≡N triple bonds [15]. Similar to Alarifi et al. who performed stabilization at 270℃ for 1 h, no heating rate is given [16]. In the latter paper, however, fiber interconnections are visible in the scanning electron microscopy (SEM) images after carbonization. This is also the case in the study of Arbab et al. who used a heating rate of 5℃/min to approach final temperatures between 240℃ and 300℃; for a temperature of 270℃, the undesired conglutinations are also visible here [17]. The same effect is visible in the paper by Dhakate et al., stabilizing at temperatures between 250℃ and 320℃ and showing molten fibers after stabilization at 275℃ [18].
Interestingly, this was not reported by Arshad et al., using stabilization for 1 h at 300℃ after approaching the maximum temperature with 5℃/min [19] nor by Zhou et al. using a heating rate of 2℃/min to reach a maximum temperature of 280℃ where the samples were stabilized for 3 h [20].
In several other papers, it is not possible to assess whether these undesired conglutinations due to fiber melting are established. Ma et al., e.g., tested temperatures between 200℃ and 340℃ with a heating rate of 1℃/min and concluded that stabilization is finished between 280℃ and 300℃. They also mention the necessity to fix at least one of the nanofiber mat dimensions by applying a weight or another mechanism during stabilization to avoid shrinkage [21]. Lee et al. stabilized in a six-area furnace from 150℃ to 300℃ without mentioning the heating rate or a possible melting of the fibers [22]. Su et al. also used a six-area furnace applying temperatures between 150℃ and 300℃ without defining the heating rate; they found strong bead formation which is unusual for spinning from DMF [23]. Wu and Qin used a heating rate of 4℃/min and found stabilization after isothermal treatment for 1 h at 250℃ and higher temperatures to be almost complete [24]. After stabilizing for 2 h at a temperature of 280℃, Wu et al. regarded the dehydrogenation as almost complete due to FTIR, X-ray photoelectron spectroscopy (XPS), and color measurements [8]. Li and Adanur also used a temperature of 280℃ with a heating rate of 1℃/min [25], while Zhang et al. found a transition temperature of approx. 300℃, as revealed by DSC, thermogravimetric analysis (TGA), and FTIR [26]. Cipriani et al. used a TGA with a significantly higher heating rate of 10℃/min to reach a maximum temperature of 250℃ [27], similar to Esrafilzadeh et al. who used a DSC with a heating rate of 5℃/min to reach temperatures between 170℃ and 250℃. According to their results, stabilization is not completed at this temperature [28].
Only few papers are based on different electrospinning techniques or different solvents. Besides the aforementioned paper by Mólnar et al. about electrospinning with a rotating electrode [12], Kaur et al. also used drum-electrospun fibers which they stabilized at 310℃ for 1 h; the heating rate is not mentioned [29].
Duan et al. [30] as well as Qin [31] used dimethylacetamide (DMAc) as solvent instead of DMF, while the first suggested that 1 h at 260℃ results in complete stabilization, the latter found 250℃ to be sufficient for complete cyclization and 5℃/min to be the optimal heating rate, although SEM images show the undesired connections due to melting of the fibers. Finally, Jin et al. used hydrolyzation in NaOH to pre-stabilize electrospun PAN nanofibers which resulted in decreased cyclization temperatures [32].
It should be emphasized that, to the best of our knowledge, stabilization properties of PAN nanofibers were neither investigated for nanofibers electrospun with the wire-based technology nor for fibers electrospun from DMSO solutions before. All aforementioned studies have been performed on nanofiber mats electrospun from different solvents, most of them by a needle-based technology. Additionally, the problem of undesired conglutinations emerging during stabilization, impeding formation of separated CNFs after carbonization, is often either neglected or not investigated in recent scientific literature.
This is why in our paper we focus on wire-based electrospinning of PAN nanofibers from DMSO solutions and used SEM images to evaluate possible undesired fiber interconnections. Our study supports other researchers working on stabilization of PAN needleless-electrospun nanofibers from PAN/DMSO solutions by underlining that this process is possible and providing a parameter set which can be used for this purpose.
Experimental
Electrospinning was performed using the wire-based nanospinning machine “Nanospider Lab” (Elmarco, Czech Republic), applying a high voltage of 80 kV, a nozzle diameter of 0.9 mm and a carriage speed of 150 mm/s during a spinning time of 30 min. The distance between the electrode wires was set to 240 mm (the maximally possible value), the relative humidity in the spinning chamber was 32% and the temperature during spinning was 22℃.
The PAN solution for spinning has been prepared with 14% polymer content in DMSO (dimethyl sulfoxide min. 99.9%, purchased from S3 Chemicals, Germany) by stirring for 2 h at room temperature. This concentration was found ideal in previous tests to avoid clogging of the nozzle as well as electrospraying instead of electrospinning. A detailed study of the influence of the solid content in the spinning solution as well as other spinning parameters can be found in Sabantina et al. [1]. A typical viscosity of a PAN solution with 14% solid content is in the range of 300–400 mPa·s [33].
For stabilization, a muffle furnace B150 by Nabertherm was used, applying heating rates between 0.5℃/min and 8℃/min. Additionally, samples were put into the already heated oven, resulting in a sudden decrease of the oven temperature by approx. 40℃ and a new increase to the desired temperature during approx. 2.5–3 min; the values thus obtained are referred to as 16℃/min in order to be able to represent them in the heating rate–dependent diagrams.
PAN nanofiber samples were cut from the electrospun mat in dimensions of 50 mm × 50 mm; a frame of 40 mm × 40 mm was marked and used for dimensional measurements, while the “border” was used to fix some of the samples during stabilization by placing a metal frame of sufficient weight on it to maintain the sample dimensions.
For the analysis of the sample dimensions before and after stabilization with different parameters, the program ImageJ 1.51j8 was used. Masses of the samples were measured using an analytical balance (VWR). SEM images were taken by a Zeiss 1450VPSE with a resolution of 5 nm, using a nominal magnification of 5000 × after sputtering 20 nm gold onto the samples under examination. FTIR measurements were performed with an Excalibur 3100 from Varian, Inc., while an sph900 by Color-Lite was used for color measurements. For the DSC measurements, a calibrated DSC Q100 (TA Instruments) was applied, using 5 mg of each sample. The heating rates for the first heating curves shown here are given in the Results and Discussion section. All measurements were repeated three times.
Results and discussion
In a first test series, different maximum temperatures between 120℃ and 300℃ were approached with a heating rate of 2℃/min. Afterward, isothermal treatment was performed for 1 h.
Figure 1 depicts the normalized masses and areas of the samples. It is clearly visible that both values significantly decrease with increasing stabilization temperature. For the masses, large error bars can be recognized for temperatures of 240℃ and above, which is why the values for fixed and unfixed stabilization were averaged. This is most likely due to separated parts of the samples which could not be properly added during weighing since electrostatic interactions with gloves and scales etc. increased more and more for higher stabilization temperatures, resulting in the loss of small sample parts. Although they have been removed from the oven with no visible residues, small broken parts along the edges tend to adhere at the pliers used to put them onto the scale, increasing the risk of losing those parts. In addition, the electrostatic forces between the sample on the sample holder and the surrounding shield of the special accuracy balance can also slightly affect the measurement result. Nevertheless, Figure 1(a) shows a clear trend of the expected increase in mass loss for increasing stabilization temperatures.
Normalized masses (a) and areas (b) of samples stabilized at different end temperatures with identical heating rates of 2℃/min and staying for 1 h at the maximum temperature.
The problem of splitting samples into different parts is even more evident in the normalized areas, where measurements are differentiated between fixed (as described above) and unfixed samples. At all stabilization temperatures, the unfixed samples shrink more than the fixed ones. For the highest temperatures of 280℃ or 300℃, however, the distance between both lines decreases again. This can be explained by the fact that for these temperatures, all of the fixed samples broke partially along the metal mounting frame, resulting in several separated sample parts. We assume that this effect occurred in the early stages of stabilization, so the parts of the samples which were no longer fixed shrank more and thus the normalized areas approached each other.
It should also be mentioned that for the freely shrinking samples, there may be a minimum area reached above 300℃. This was not examined in detail since at 300℃ the samples were increasingly unstable and thus difficult to handle.
The influence of different maximum temperatures has also been investigated by SEM imaging. Figure 2 shows the results for the three temperatures which, according to some literature, are most likely sufficient for complete stabilization, in comparison to the original nanofiber mat.
SEM images of the original PAN nanofiber mat and samples stabilized at different temperatures with and without fixing them. All scales depict a length of 2 µm, the nominal magnification is 5000× in all SEM images shown in this article.
The beads visible here are typical for PAN nanofibers mats electrospun from solutions with relatively low solid content, as it is typical for PAN dissolved in DMSO. Since these beads are not described extensively in the literature, temperature treatment may be one way to better understand their formation and to find out whether they should be avoided in future experiments. This could be done by increasing the PAN concentration, but would be associated with a significant reduction in the possible material output per time due to the greatly increased viscosity.
Comparing the images in Figure 2, there is obviously a significant difference in the samples stabilized at identical temperatures with and without fixing. This has not been described in the literature before. While for a final temperature of 280℃ strong conglutinations are visible in both cases, these undesired connections are reduced for samples fixed at lower temperatures. Nevertheless, it should be noted that even for fixed stabilization at 240℃, which is below the lowest temperature indicated in literature, several small conglutinated areas are visible. These results indicate that not only FTIR and other chemical examination methods are essential for the investigation of stabilized or carbonized nanofibers, but SEM or similar methods must also be applied to avoid unexpected and undesired changes in the fiber mat morphology.
In further test series, a maximum temperature of 280℃ has been approached by different heating rates to investigate whether the conglutinations can be avoided in this way. The results are depicted in Figure 3.
Normalized masses (a) and areas (b) of samples stabilized at 280℃ with different heating rates and isothermal treatment for 1 h at the maximum temperature.
While the mass does not show a dependence on the heating rate, the areas are apparently influenced by this parameter. This can be attributed to higher forces working on the samples for higher heating rates and thus breaking the fixed samples at an earlier stage, leaving more time to relax. Interestingly, both values for the highest heating rate (marked as 16℃/min, which means immediate introduction of the samples into the hot muffle furnace, as described above) are nearly identical, which can be explained by the observation that in this case, the fixed sample nearly completely broke along the mounting frame, allowing it to relax almost freely during the stabilization process.
Again, SEM images were taken to compare the different heating rates. Figure 4 shows the results of those. The strong influence of fixing the samples is visible for all heating rates, even the highest ones for which the measured areas were already approaching a common value (Figure 3). Especially for the slowest heating rates of 0.5℃/min and 1℃/min, significant differences between the fixed and the freely relaxed samples are visible, again indicating the importance of fixing the samples during stabilization to avoid shrinkage of the nanofibers, while at the same time, their diameters increased visibly. It should be noted, however, that even at a heating rate of 1℃/min, molten fibers and resulting undesirable connections can be observed. From the SEM images, it can be concluded that the final stabilization temperature should be approached with a heating rate of only 0.5℃/min. Nevertheless, higher heating rates may be applicable for lower maximum temperatures. Tests with a stabilization temperature of 260℃, however, have revealed the same qualitative behavior (not shown here)—again, only with a heating rate of 0.5℃/min it was possible to avoid conglutinations completely. This finding underlines the importance of SEM images for the investigation of the fiber morphology after stabilization in addition to the chemical test methods usually reported in the literature.
SEM images of the original PAN nanofiber mat and samples stabilized at 280℃ approached with different heating rates, with and without fixing them.
In the next step, the samples were analyzed with FTIR to determine the temperatures at which stabilization processes are completed and whether the heating rates influence these findings.
Figure 5 depicts FTIR measurements on samples stabilized at different temperatures with a heating rate of 2℃/min. Measurements of the original PAN are approximately identical to those taken after thermal treatment at 120℃ [34] and are thus not separately shown. The first small changes are already visible at a temperature of 180℃, while the most significant changes begin between 240℃ and 260℃. The different peaks can be attributed to the following chemical groups: The stretching vibration of the C ≡ N nitrile functional group at 2240 cm−1 occurring at low temperatures [12] is still visible at 260℃, nearly vanished at 280℃ and is completely gone at 300℃. For high temperatures, this bond is converted to the large peak of C=N stretching vibrations at 1582 cm−1 or C=C stretching vibration at 1660 cm−1 [12], both of which become visible at 240℃ and above. The second large high-temperature peak around 1360 cm−1 can be attributed to C–H bending and C–H2 wagging [27]. The carbonyl (C=O) stretching peak at 1732 cm−1 vanishes around 260–280℃, indicating that stabilization may be completed in this temperature range [12].
FTIR absorbance measurements on fixed (a) and unfixed samples (b), stabilized at different temperatures approached with a heating rate of 2℃/min. The lines are offset vertically for clarity.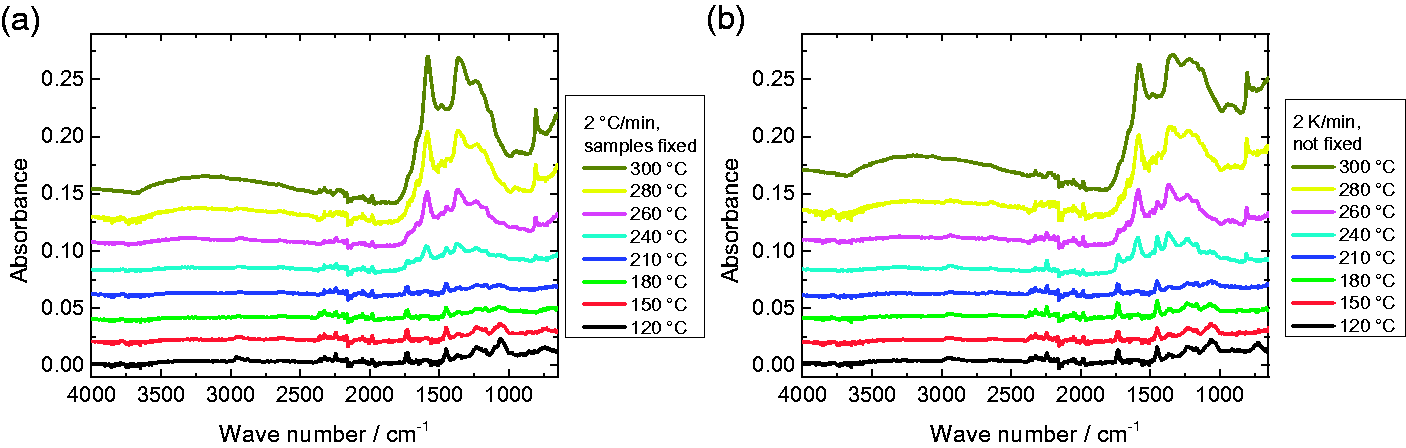
According to Mólnar et al. [12], the peaks in the ranges of 1230–1250 cm−1 and 1050–1090 cm−1 can be attributed to ester (C–O and C–O–C) vibrations of the comonomers like itaconic acid or methyl acrylate which are often applied in industrial production of PAN. Since they vanish around 210℃, they seem to be unproblematic for the resulting stabilized or even carbonized fibers. The peaks at 2938 cm−1 and 1452 cm−1, both vanishing only at 300℃, and 1380 cm−1, being superposed by a new peak, are correlated with bending and stretching vibrations of CH2 [12]. The peak around 800 cm−1, beginning to occur at 240℃ and above, was attributed to aromatic C–H vibrations which originated in the presence of oxygen from oxidative dehydrogenation aromatization, by this removing hydrogen in the form of H2O [15].
Comparing Figure 5 (a) and (b), it should be mentioned that the results of fixed and unfixed samples are qualitatively the same, while quantitative differences occur in some parts of the spectra, especially related to the CH and CH2 peak around 1360 cm−1. Nevertheless, in both cases, the FTIR spectra indicate that stabilization starts around 240℃ and seems to be completed between 280℃ and 300℃.
In the next test series, FTIR measurements of samples stabilized at 280℃ for 1 h were taken, the results of which are depicted in Figure 6. Qualitatively, the results of all measurements are very similar, while the unfixed samples show higher absorbance which can be attributed to the samples being thicker after stabilization due to the stronger decrease in lateral dimensions. This may also be the reason why the freely relaxed samples show less noise. Additionally, in both cases, the CH and CH2 peaks around 1360 cm−1 are qualitatively different for different heating rates, i.e. much more pronounced for smaller heating rates. This finding supports the idea of using lower heating rates to increase the stabilization process.
FTIR absorbance measurements on fixed (a) and not fixed samples (b), stabilized at 280℃ approached with different heating rates. The lines are vertically offset for clarity.
The influence of the heating rate was also examined by DSC measurements, as shown in Figure 7. The expected cyclization reaction is an exothermic reaction, which is shown here by positive values. Since the test series was performed with unstabilized PAN nanofiber mats before cyclization, the areas under the exothermic peaks could be expected to be identical for equal heating rates, i.e. should be doubled for doubled heating rates [24]. According to Figure 7, both predictions are fulfilled.
DSC first heating curve measurements of untreated PAN nanofiber mats with different heating rates (see inset).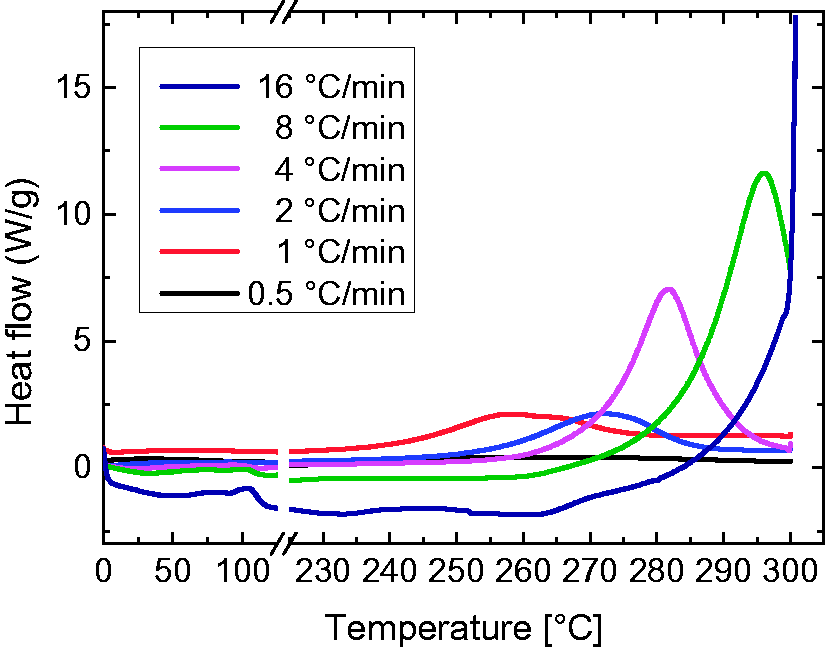
Interestingly, the position of the maximum is shifted to higher temperatures with an increasing heat rate. Further tests are necessary to evaluate whether this finding indicates that different heating rates necessitate indeed different final temperatures or whether the isothermal heating process at the maximum temperature compensates these effects. Since the maximum of the curve measured with a heating rate of 0.5℃/min is barely noticeable, the next heating rate of 1℃/min is used to estimate the temperature range of the cyclization process which seems to be completed around 280℃. It should be noted, however, that no isothermal step is added here so that it cannot be excluded from the DSC measurements that stabilization at 260℃ for 1 h is also sufficient to finish cyclization.
In the next step, the colors of the samples were investigated. Figure 8 depicts the results of samples stabilized at different temperatures, approached with a heating rate of 2℃/min. Up to a temperature of 210℃, the colors of the fixed and the freely relaxed samples are identical, indicating again that stabilization starts around 240℃. Afterward, the unfixed samples show darker colors, most probably due to greater shrinkage. The color measurements suggest that stabilization is already completed around 260℃.
Color differences dE of samples stabilized at different end temperatures with identical heating rates of 2℃/min and isothermal treatment at the maximum temperature for 1 h.
Figure 9 shows the results of color measurements on samples stabilized at 280℃ and 260℃, respectively, in fixed and unfixed state, approached with different heating rates. Similar to Figure 2 (b), the results approach a constant value for heating rates of 4℃/min or higher. No significant difference is visible between the colors reached at temperatures of 260℃ or 280℃, while the difference between fixed and unfixed samples, which was also visible in Figure 6, is underlined here.
Color differences dE of samples stabilized at 260℃ or 280℃ approached with different heating rates and isothermal treatment at the maximum temperature for 1 h.
At first glance, these results may indicate that a heating rate of min. 4℃/min is necessary to approach a constant value of the color differences. On the other hand, a comparison between Figure 7 and the areas depicted in Figure 2 (b) suggests that the brighter colors for smaller heating rates have to be attributed to the larger areas of the respective samples.
Finally, a simple experiment was performed to test the degree of stabilization of the PAN nanofiber mats by evaluating their resistance against DMSO, the solvent from which the nanofiber mats were previously electrospun. It can be assumed that the chemical processes occurring during stabilization, i.e. cyclization, dehydrogenation, oxidation, aromatization, and crosslinking, will reduce or completely impede the solubility of PAN in DMSO. The results are depicted in Figure 10 for fixed samples with different stabilization temperatures; identical results were found for unfixed samples.
PAN nanofiber mat samples, stabilized at different temperatures as denoted in the images, in the dry state (a), 10 s after placing DMSO drops on the samples (b) and 2 h after this (c).
It is clearly visible that the sample is immediately dissolved by the DMSO drop for the first three temperatures. For a stabilization temperature of 210℃, corresponding to the first significant color change (cf. Figure 8), a weak stabilization process has already occurred; the respective sample is partly dissolved due to the DMSO but not completely destroyed. Starting from 240℃, no influence of the DMSO can be recognized; the darker color can be attributed to the influence of the liquid in the samples.
Conclusion
In a recent project, we have examined the influence of stabilization temperature and heating rate on PAN nanofiber mats, electrospun using wire-based electrospinning from a DMSO solution, which has not been reported in the literature before. Investigations by different means showed slightly different optima for the stabilization temperature and the heating rate: While the simple DMSO test used to dissolve the stabilized mats indicated that a temperature of 240℃ is sufficient for stabilization, color measurements show a necessary temperature of 260℃ to approach a constant value in color change. DSC measurements suggest optimal temperatures between 260℃ and 280℃, while in FTIR measurements, depending on the peaks under examination, the stabilization seems to be completed between 280℃ and 300℃.
This finding explains the broad variety of values which can be found in literature. Since stabilization is a combination of diverse chemical processes, i.e. cyclization, dehydrogenation, oxidation, aromatization, and crosslinking [8], different examinations probe different processes which apparently are not finished at the same temperatures.
It turns out that more detailed investigations are necessary to identify which of these processes are essential for the subsequent carbonization process and thus influence the stabilization process to the needs of the final CNFs.
Our study underlines the importance of a slow heating rate and in particular of mechanical fixation of the samples during stabilization, in order to avoid undesired conglutinations and an increase in fiber diameter. The fiber morphology can only be maintained at low heating rates and in fixed samples.
Footnotes
Declaration of conflicting interests
The author(s) declared no potential conflicts of interest with respect to the research, authorship, and/or publication of this article.
Funding
The author(s) disclosed receipt of the following financial support for the research, authorship, and/or publication of this article: The study was partly funded by the Ministry of Culture and Science of the German State of North Rhine-Westphalia. The authors acknowledge gratefully the program FH Basis of the German federal country North Rhine-Westphalia for funding the “Nanospider Lab”. We also acknowledge the Junta de Andalucía for the financial support to the group TEP-184.