
Abstract
Recently, the research and development of textile-based sensors have attracted considerable attention. Changes in electrical conductivity (EC) and electromagnetic (EM) shielding effectiveness (SE) during external stimuli are the most frequently studied output. In this study, the EC and EM SE of an electro-conductive 1 × 1 rib knitted fabric made of metal-coated yarn were investigated during uniaxial and biaxial stretching. According to a theoretical survey, 2 main mechanisms are expected to influence the EC of the fabric under mechanical stress: the contact resistance at the junction of two yarns at low levels of applied force and the electrical resistance (ER) of yarn at high stress. Therefore, the electromechanical properties of single, single-loop, and multiloop yarns were also explored to explain the knitted fabric behavior during uniaxial and biaxial stretching. The SE of the knitted fabric varied from 63 to 47 dB based on the type and level of stretching. Using tests with yarns and crocheted chains, we confirmed that the effect of contact points and resistance on the entire ER textile unit prevails at low deformations. Further, the SE increased almost linearly with deformation during wale-wise stretching. The SE results correlate well with the ER values, which reflect the contact and longitudinal resistances of the knitted fabric. The higher the ER, the lower the SE. Notably, the porosity, which changes during stretching, needs to be considered in estimating SE. It was experimentally confirmed that the knit electro-conducite fabric could be used as a wireless strain sensors.
Keywords
Introduction
At present, electro-conductive textile materials are used in applications such as strain sensing,1–4 motion sensing,5,6 pressure sensing,7–9 and ohmic heating.10,11 Electro-conductive textile fabrics are often prepared using metal-coated yarns. Electro-conductive coatings on yarns or fibers can be produced by electroplating,12–14 electroless plating, 15 spray coating, 16 and sputter coating17,18 with metals such as silver, copper, nickel, gold, zinc, chromium, iron, aluminum, and cadmium. In addition, such metals are used in fiber and filament forms to produce electro-conductive yarns or threads. Theoretically, a wire’s electrical resistance (ER) increases with probe distance in a relaxed state. The same phenomenon can be observed in textile structures containing an electro-conductive component continuously throughout the yarn length. As per Ohm’s law (R = ρL/A), the resistance (R) is directly and indirectly proportional to the yarn length (L) and yarn cross-sectional area (A), respectively, where ρ denotes the resistivity. 19
The electrical properties of yarns mainly influence the electrical properties of the resulting fabrics. In this study, the state of different developed electro-conductive yarns and factors affecting their ER are summarized. The electrical properties of yarns have been studied extensively.20–23 For example, the authors of 24 studied antistatic yarns (containing bicomponent fibers with a carbon component) and confirmed the linear relationship between ER and clamping length. Moreover, the nonlinear behavior of ER on clamping length was observed for yarns containing 20% stainless steel fibers of staple length. Therefore, the electro-conductive yarn construction method influences the length–resistance results. During stretching, as the length of the conductor (wire, single fiber, or single yarn (SY)) increases, its diameter decreases and the resulting ER increases. Three silver-coated threads were studied for ER versus stretching in. 25 The ER of the threads increased with elongation. The threads were used to sew chain and zig-zag stitches on a fabric substrate, and their ER was measured against the fabric elongation. The stitches’ ER decreased with the fabric elongation because of multiple contacts in the stitches.
Survey of the electromechanical properties of electro-conductive textile fabrics can be found in several studies. For example, three forms of electro-conductive yarn—SY, 2-overlapped yarn, and knit stitch yarn—were studied in. 24 When applying uniaxial tensile force, the ER increased for the SY and overlapped yarn; however, for a metal-coated yarn crochet chain, the ER decreased with an increase in applied tensile force. In,19,26 the same ER behavior of electro-conductive knitted fabrics was observed during uniaxial stretching. Electro-conductive yarn in knit form has lower ER values than single strand and overlapped yarns, which agrees with theoretical assumptions. Moreover, a linear relationship between elongation and ER was observed, which is a requirement for developing strain sensors. In, 27 a hexagonal resistance model for a knitted structure was validated. An increase in contact force reduces the contact resistance of the knitted structure; this was proven using Holm’s electric contact theory. 28 Denser knitted fabrics have lower ERs, resulting in a theoretical contradiction. The authors of 29 reported that a full cardigan with medium stitch density was the most suitable for ER stretch sensors among various knit structures. The use of tuck stitch in single pique fabrics is a factor reducing the ER of knitted fabrics. 30 Overall, the length-related resistance and number of contact points influence the ER of knitted structures. Further, the length-related resistance increases with uniaxial force, whereas the contact resistance decreases as the contact points and force increase. 19
As aforementioned, contact resistance is an interesting factor that may affect the resulting EC of a textile structure. The contact resistance is generated at the yarn interface. According to the contact resistance theory,
28
the factors that determine contact resistance are material resistivity, material hardness, the number of contact points, and contact pressure between yarns. The stretching of a knitted fabric is affected by the knit structure; both the course and wale are disturbed by this action (Figure 1). In general, knitted fabrics are more easily deformable than warp knitted fabrics, whereas warp knits are elastic to the length and weft knits are more deformable to the width than warp knits. During wale-wise stretching (Figure 1(a)), the expansion of wale at maximum (Wmax) and contraction of course to the minimum (Cmin) were noticed. In course-wise stretching (Figure 1(b)), the course stretching until maximum (Cmax) and wale contraction to a minimum (Wmin) were noticed. During biaxial stretching of knitted fabric, the course and wale were expanded and represented as course bias (Cb) and wale bias (Wb), respectively. The yarn contact points shift during biaxial fabric stretching (Figure 1).
31
The 1 × 1 rib fabric is a high elastic textile structure, easily stretching uniaxially and biaxially. This structure can be more easily stretched in course-wise stretching than wale-wise stretching because of the loosely constructed courses. In wale-wise stretching, the elongation occurs in the side limbs of the loop and contraction in the head and sinker loop, according to.
32
. In,
33
glass and polypropylene yarns were coknitted with a 1 × 1 rib structure, and the resulting fabric was stretched uniaxially and biaxially to test its tensile, bending, and impact. The wale-wise uniaxial stretch had more stress than the course-wise uniaxial stretch. In the biaxial stretching, the wale-wise stretch exhibited more stress than the course-wise stretch. Yarn contact point-shifting during (a) wale-wise stretching, (b) course-wise stretching, and (c) biaxial stretching.
31

It was confirmed that the main portion of developed textile sensors was based on the change in the EC of the textile structure during external stimuli using traditional wired methods. The research on wireless strain-sensing mechanisms using electromagnetic (EM) radiation is inadequate. In, 34 the radio frequency method was employed for measuring the wireless strain gauge of large metal structures. The accuracy of the wireless radiation measurement method was higher than that of wired measurement using the traditional resistance method. From the performed literature search, the influence of contact and longitudinal resistances on both EC, ER, and EM SE, particularly during mechanical stress, needs to be further investigated to clarify the EM shielding behavior of easily deformed textile structures, which is totally unexplored at present. Describing the EM shielding behavior is essential, particularly regarding advancing wireless strain sensor technology using electro-conductive fabrics.
To understand subsequent experimental results, basic equations describing the yarn and fabric behaviors from the electromechanical and electrical perspectives, respectively, are presented below.
Yarn resistance modeling
The yarn ER (R) changes with increasing tensile, elongation, or strain; the traditional resistance law is used to calculate the change in ER.27,35 Thus, the yarn ER (R) is expressed as follows

For a small change in strain, the yarn ER (R) is.

The yarn ER is the main influencing factor of the entire fabric ER; the distance between the yarn contact points in the fabric structure also influences the fabric ER. During the elongation of fabric samples, the change in ER is noticeable, particularly for knitted structures, as evidenced by the aforementioned studies. Knitted fabrics are produced using a single thread or yarn, assisted by needles creating interlocking loops, instead of multiple warp yarns used to produce woven fabrics. Knitted fabrics are usually stretchable in several directions due to the low tension during knitting. Therefore, knitted fabrics allow greater structural and geometrical changes during stretching than woven fabrics, which are also associated with changes in the number of contact points, contributing to a change not only in ER.
Fabric resistance modeling
Electro-conductive knitted fabric structure can be modeled as resistance circuits. A plain weft-knitted fabric matches the hexagonal resistance circuit model (Figure 2(a)). There are 2 types of ER in this fabric structure: contact resistance (Rc), representing the contact points of the overlapping yarn loop, and intrinsic resistance (RL), representing resistance between 2 contact points (Figure 2(b)). The fabric structure is described by 1 sinker loop (La), 2 loop legs (Lb), and 2 interlooped contacts (c). Based on the fabric structure, the resistance circuit is represented by RL, Rc, resistance at the needle and sinker loops (RLa), and 2 loop leg resistance (RLb).
27
Kirchhoff’s law is used to model the network for deriving the fabric equivalent resistance. When applying tension to the fabric, the knit structure was disturbed (Figure 1). In this case, Rc and RL change according to the applied tension; equation (1) explains the SY ER change during stress. Images of (a) a plain knitted fabric structure and (b) the hexagonal resistance circuit model.
27

For a geometrical description of plain weft-knitted fabric, the relatively simple Pierce model
32
was chosen among other models, such as Chamberlain’s, Munden’s, Dalidovich’s, Morooka’s, and Leaf and Glaskin’s models. La and Lb under no strain are given by


Figure 3 shows the ER circuit for 2 × 1 unit loops of knitted fabric and the interior loop current. Equation 12 is obtained from Kirchoff’s voltage law and the loop current method. I1, I2, I3, and I4 are the total current and equivalent resistance Re = V/I1, where V denotes the voltage. ER circuit for 2 × 1 unit loops of knitted fabric.

Materials
Yarn parameters and their values.


Images of (a) AgPA yarn at 215× magnification (microscopic image) and (b) 1 × 1 rib fabric at 1× magnification (macroscopic image) and its notation
Fabric parameters and their values.

Methods
Yarn – a survey of length-related and contact resistances
To explore the effects of length-related and contact resistances, three experiments were performed using three sample yarn forms: SY, SLY, and MLY. The experimental setup is shown in Figure 5. . Schematic diagram of experimental setup of (a) SY, (b) SLY, and (c) MLY samples (with chain loop formation by crochet hand knit needle) clamped in the tensile instrument for measurement.
The SY sample was prepared using a single strand of yarn (Figure 5(a)) clamped between two tensile instrument jaws. The SLY sample was prepared by overlapping 2 AgPA yarns to form a single loop (Figure 5(b)). Meanwhile, the MLY sample was prepared by hand-knitted continuous chain loop using a crochet needle with a loop length of 5 ± 0.6 mm (Figure 5c). A crocheted chain that matches the warp knit structure was included in this experiment because it is difficult to prepare a weft knit comprising only one row or column. The use of crocheted chains should not affect the investigation of the influence of contact points of electro-conductive yarns on ER. The contact between the yarn and metal parts of the jaws could affect the ER reading so that a nonconductive polymer gripper is placed between the yarn and metal layers of the jaws. A copper plate electrode with a 3-mm width was placed on the polymer gripper and connected with an Arduino® circuit (Figure 6) to measure the yarn ER during uniaxial tensile measurement. The ER of the yarn strands was recorded at a speed of 0.2 readings per second. To record minute ER changes during tensile strain on the yarn, 0.02-Ohm resistor sensitivity was used for the measurement. In addition, the influence of the following two factors was investigated during the three experiments: clamping length and jaw speed with the help of the design of experiment methodology. Consequently, ER at the breaking point and ultimate mechanical properties (tensile strength and elongation at break) of the three yarn forms were evaluated (Table 3). Notably, the selected clamping lengths did not correspond to the real stitch length in the knitted fabric; they were chosen for easy execution of our experiments, although this simplification should not affect the validity of our conclusions. Each measurement was repeated five times for each yarn form to describe the variability of each measured quantity. Experimental setup for measuring ER during yarn elongation (a) Arduino circuit board attached with MATLAB software in laptop, (b) Two probes in tensile machine along with MLY sample, and (c) circuit diagram of Arduino circuit board. Factors and their levels during design of experiment.

The tensile testing of the AgPA yarn was performed using a Lab test 2.010 instrument (LaborTech Ltd., Czech Republic) as per the ISO 2062 standard. The yarn ER was measured using the Arduino circuit with two probes; the experimental setup cum circuit diagram is shown in Figure 6.
The Arduino circuit with breadboard was connected to a laptop (Figure 6(a)), and two probes from the circuit were connected with a copper plate extending from two jaws (Figure 6(b)). The circuit diagram of the Arduino is shown in Figure 6(c). The yarn ER was calculated using equation (6), and the MATLAB program script was written and run to record continuous ER measurements.
Fabric – a survey of ER and EM shielding
Figure 7 shows the experimental setup of a biaxial-stretching device with fabric to measure ER using two probe methods (Figure 7(a)), EM shielding measuring apparatus using the ASTM D4935-18 method (Figure 7(b)), and thickness measurement using two-line element (TLE) sensors (Figure 7(c)). Figure 4(b) shows the knitted fabric image marked in horizontal and vertical directions, which represent the coarse-wise and wale-wise, respectively. This designation (horizontal, vertical) is used later in this study to show which direction of loading was used. Experimental setup of fabric attached to a biaxial device to measure (a) ER, (b) EM SE, and (c) thickness of samples versus elongation.
The continuous measurement of the knitted fabric samples’ ER was performed using an Arduino resistance setup (Figure 7(a)). The edges of the fabric samples were connected with two probes from the resistance circuit board at a 14-cm distance, and the samples were stretched at a speed of 3.5 mm/s to measure ER until 30% fabric elongation. The 30% fabric elongation did not distort the fabric structure. The fabric structure was disturbed by unraveling and breaking after exceeding the 30% fabric elongation. During uniaxial stretching, the probes were connected to the stretching direction for measurements. During biaxial stretching, the probes were connected in the vertical direction of the samples, and only wale-wise resistance was measured. The resistance readings were recorded online using MATLAB software and then saved in a file for further analysis.
The samples’ EM SE was measured using a coaxial transmission line method as per the ASTM D 4935-18 standard. The coaxial holders were placed on the sample surface and attached to a biaxial device. The stretching cycle was programed using Fabris 5K software. The stretching speed was 3.5 mm/s; for every 5% fabric elongation, the holders were paused for 30 s to measure the EM SE. The stretching process was continued until 30% fabric elongation.
The sample thickness was measured online using a Metralight TLE1 laser sensor setup during stretching (Figure 7(c)). The TLE1 sensor is compact and can measure the distance, profile, and edge as accurately as possible. The resolution is 1 μm with laser diode 650-nm class 1M and a power supply over Ethernet of 12–24 V. The biaxial device speed was set to 3.5 mm/s with a 30-s pause after every 5% fabric elongation for the thickness measurement. This process was continued until 30% fabric elongation. TLE sensors were fixed at the fabric top and bottom to measure changes in thickness using laser beam deflection. MATLAB software was used to record the thickness readings.
Three experiments were performed using the knitted fabric: uniaxial deformation in both directions and biaxial deformation. The outputs were ER, SE, and thickness.
The pore area of the fabric sample during the biaxial-stretching process was measured using Nikon NIS-Elements Software as per internal standard number 23-107-01/01.
Results and discussions
Electrical analysis of different yarn forms in a relaxed state
The SY, SLY, and MLY samples were tested for ER at 1-, 3-, 5-, 10-, 15-, and 30-cm distances between the two probes; the results are shown in Figure 8. ER increases with gauge length (G), and this relationship can be approximated by a straight line with a very high coefficient of determination (R2 > 0.98). The slope of the line represents the length-related resistance (RL), and the y-intercept represents the sum of resistances at the interface between the measured material and probes. Comparing RL (Figure 8), SLY and SY have the lowest and highest length-related resistivities, respectively. The resistance value changes because SY has one RL, SLY has four RL and one Rc, and MLY has multiple RL and Rc within the same length. The gauge length of two probes versus resistances of SY, SLY, and MLY.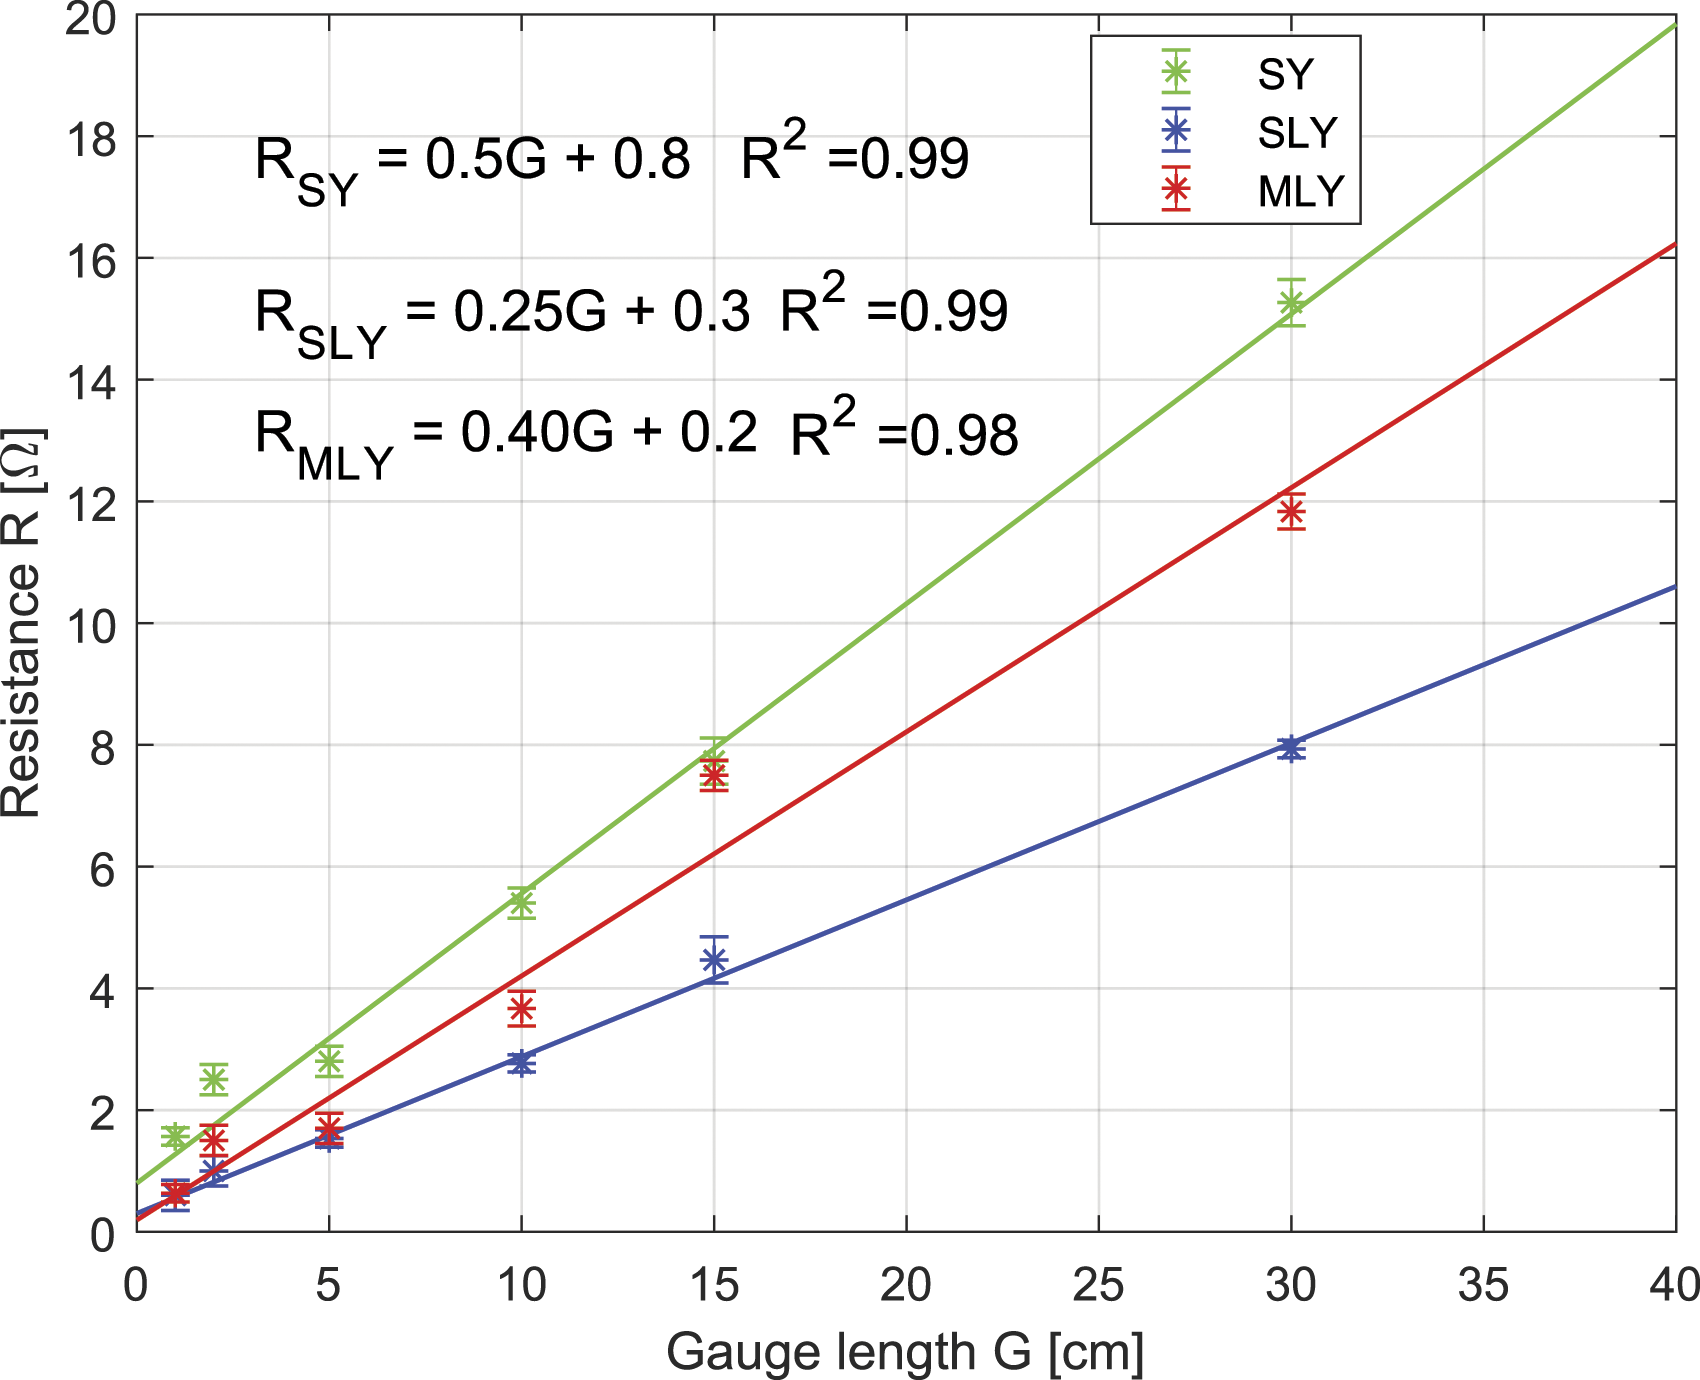
Yarn strain versus tensile of different yarn forms
The tensile strength of the yarn was measured at 5-, 10-, and 15-cm gauge length and 50-, 100-, and 150-mm/min traverse speed. SY, SLY, and MLY stress–strain curves are shown in Figure 9; the mean of five readings was used for this plot. The sample names are marked with gauge length-test speed combination as 5–50, 5–100, 5–150, 10–50, and 15–50. Test results of yarn strain E [%] versus tensile strength T [N] of (a, d) SY, (b, e) SLY, and (c, f) MLY.
Figure 9(a) shows the results of SY at a 5-cm gauge length with 50-, 100-, and 150-mm/min speeds. The yarn elongation at break changed with the test speed. Particularly, the higher the speed, the lower the elongation at break. This effect was also confirmed for SLY and MLY (Figures 5(b) and (c)). The SLY breaking strength was 30–40% higher than that of SY (Figure 9(b)). The SLY sample was prepared using two SY threads (Figure 1(b)), meaning that the yield strength of SLY is twice that of SY, which is why the strength and elongation at break also increase. In the MLY results (Figure 9(c)), the load acts after a certain percentage of strains because of the loosely constructed loop structure (Figure 5(c)). Once the loops get in contact, the load is acting (Figure 9(c)). The lower the gauge, the higher the breaking strength for all yarn forms (Figure 9(d)–(f)). The effect of test speed on breaking strength was observable only for MLY; a higher breaking strength was achieved with a higher speed.
ER versus stress–strain of yarn.
The ER dependence on tensile for the SY, SLY, and MLY samples at 5-cm gauge length using 50-mm/min test speed is shown in Figure 10. For SY (Figure 10(a)), ER increases slightly during the initial tensile process (T < 2 N). After a certain point, ER increases steeply. A single linear model may not adequately describe the relationship between the ER and yarn tensile. In this case, segmented or piecewise linear regression allows multiple linear models to fit data for different ranges of x. In this study, piecewise linear regression with two segments was used when the breakpoint (the point where the slope of the linear function changes) was unknown. The breakpoint was found as the minimum of the sum of the residual sum of squares of the two linear models. Figure 10(a) shows two straight lines with a very high coefficient of determination, defining the breakpoint. The ER dependence on yarn tensile T for (a) SY, (b) SLY, and (c) MLY measured at a 5-cm gauge length at a 50-mm/min test speed.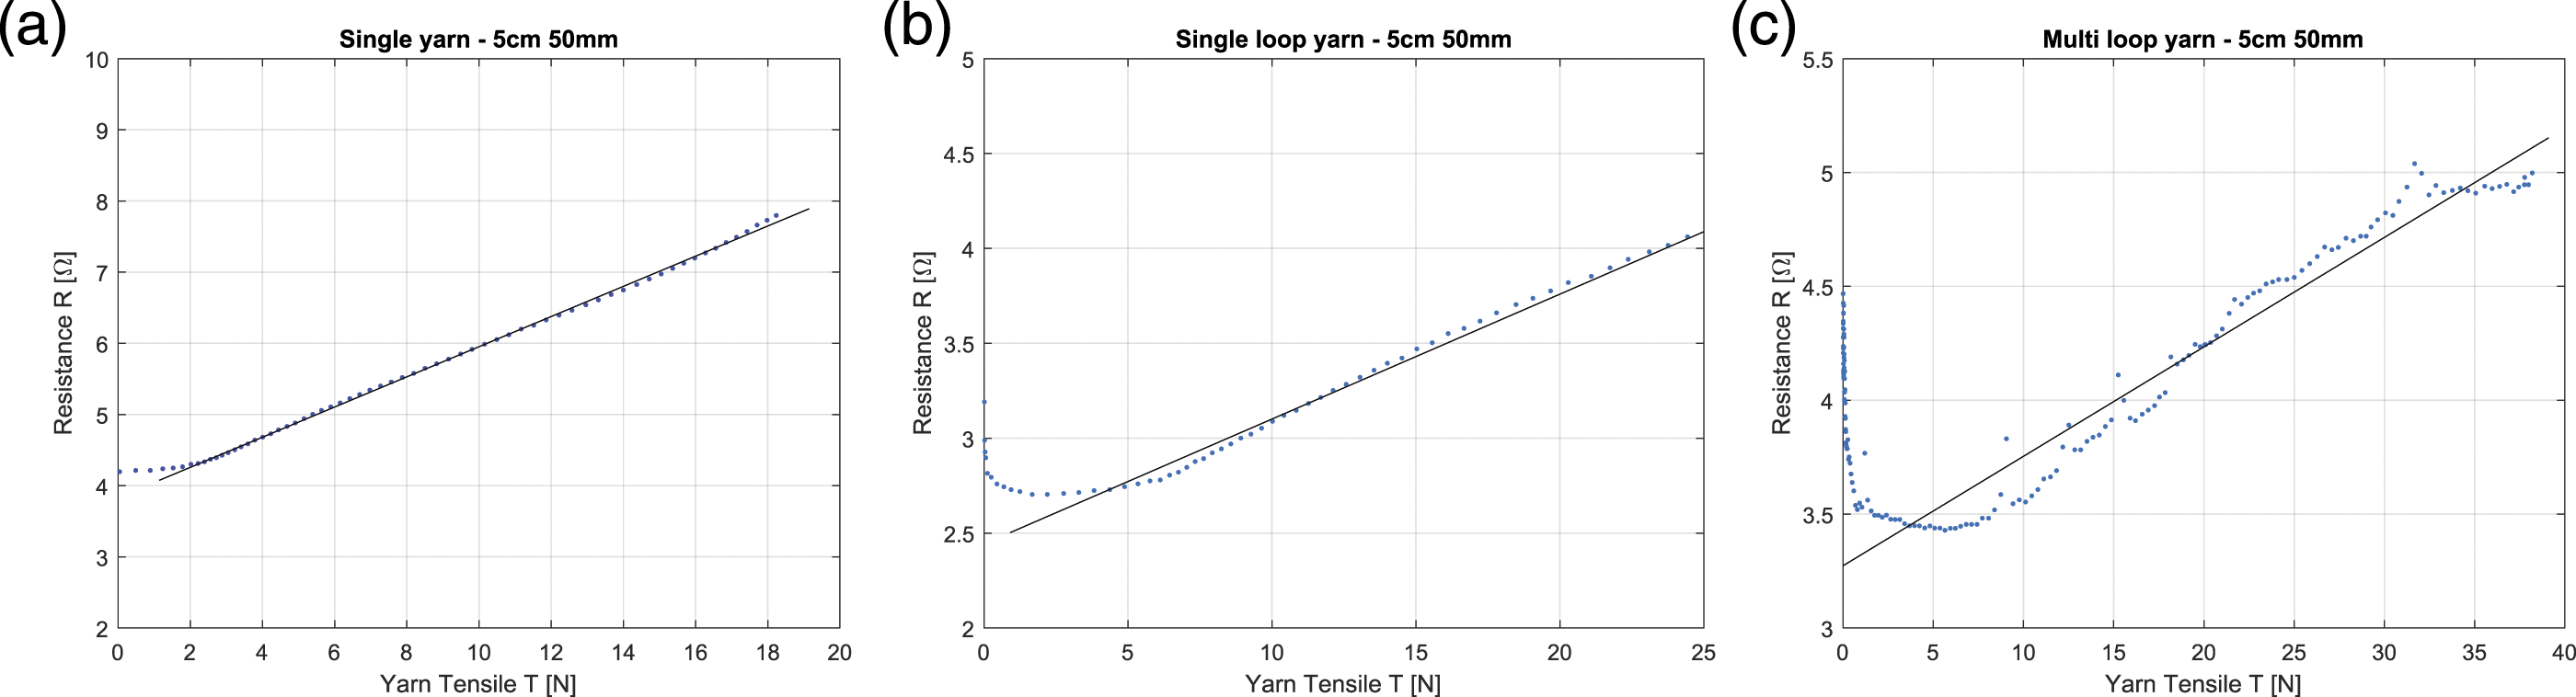
There were two phenomena during the tension process: length-related and contact resistances. The contact resistance occurs during the initial tension due to the twist of the electro-conductive yarn, and an increasing number of contacts between fibers decreases the total length-related resistance. After the change point, only the length-related resistance occurs. It could also be assumed that the continuous electro-conductive layer on the fiber surface during large deformation may be disturbed; therefore, the ER will increase.
The ER dependence on the tensile force for SLY is shown in Figure 10(b). ER decreases until 2 N, attributable to the contact resistance dominating at the initial stressing. After reaching the change point, ER increases steeply due to length-related resistance; the contact resistance has little effect in this region. In addition, it is possible to fit two areas in straight lines to find a change point. It is observable that the length-related and contact resistances behave as competing factors, confirming that the superposition of the length-related resistance can model the knitted fabric ER and contact resistance (see Figure 2). Comparing the initial ER and a rear area of measured ERs of SY and SLY, the ERs in Figure 10(b) are almost half of those in Figure 10(a) because, for SLY, 2 conductive yarns were connected in parallel.
The ER dependence on the tensile force for MLY is shown in Figure 10(c). ER decreases until 0.5 N, attributable to the contact resistance between the yarn loops dominating at the initial stressing. After reaching the change point, ER increases steeply due to length-related resistance; contact resistance has little effect in this region. Besides, it is possible to fit one region by a straight line to find a change point in this case. Comparing the initial ER and the rear area of measured ERs of SY, SLY, and MLY, the ERs in Figure 10(c) are almost half and a quarter of those in Figure 10(b) and (a), respectively, because for MLY, multiple loops of conductive yarn were connected in parallel. Comparing the slope of the increasing linear models of all yarn-form structures, the highest and lowest slopes are in SL and MLY, respectively.
The ER dependence on yarn elongation is shown in Figure 11(a)–(c). Mean values and 95% confidence intervals of means displayed by dotted lines are presented for SY, SLY, and MLY. Observing ER–yarn elongation dependence, two regions of the tension process corresponding to length-related and contact resistances are seen; the contact resistance has the smallest and greatest effect for SY and MLY, respectively. This phenomenon is connected to the number of contact points in the yarn-forming structure. For example, contact resistance is the dominating factor up to 20% elongation for MLY at the lowest test speed. A change in the gauge length changes the curve in the y-direction. In addition, the higher the gauge length, the lower the elongation at break for all structures. The test speed affects the curve shape. The higher the test speed, the faster the decrease in ER due to contact resistance, followed by a faster increase in ER due to length-related resistance. A higher test speed reduces the elongation at break. The dependence of ER on yarn strain for (a, d, g) SY, (b, e, h) SLY, and (c, f, i) MLY at a gauge length of (a)–(c) 5 cm, (d)–(f) 10 cm, and (g)–(i) 15 cm with different test speeds.
Two-way ANOVA results.

From Table 4, the gauge length and test speed have a statistically significant effect on ER and no significant effect on tensile strength for SY, SLY, and MLY. The significant effect of the gauge length and test speed on electromechanical behavior is seen in Figure 11. The gauge length significantly affects elongation for SY, SLY, and MLY. Therefore, the ANOVA results conclude that the gauge length and test speed influence yarn ER; this also proves that the change in the contact point and length of the loop in a knitted fabric structure may change the fabric ER.
Scanning electron microscopy (SEM) analysis of yarn.
The SEM analysis of yarn (Figure 12) shows the surface coating on filaments. Before the yarn elongation, the filament surface coating covers most of the part (Figure 12(a)); after the elongation, the filament surface coating is a wear-off and uneven break of filament (Figure 12(b)). The surface coating of silver on the filament surface came out after the yarn break (Figure 12(b)), confirming that the electro-conductive particles on the surface are no longer in contact, the conductive network is not formed, and the ER increases during a larger tension process. The SLY break occurred by abrasion in the loop, whereas one part of the loop was completely broken and another partially broken (Figure 12(c)). The partial break of filaments is prominent in Figure 12(c). The yarn abrasion leads to the break of the surface coating and completely cuts the conductive network. A higher tension applied to yarn causes wear-off and breaks the filament surface coating, which is the reason behind the increase in ER in SY during stress–strain analysis. SEM images of silverized filament yarn surfaces (a) SY before the break (×40), (b) SY after the break (×40), and (c) SLY after the break (×40).
Electromechanical properties of double jersey fabric.
The EM shielding and EC of electro-conductive knitted fabric were studied during uniaxial and biaxial stretching. Based on the literature review and the previous part of this study, 2 mechanisms are expected to affect the EC of the fabric under mechanical stress, and that is the contact resistance at the junction of two yarns at low levels of applied force and the yarn ER at high stress. It is assumed that this electromechanical behavior will significantly affect the EM SE of the fabric. The lower the ER, the higher the ability of a fabric to shield the EM field. Moreover, the stretching of the knitted fabric influences the structure of the knitted fabric together with its porosity, which could also affect the fabric’s ability to shield EM fields.
Frequency-dependent SE of the knitted fabric sample in a relaxed state is shown in Figure 13. In the relaxed state, the SE of the sample is almost independent of frequency, having an SE between 62 and 67 dB. The dependence of EM SE on frequency (30 MHz–1.5 GHz) of rib fabric.
Figure 13 shows the frequency ranging from 30 MHz to 1.5 GHz versus the SE of the knitted fabric at a relaxed state. Insignificant changes in SE values are seen throughout all frequency ranges, i.e. nearly constant SE values.
The dependence of ER, EM SE, and thickness on elongation for a knitted sample is shown in Figure 14. The mean ER values are shown for all stretching types: vertical, horizontal, and biaxial. The vertical and horizontal stretchings are uniaxial stretchings with a biaxial device. Biaxial stretching (both) means the fabric is stretched simultaneously in the vertical and horizontal directions. The dependence of (a) ER, (b) EM SE at a 1.5-GHz frequency, (c) thickness, and (d) open pore area on elongation for different deformation modes (horizontal, vertical, and biaxial).
Figure 14(a) shows the ER dependence on elongation. ER decreases during vertical stretching. During horizontal and biaxial stretchings, ER increases slightly during the initial stretching process (E <5%), and then the ER decreases with horizontal and biaxial stretchings. At 30% elongation, ER is lower than the initial value. During biaxial and uniaxial stretching, ER was measured in the vertical direction only to better describe the change in ER. The decrease in ER is due to the increasing number of contact points between the wale-wise loops, which agrees with findings from the electromechanical analysis of SLY and MLY.
The EM SE results of the fabric against the stretch are shown in Figure 14(b); SE is demonstrated for a 1.5-GHz frequency. The SE results of the fabric against the stretching are opposite to the ER results; because it is known from theory that the higher the EC of material (the lower the electrical resistivity), the higher the SE. In vertical stretching, the SE increases with the fabric elongation. The increase in SE at 30% elongation is about 5 dB compared with the initial value. For horizontal and biaxial stretchings, the SE decreases until 10% elongation, having SE reduced by about 8 dB compared with an initial value, and SE increases slightly afterward. However, despite the SE increase (for E >10%), SE does not reach its original value at 30% elongation, probably due to larger pores in the elongated structure. It can be concluded that SE is highly affected by the knitted fabric elongation, and the knitted fabric’s linear behavior during vertical stretching can be used to design a fiber-based wireless sensor for sensing the strain. These results agree with results obtained from electromechanical tests with yarns. It seems that contact resistance, which is reduced by the knitted fabric deformation, is the most pronounced here. Length-related resistance is also applied, but its more prominent growth would only become apparent at higher deformations. Compared with the EC of the knitted fabric, the effect of porosity is observable during the SE study. These two phenomena are two competing factors determining the total SE of the yarn structure because contact resistance and porosity act as decreasing and increasing factors, respectively.
The fabric thicknesses against stretching (uniaxial and biaxial) are shown in Figure 14(c). For horizontal and biaxial stretchings, the thickness decreased with increasing elongation. The contact area between the yarn loops increases and causes a decrease in thickness. For vertical stretching, the thickness decreases initially up to 15% elongation and then increases. During the vertical stretching, the wale-wise loops create tension on the yarn and decrease in thickness after 15% elongation; then, the loops overlap each other, increasing the thickness. Elongation–thickness results are almost correlated with SE results for horizontal and biaxial stretchings. Therefore, the thickness values confirm that the contact between the yarns in the loop structure plays a paramount role in SE.
The open pore areas of the knitted fabric uniaxial and biaxial stretchings are plotted against the elongation percentage in Figure 14(d). From the above results, the open pore area increases with elongation. In biaxial stretching, the open pore area increases much more than in uniaxial stretching; biaxial stretches create big open pores to make more area open. The fabric has lower porosity for vertical stretching than horizontal stretching (Figure 14(d)). Vertically, wales stretch and courses come closer; the closing of courses induces less open area. In horizontal stretching, courses stretch and horizontal loops are loosely constructed, so it is easy to elongate and form a wide open area. The geometry of the rib knit structure opening with respect to stretch direction is shown in Figure 1. This open area results are reflected in the EM SE values, particularly in the uniaxial direction. More opening areas reduce the shielding and vice versa.
Conclusion
A wireless strain sensor was developed using AgPA yarn 1 × 1 rib knitted fabric with EM waves as a sensing source. Based on a theoretical survey, the following factors could significantly affect the resulting EM SE of the knitted fabric: length-related resistance of the conductive yarn, contact resistance between two overlapping conductive yarns, and porosity of the knitted structure. The issue of contact and longitudinal resistances was studied first via experiments with yarn and crocheted chain.
The ER of the AgPA yarn is quite low, having R ∼ 50 Ω/m. Moreover, the highly linear ER dependence on length predetermines the yarn structures suitable for sensing applications. In the case of stretching of an SY, ER is almost constant for low deformation (ε < 4% for a 5-cm gauge length and 50-mm/min test speed) due to increased contacts between the electro-conductive yarns caused by twist. For higher deformation, ER increases steeply, which is caused by a decrease in the yarn diameter and disruption of the conductive metal paths on the yarn surface. The effect of contact resistance between 2 overlapping electro-conductive yarns was studied for SLY and MLY samples; a higher effect of contact could be observed for the MLY sample. The effect of contact resistance, which decreases ER, prevails in the MLY sample up to 50% elongation when using the lowest gauge length and test speed. Applying greater deformation, the conductive metal layer on yarns degrades, accompanied by an increase in ER.
The SE of the knitted fabric varied from 63 to 47 dB for a 1.5-GHz frequency based on the type and level of stretching. The behavior of the knitted fabric made of highly electro-conductive yarn during vertical stretching was found to be the most interesting. The ER decreases and SE increases almost linearly during the vertical uniaxial stretching of the knitted fabric, which is caused by the increasing contact points given by the fabric’s special internal structure. In vertical stretching, the knitted fabric also showed a lower increase in porosity than in other stretching types, which is desirable. During the horizontal and biaxial stretchings, the EM SE at 30% elongation is lower than its initial value, despite the ER decrease. This behavior is most probably caused by steeply increasing porosity of the knitted fabric during horizontal and biaxial stretching. The SE results correlate well with the ER values, clearly reflecting the contact and longitudinal resistances of the knitted fabric. The higher the ER, the lower the SE. Moreover, the porosity, which changes during stretching, must also be considered in SE estimation.
The described behavior could be essential for designing wireless sensors using EM radiation and mechanical tensile stress for medical, industrial, and other applications. Notably, our findings are limited to the knit of a certain pattern.
Footnotes
Declaration of conflicting interests
The author(s) declared no potential conflicts of interest with respect to the research, authorship, and/or publication of this article.
Funding
The author(s) disclosed receipt of the following financial support for the research, authorship, and/or publication of this article: This work was supported by the Ministry of Education, Youth and Sports of the Czech Republic and the European Union - European Structural and Investment Funds in the frames of Operational Programme Research, Development and Education - project Hybrid Materials for Hierarchical Structures (HyHi, Reg. No. CZ.02.1.01/0.0/0.0/16_019/0000843).