
Abstract
Areva javanica (AJ), a natural cotton flowers fiber of Amaranthaceae family was taken up for the study of its possible utilization in a friction composite. The chemical composition of Areva javanica fiber (AJF) such as cellulose, lignin, ash, moisture, wax content, and density was evaluated. In addition to these, Fourier transform infrared (FT-IR), X-ray diffraction (XRD), thermogravimetric analysis (TGA), and differential scanning calorimeter (DSC) tests were performed. The surface roughness of AJ fiber was estimated using atomic force microscopy (AFM) and the statistical analysis using Weibull distribution was carried out to identify the diameter of AJ fiber. TGA studies revealed its moderate thermal resistance upto 219℃, and a density of 1.4005 g/cc was estimated of AJF. An attempt was made to make use of the AJF as a potential reinforcement material for acrylic fibers in an organic disc brake pad formulation. Upon fibrization, AJ fibrillates and forms a dense structure, a vital property required for the production of a brake pad. The role of AJ fiber in brake pad was studied by investigating the behavior of fibers from the mixing stage to the cured brake pad. Results revealed that the developed brake pad had a density of 2.01 g/cc, hardness HRS 91, Loss on ignition 21.68%, and cold and hot shear strengths of 44 and 27 kg/cm2, respectively. These values were very close to that of an Acrylic fiber based brake pad. The wear test using Friction Assessment and Screening test (FAST) gave the wear percentage of 0.0187 in3/Hp-h which was found to be 16% higher than AJF (0.0159 in3/Hp-hr) based brake pad.
Introduction
Natural fibers extracted from the different parts of plants such as bark, stems, leaves, fruits, and seeds of many plants have attracted many researchers to carry out their research in this area [1–3]. Many investigators have tried to utilize natural fibers such as hemp, jute, and sisal [4] in the development of friction composites and verified that natural fibers can reduce reliance on man-made synthetic fibers, namely glass, rock wool, carbon, and aramid fibers [5]. The common drawback in any natural fibers is poor thermal resistance, relatively low dimensional stability, high moisture adsorption, and incompatibility with the binder matrix though they can be improved by chemical treatments and immersion techniques [6–8]. For friction composites, another property called fibrization, the filler retention capacity during the dry mixing stage of the ingredients is very important. Aramid fiber has excellent filler retention capacity when mixed in the ratio of 1:10 [9]. Synthetic acrylic fibers have a filler retention capacity equivalent to that of aramid and are used as a processing aid which impart green preform strength to the brake pad [10]. The ceramic and the mineral fibers are used because of their excellent thermal resistance (above 1000℃) [11].
A brake pad friction composite must satisfy a certain set of properties like consistent level of friction, low wear, high thermal stability, and should be environmental friendly [12]. In order to achieve the above properties, 10–20 types of ingredients are mixed, compressed, and baked to form a final product. Those ingredients are classified depending upon their functions such as binders, reinforcing fibers, abrasives, lubricants, and fillers. Some materials fulfill more than a single role and thus become a benefit to formulator.
Fibers are mainly used in the friction material as they aid in processing, provide structural integrity, and to some extent, thermal stability [10]. When the asbestos fibers were used in brake friction material formulation, the total fiber material usage was around 50–62% [13]. After the ban of asbestos fiber, the total filler material usage is around 50–62% due to environmental issues, ever increasing speed of the vehicle and cost factor. In recent trends, diverse research works have been carried out to emphasize the usage of natural fibers in non-asbestos brake pad. Natural fibers such as coconut fiber [12], palm oil clinker [14], and bagasse [15] had been probed in the past to substitute the usage of asbestos free brake pad.
This investigation aimed at characterizing a new natural fiber, AJF, as reinforcement in the Straight phenolic resin (unmodified resin) matrix. Areva javanica (or) desert cotton (or) kapok bush is a species of plant in the Amaranthaceae family. The plant is multi-stemmed, herbaceous, and soft – wooded; also it contains broad leaves and it can grow to a height of about 1.6 m and is widely available in Australia and in southern region of India. Because of its perennial nature, the plant can exist for a longer period of time and is used as animal medicine in some parts of India. The AJ fiber is characterized for its chemical composition (as per ASTM standards), degradation temperature (TGA), differential scanning calorimetry(DSC) for determining the dip in crystallanity, presence of cellulose, and its hydrogen bonding (FTIR), and its comparison with other natural fibers, the amount of crystallinity, and the crystallite size (XRD), Surface roughness using AFM, surface morphology (FESEM), and the diameter of the AJ fiber was predicted using Weibull distribution. This work investigates the possibility of using AJ as a reinforcing fiber in the friction material formulation. In one of the author's previous works, acrylic fiber was used in brake pads in spite of its poor thermal resistance and it was found that it provided greater green preform strength [10]. Hence, this work was carried out in search of replacing the acrylic fiber as AJ fiber was lighter and less dense and also is a natural source. The green strength is required as the preformed pads have to be transported to the curing section. If green strength is insufficient, during transport, cracks will appear on the sides of the preform and the pad gets rejected. The word ‘green’ refers to the preform which is uncured. Moreover, from the FESEM images shown in Figure 8, it is clear that the AJ fiber has micro fibrils with different degrees of curl which enable to trap other ingredients in the formulation and to maintain uniform dispersion [9]. These interesting properties prompted the author to make a brake pad with the AJ fiber. The developed pad was evaluated for the physical, chemical, mechanical, and tribological properties by comparing it with acrylic fiber-based brake pad. The results showed promising possibilities for utilizing the AJ fiber in developing green composites.
Materials and methods
Materials
Extraction of the AJ fiber was carried out manually and the extract was allowed to dry at room temperature for a week [16]. AJ Plant and seed fibers of AJ fiber were obtained and extracted at Virudhunagar district, Tamil Nadu. The images of AJ plant and flower fibers in the plant are presented in Figure 1.
(a). AJ Plant and (b) seed fibers of AJ fiber.
Chemical composition
This analysis was done with purpose of identifying the presence of cellulose, hemicelluloses, wax, ash, lignin, and the moisture present in the AJ fiber. The occurrence of cellulose in the fiber was found by the testing procedure stated by Kurshner and Hoffer [17]. Hemicellulose percentage in the fiber was found using neutral detergent fiber method [18]. To diagnose the presence of lignin, APPITA P11s-78 method was adopted [19,20]. The presence of wax content was estimated with the standard test method described by contrad, where the wax was taken out by means of hot 95% ethyl alchohol and is transmitted to chloroform by phase separation [21]. The density of the AJ fiber was identified by employing the meltbertoledoxsz05 balances method [22]. The ash content was evaluated as per ASTM E1755-01 standards [1] and the moisture content of the AJ fiber was found using keeping the fiber in a air oven for eliminating the moisture at 80℃ for a period of 6 h. Then, samples were seized from oven to measure their weight [23]. The equation used for calculating the moisture in AJF was

Characterization methods
TGA
The thermal stability behavior of both the AJ fiber was assessed by thermogravimetric (TG) analyses using the Jupiter simultaneous thermal analyzer under both N2 and oxygen atmosphere at a flow rate of 20 ml/min. A sample weighing 1.5 mg was heated at the rate of 10℃ per min from room temperature 32℃ to 800℃. The same conditions prevailed at nitrogen environment for estimating the thermal behavior of acrylic fiber.
DSC analysis
DSC method is useful in evaluating the dip in crystallinity and the disintegration of fiber. It is done by establishing a exothermic peak and the value obtained will be a useful in measuring the extent in quality of cellulose present in AJ fiber which in turn will indicate measure of the reduction of crystallinity in the fibers [4]. A Perkin Elmer STA – 6000 Differential Scanning Calorimeter was used for the analysis. The fiber samples of AJ was tested in both oxygen and nitrogen conditions and acrylic was heated in the nitrogen atmosphere from room temperature to 800℃ at a heating rate of 10℃/min.
FTIR spectroscopy
The IR spectrum of the fiber was recorded using a Jasco FTIR 6300 type A spectrometer in the frequency range of 4000–399 cm−1 using 32 scans and recorded in transmittance mode. The data interval was kept as 0.964233 cm−1 and the incident angle was kept at 45°.
XRD analysis
The XRD analysis of AJ fiber was carried out using the X'pert PRO measurement program with Bracket Diffractometer system and a copper target X-ray tube set, at the temperature of 25℃ and a step size of 5 mm was used. The starting position of °2Th was kept at 10.0231 and the end position was kept at 80.9231. The length of the specimen was 10 mm and the divergence slit size was 0.4785° and the goniometric radius was kept at 240 mm.
AFM
The unevenness in AJ fiber was identified using AFM analysis ranging from micro to nano scale which was performed using Nanoscope digital IIIa (Veeco.Co.Ltd). The equipment comprises a J-Category piezoelectric scanner with vertical engagement, and having a radius of curvature of tip end 10–20 nm, data scaling was done at 1.7 V and data scanning was observed at a rate of 1 Hz. This analysis obtains 3D images by measuring forces of attraction or repulsion happening between the fiber and the cantilever tip. This analysis will be helpful in measuring the parameters such as the average surface roughness (R a ), Skewness (R sk ), Ten point average height roughness (R z ), Kurtosis (R ku ), root mean square roughness (R ms or R q ), and maximum peak-to-valley height (R t ) [1].
Surface morphology and Weibull distribution of AJ fiber
The Surface morphology of AJ fiber was examined by Optical microscope (OM) (Model: Zeiss with AXIO Cam ERc 5s). A two-parameter Weibull analysis was done by the Minitab 17 software to estimate the diameters of the fibers at three different indiscriminate locations and the average value of the analysis was examined. Field emission scanning electron microscope (FESEM) (Model: SU1510, HITACHI, Japan) was utilized for capturing SEM images in SE mode at the operating current 5 kV.
Results obtained from AJ fiber
Chemical composition of AJ fiber
Chemical compositions of raw AJFs.

TG analysis of AJ and acrylic fiber
From the TG curves shown in Figure 2, thermal degradation of both AJ fiber and acrylic fiber was taken into analysis and comparedwith TGA of acrylic fiber. The TGA curves of AJ fibers were analyzed in both nitrogen and air conditions to understand the deviation in curve because of the presence of oxygen and its influence on degradation of fiber. The thermal degradation in nitrogen environment had AJ fibers that show three weight loss steps, whilst their decomposition occurs in two main stages and for oxidative conditions the decomposition occurs in two main phases. Initial degradation in both oxygen and nitrogen atmosphere of AJF started precisely at 100℃ resulting in weight loss. Evaporation of moisture from the fiber is attributed for this [6], whilst the onset degradation for the AJF occurs at higher temperature in N2 ambience, precisely after 219℃, the decomposition of AJ fiber in oxidative setting observed steadily after 209℃. Similar kind of peaks were observed for various other natural fibers such as kapok (250℃ to 300℃) [24], kenaf (219℃), and napier grass fiber (220℃) [25], with less peak value than of century plant (240℃) [27] and thespesia lampas plant (230℃) [28]. Above this temperature in particular, during the first stage T1 (220℃–314℃), depolymerization of hemicellulose occurs [6] resulting in weight loss of around 27% can be observed in nitrogen surroundings. While in case of oxidative conditions first phase of degradation happens very steadily and there is a huge weight loss of 48% between temperature ranges of (209–368℃). Hemicellulose can be easily hydrolyzed as it has random amorphous structure [6]. The second stage in nitrogen condition occurs in the temperature range (314℃–395℃). A major peak at 323.6℃ indicated the possible decomposition of α-cellulose, hemicelluloses, and lignin present in the fiber [20]. The second stage in oxygen environment is small compared with the nitrogen environment where the decomposition occurs between temperatures of 368℃ to 453℃ in this phase, where the mass of the fiber was reduced to 17% with a peak occurring at 379℃. Structurally lignin is different from cellulose and hemicelluloses due to its complex structure and hence its degradation occurs at a very low weight loss rate within the whole temperature range [29]. Remaining two peak values viz. 480.6℃ and 676.6℃ may be a consequence of degradation of the charred residue [29]. Hence it can be concluded that AJ fibers are stable up to 219℃ from TG curves in nitrogen environment while in oxidative conditions the AJ fiber remained stable until 209℃.
TGA of AJ and acrylic fiber.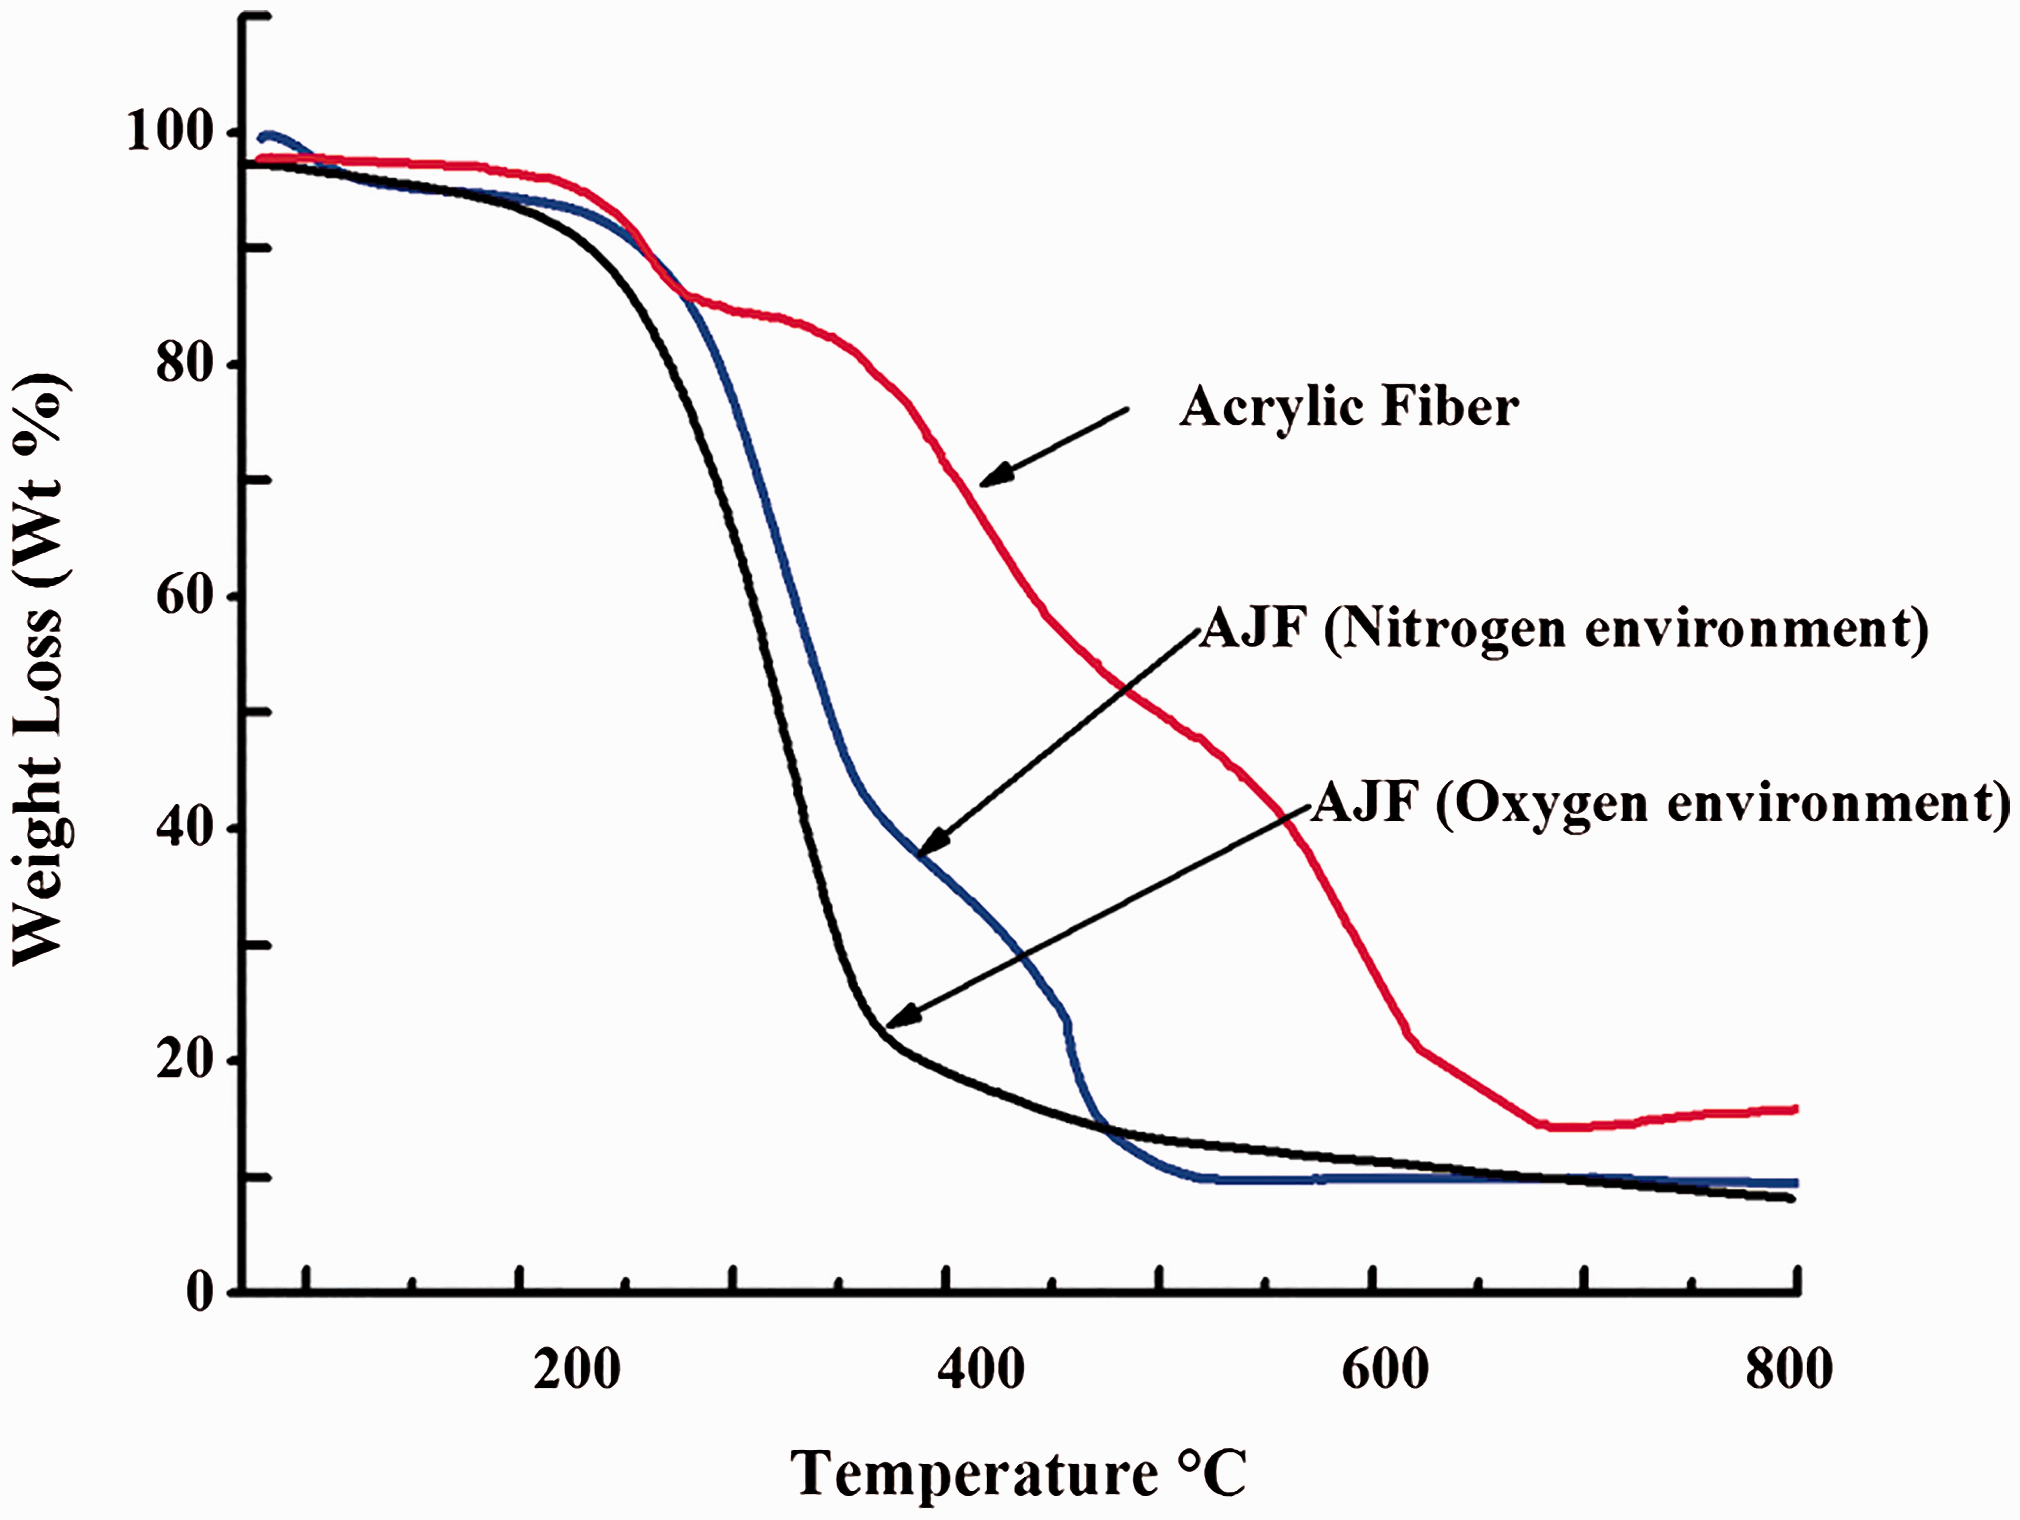
As shown in Figure 2 where polyacronitrile (PAN) fibers was considered, the thermal degradation of this Acrylic fiber consists of two major steps of weight loss. The weight loss of the fiber remained steady upto a temperature of 247℃ and the stage continued until 275℃ for which a small shoulder was observed at 258℃ which resulted in a minimal weight loss of 12% and is attributed to the degradation of H2O and NH3 and could also be owing to chain fragmentation as was seen in previous circumstances[30,31]. Then onwards, there was a steady decrease in fiber weight and the second stage occurred from 402℃ upto a temperature of 506℃ and little shoulder was identified at 437℃ which resulted in a residual weight of upto 40% in this phase. From previous works [31], the weight loss was possibly a reason due to nitrile cyclization. Hence, it is understood that acrylic fiber starts to depolymerize at around 247℃.
DSC analysis of AJ and acrylic fiber
From the image shown in Figure 3, a comparison is drawn between the AJ fiber and the Acrylic fiber at constant heat flow rate to show the thermal performance of the fibers which results will show the decrease in crystallinity of the fiber by DSC (Differential Scanning Calorimetry) method [4]. It was interesting to see that from the normal heat flow of 19.5 mW, with the AJF in oxygen environment a peak was measured at 278℃ and in nitrogen mode the stability reconed upto 261℃ because of the crystalline substance present in the fiber. There was a sudden drop in shoulder of AJF curve at 377℃ in oxidative conditions and for nitrogen environment it was observed at 435℃ and in both cases the drop in peak was fiber was attributed to the existence of amorphous cellulose in the fiber as was in the previous circumstances [4], which in turn could be removed by chemical treatment of fiber.
DSC of AJ and acrylic fiber.
The acrylic fiber curve remained steady compared to AJF and there was a sharp endothermic peak which was observed at exact 330℃ for acrylic fibers and the stability was mainly due to the acrylonitrile presence in fiber, while for acrylic fiber, the fiber started to obtain a broad shoulder exactly at 500℃ which in this case was due to the nitrile cyclization in fiber because dehydrogenation in acrylic fibers was not possible in nitrogen ambience [31].
FTIR of AJ fiber
The FTIR spectrum of AJF as depicted in Figure 4 shows the peaks of whole AJF appeared from 3743 cm−1 to 446 cm−1. The FTIR spectra of AJF shows absorption bands comprising of chemical groups attributing to lignocellulosic fiber compounds which are cellulose, hemicelluloses, and lignin. A sharp peak was observed at 3743 cm−1 which corresponds to the presence of O–H stretch of cellulose [29]. A strong broad peak shown at 3328 cm−1 was due to the O–H stretch and presence of hydrogen bonding of phenols, which indicate the major presence of cellulose. The O–H stretching for kapok [24] and kenaf was also seen for a wavelength of 3358 and 3432, respectively. The absorbance peak at 2920 cm−1 corresponds to C–H stretch of alkanes which also indicate the presence of cellulose in it [28]. Two small peaks of 1731 cm−1 and 1644 cm−1 are shown which corresponds to belong to the carbonyl C=O stretching vibration of carboxylic acid in lignin or aldehydic group in hemicelluloses, and the other absorbent indicate a medium size peak which is present due to carbon stretch C=C of the alkenes. Similarly, two little shoulders at 1370 cm−1 and 1241cm−1 are indicating the fact that corresponds to the stretching of C–H rock of amines which is due to the presence of lignin and hemicelluloses [4,29]. The strong absorption peak at 1031 cm−1 in the spectrum is ascribed to the CO and OAH stretching vibration which belongs to polysaccharide in cellulose [29]. The peak at 530 cm−1 indicates the bending vibration of C–Br stretch of alkyl halide which is again due to the presence of cellulose [24]. The following table indicates the peak occurrences of various other fibers. Table 2 provides FTIR Peak Positions and Allocations of chemical stretching in the AJFs.
FT-IR of AJ fiber. FTIR peak positions and allocations of chemical stretching in the AJFs.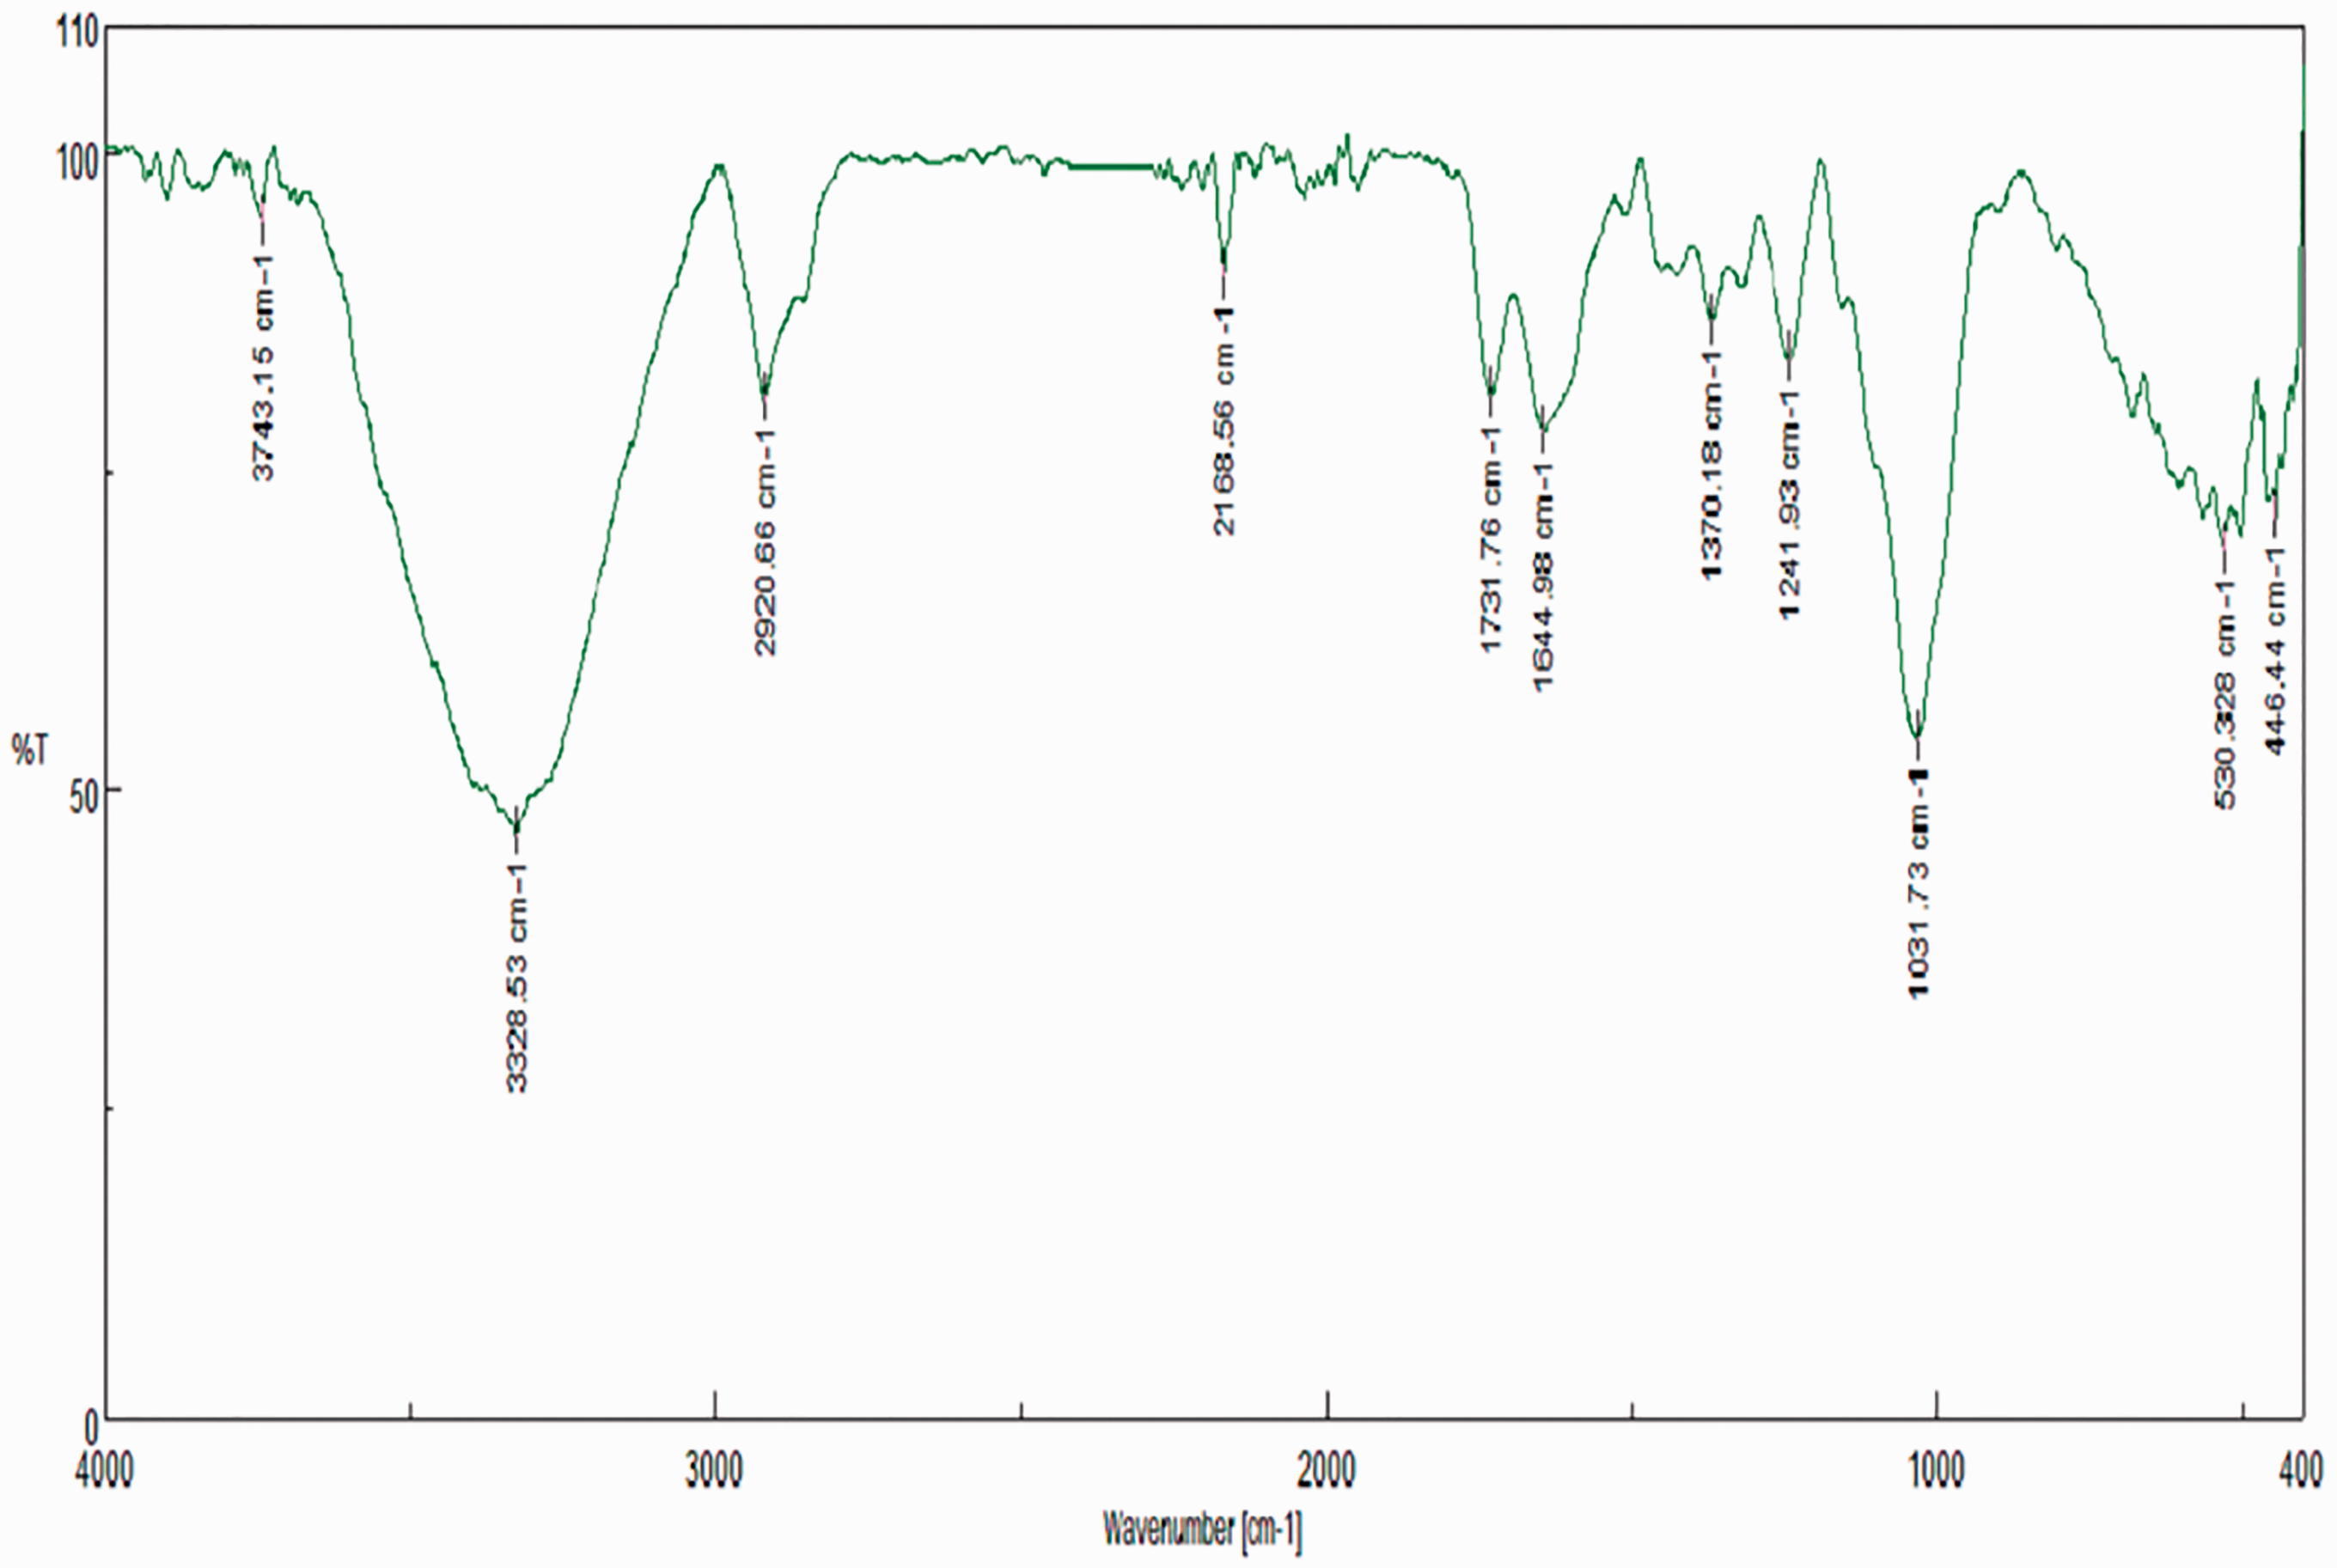

XRD analysis
The diffractograms obtained of AJF shows that the peaks were found to be between 10° and 80° as shown in Figure 5. Two diffraction intensity peak at angle 2θ = 15.37° also seen in Cyperus pangorei fibers [32], and 22.52°- is found in the spectrum. The crystalline peak of AJF 15.37° and 22.52° corresponding to planes (220), and (210) planes indicate the presence of cellulose content in the fiber. From the diffractograms, it is a clear that the AJF behave polymorphic in nature. The crystalline index which refers to the amount of crystallinity present in the substance compared to the amount of amorphous content it possesses was determined using Segal empirical method. The calculated CI value of the AJ fiber was found out to be 47% which closer to kapok fiber[4], and PJ fiber [22] but lower than Hemp, and sisal fibers [4]. The crystallite size which influences the moisture absorption capacity and chemical reactivity of the fiber was found to be 2.13 nm using Scherer's formula [33]
XRD of AJ fiber.

Surface roughness analysis by AFM
The AFM characterization shown in Figure 6(a) to (d) gives a detailed surface nature of the fiber with the scanner having a scale range of 10 μm × 10 μm with x and y direction and 70 μm with the path of z direction. Figure 6(a) shows the occurrence of surface roughness in 3D, and Figure 6(b) shows a clear indication in 2D. The 3D topographical images shown in the Figure 6(a) indicate the presence of smooth surface which has a surface roughness R
a
of 0.693 because of the impurities present and the existence of lignin [1]. This value could be drawn in comparison with Acacia planifrons fiber [1] which value was closer to AJF but higher than Cyperus pangorei [32]. The skewness in the surface R
sk
was obtained to be as 0.067 which implies the irregularity of the height distribution within the corresponding area of sample. From the figure obtained, it is understood that the roughness skewness of the fiber has the value at the positive end which means that it indicates the nonporousness of the surface as mentioned at [1]. The roughness kurtosis value is useful in identifying the presence of spike in the surface and a value of 3.108 roughness kurtosis R
ku
of AJF was diagnosed which was higher than the furcraea foetida fiber [34]. The roughness values were estimated and found to be as follow: R
z
was 4.257, R
q
was 0.877 and R
t
was found to be 5.295 which all establish the occurrence of surface smoothness in AJ fiber as stated in these cases [35,36].
(a to d) Surface roughness of AJ fiber using AFM in 3D & 2D.
Surface morphology of AJ fiber
Microscopic examinations of the cross section and longitudinal surface of AJ fibers are depicted in Figures 7(a) and Figure 8(a) to (d), respectively. Figure 7(a) shows representative optical microscopic (OM) images of AJ fibers which also shows the diameters of the fiber at random locations. To determine the diameter of fiber in statistical means, the shape and scale parameter of AJ fiber were analyzed using two parameter Weibull distribution scale [37]. The characteristics of distribution in values and the dependability of the experimental values are denoted by Weibull shape and scale parameter, and for the Areva javanica fiber the shape and scale parameter measured are replicated in Figure 7(b).
(a and b) OM image and Weibull distribution of AJ fiber by two parameter. FESEM images of AJ fiber.

If the parameter measured is 3, then the curve is normal and if the parameter lies between 2 to 4 it will be still considered normal [38]. But, if the value of shape is more than 4 then it will provide a leftskewed curve and if the value of shape is less than 2 it will provide a right skewed curve as stated earlier by Fiore et al. [39]; moreover, if the shape parameter value is on a higher note, then variation coefficient in parameters will be at the lower end [40].
Field emission scanning electron microscope (FESEM) images of AJ fibers are shown in Figure 8 (a) to (d). The AJ fibers obtained from cotton flowers are composed of single cells that are held together by binding materials, resulting in single cells that are too small to be used for high value fibrous applications. At a higher magnification, Figure 8(c) and (d) shows clear smooth surfaces of AJ fibers and fibrils bound together by hemicellulose can be seen. Moreover, the degree of curl in the fibers could able to trap the smaller size ingredients which is essential for uniform dispersion. The fibrillated AJ fiber upon mixing results (Figure 7) in a high surface area of 4 m2/g to 5 m2/g. For Kevlar the value is around 7 to 11 m2/g [9] and for Acrylic it is around 5 m2/g. This favorable property is useful for this fiber to be used as a reinforcement in the friction composite.
Application of AJF
In the friction material formulation, fibers impart physical strength thereby increasing both strength and impact resistance of the brake pads, provide resistance to thermal shocks, and act as a processing aid. These fibers should have high strength, good thermal resilience, low thermal conductivity, be compatible with binders, and should be non-toxic. Among various fibers, Kevlar, mineral wool, and glass fibers play a dominant role for commercial applications. It is difficult to see any brake pad formulation without Kevlar because of its high temperature strength and in spite of it organic group, it provides green strength to preform, controls bulk density, enhances friction performance, and has good dispersion with the raw materials. Mineral wool and glass fibers have poor compatibility with the binder, but have excellent thermal resistance. Along with the above-mentioned list of fibers, synthetic low heat resistance fibers like acrylic fibers are also used mainly for improving the green strength of the preform. Additionally, they have good filler retention capacity. As the above-mentioned properties like filler retention capacity due to good dispersion as noticed from SEM, light weight, imparts green strength being organic in nature, cellulose content 57.8%, easy availability, environmental friendly, degradation temperature more than the binder resin 219℃ (from TGA) are available in the characterized new AJ fiber, an attempt was made to utilize the AJ fiber as a possible reinforcement for acrylic fibers in an organic disc brake pad formulation.
Fabrication of brake pads
The brake pads are generally fabricated in four steps, which are mixing of the ingredients, preforming and curing in a hydraulic press, and post curing as shown in Figure 9. Two brake pads were fabricated: one with acrylic fiber, and the other with AJF. In this paper, they are referred to as DB01 (Disc brake pad made with AJF) and DB02 (with acrylic fiber). The formulation of the brake pad with the weight percentage of the ingredients is presented in Table 3.
Fabrication of brake pad: (a) Plough shear mixture for homogeneous mix, (b) powder filled in cavity preforming (c) preformed product, (d) cured brake pad. Formulation of the brake pad.

The addition of ingredients such as kevlar, barytes powder, rockwool fiber, copper fiber, graphite powder, crumb rubber, vermiculite, friction dust, china clay, and MgO was carried out in a drum mixer with feeder and chopper.
Steps involved in fabrication of the brake pad.

Brake pad characterization
Basic properties of the brake pads were measured following IS 22742 Part 3 of 1994 Indian standards. For comparison purpose, a commercially successful Original Equipment Manufacturer (O.E.M) brake pad purchased from the market was also taken for testing. The density of the friction material was found by the water displacement method based on Archimedes principle [41]. Hardness was calculated in ‘S’ Scale using a Rockwell testing machine with a major load of 100 kg-f with a ball indentor of size 3.125 mm. Acetone extraction was performed to find out the uncured amount of resin in the brake pad after baking. It is also an indication of the degree of cure. Heat swell was carried out to find the changes in the thickness of the pad at least at five points, after the pad is subjected to 400℃ for a period of 10 min. In the case of loss of ignition (LOI), the sample containing 5.5 g silica crucible was loaded in the muffle furnace, which was maintained at 800℃ and soaked for 2 h. After ignition, the difference in the weight was calculated. The visual assessment method is used to find out the adhesion. The developed composite is fitted in the fixture as per ISO 6312 standards to find out the hot shear strength (Figure 10(a) and (b)) after heating to 200℃ and soaking at that temperature for 30 min. The cold shear strength is carried out at room temperature.
Schematic diagram of the shear testing as per ISO 6312 standards.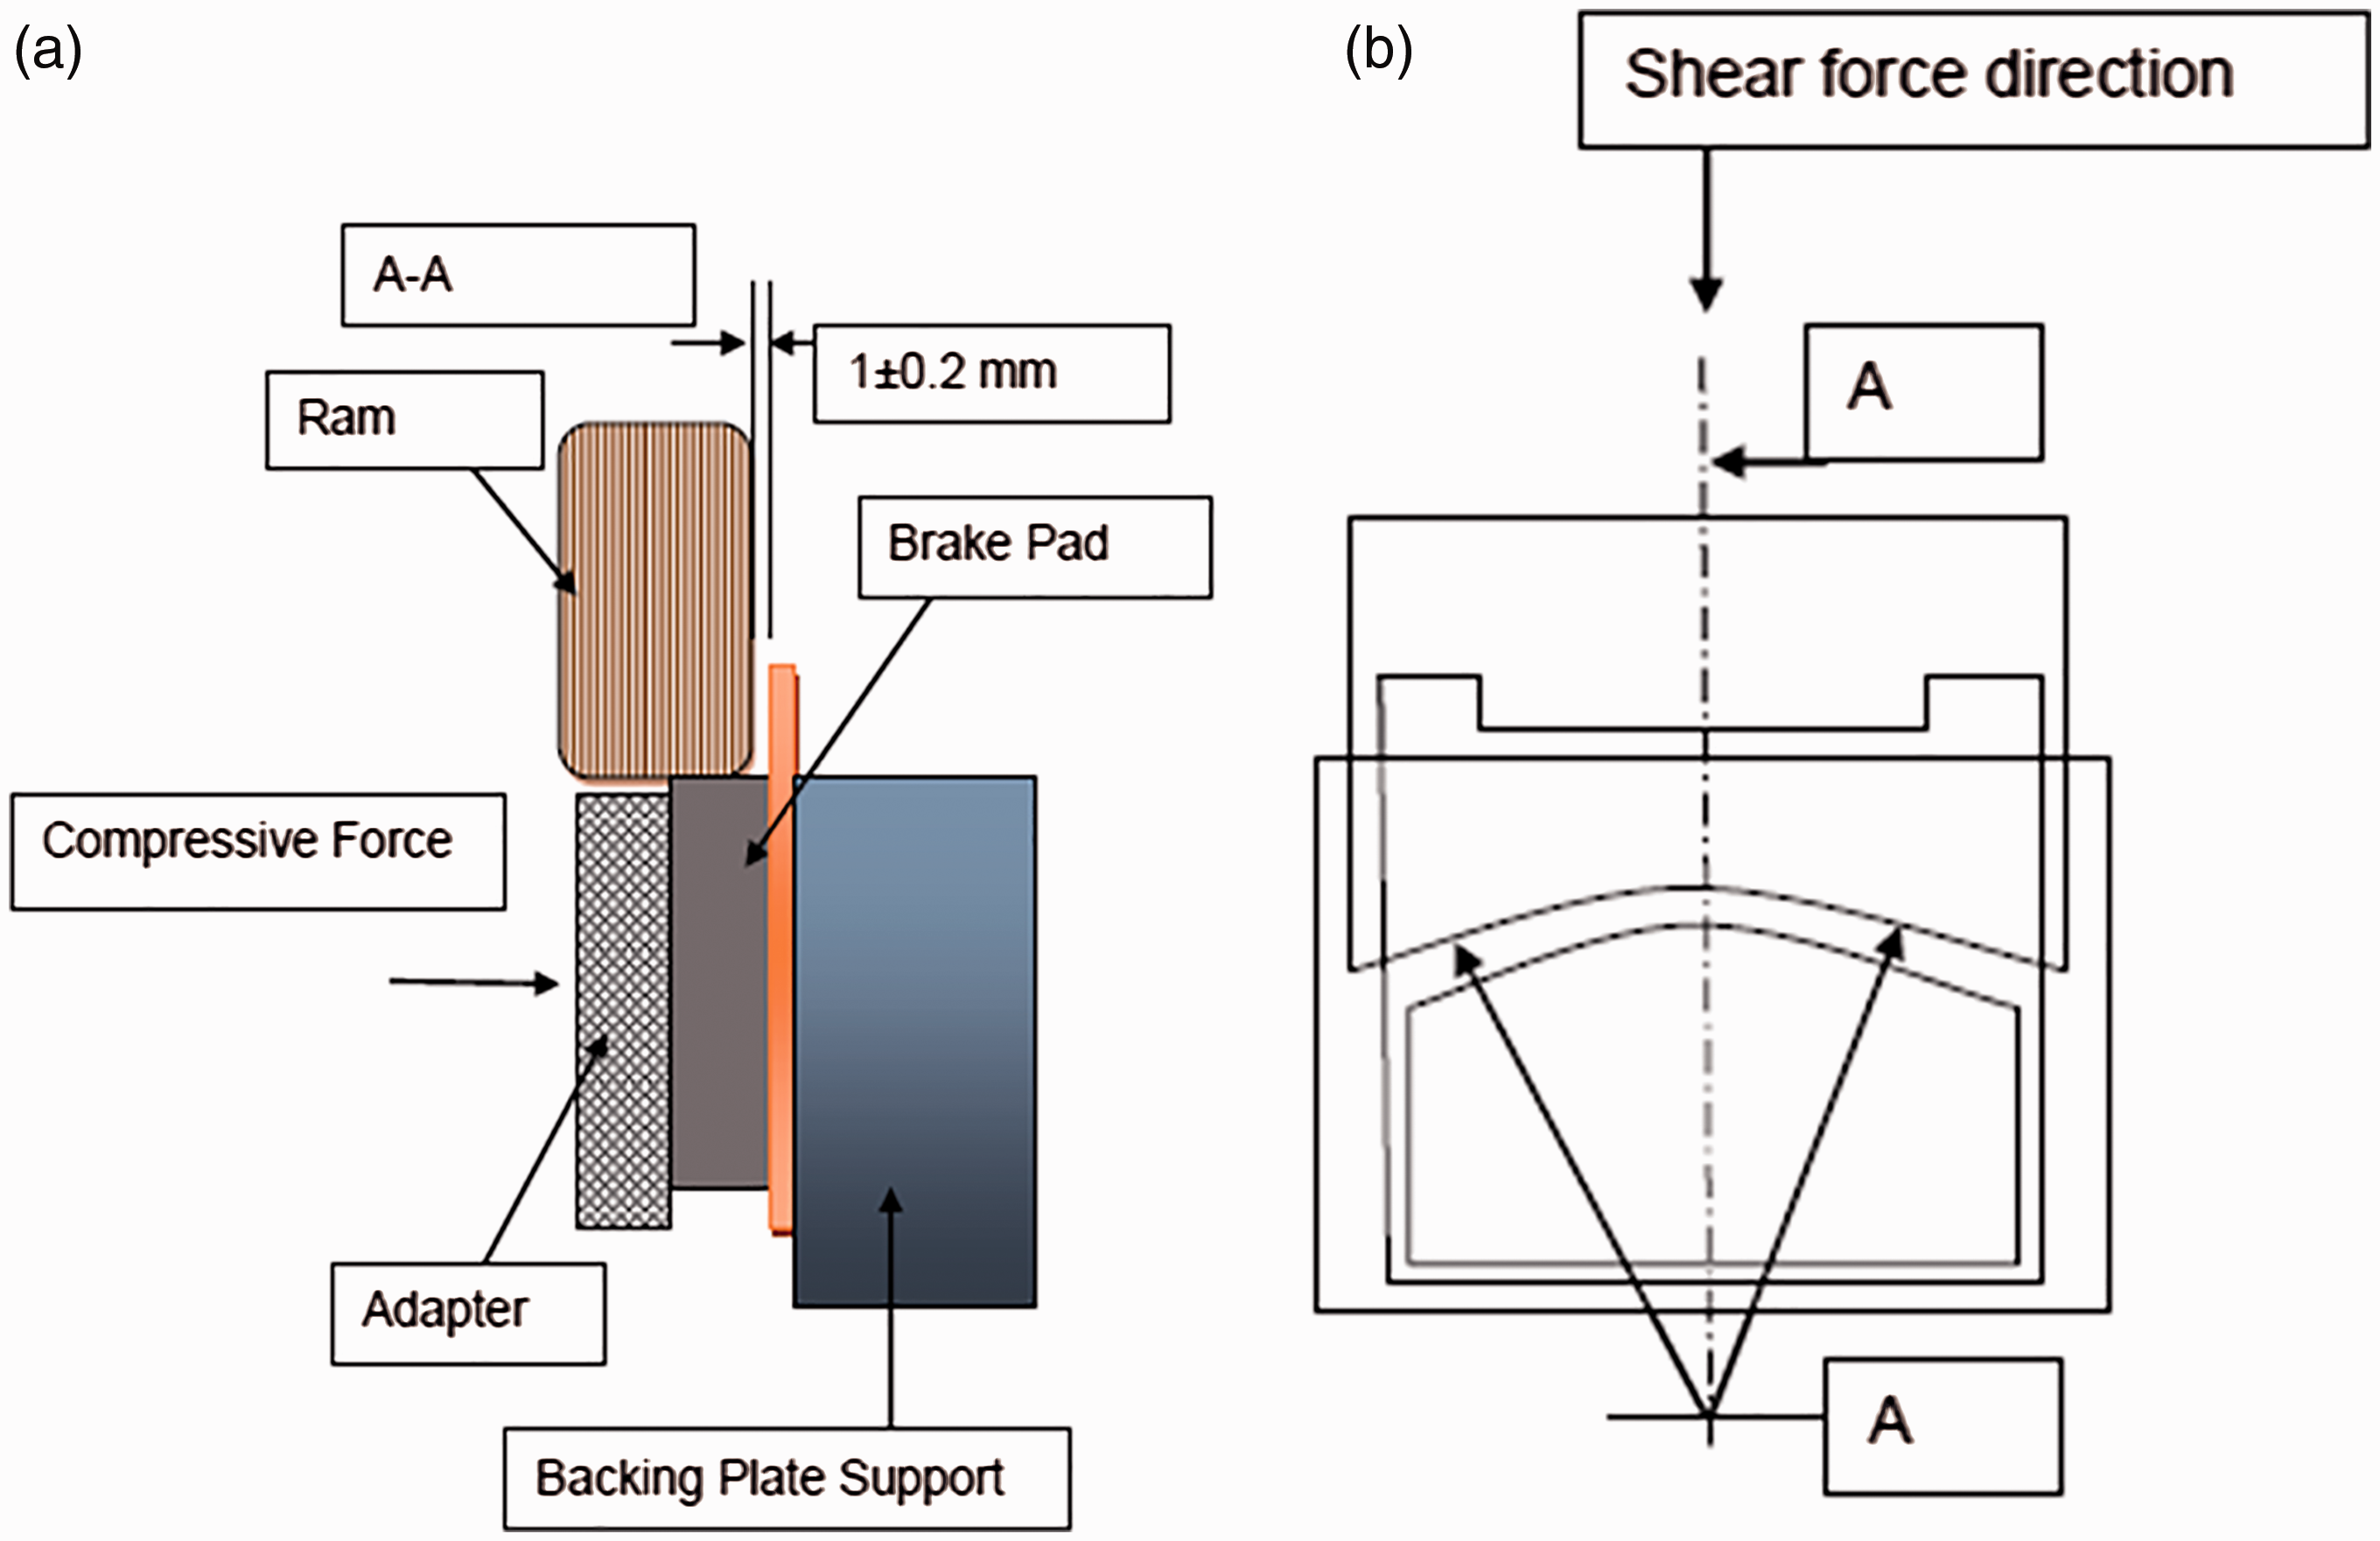
A three-point-bend head was used to indent the preformed samples in a direction perpendicular to the compressive load to check the mechanical integrity. The maximum load endured by the preform was recorded and plotted as shown in Figure 11. The wear test is carried out in the FAST (Friction Assessment and Screening Test) Machine shown in Figure 12 which is designed for rapid “finger printing” of small size friction material specimens. The test was carried out at constant friction force mode with a constant clamping pressure of 40 psi. This gives a constant drag for a duration of 90 min. The specimen was cut from the developed brake pad to the size of ½″ × x ½″. Care was taken to ensure that not even handfinger prints are present at the active face of the specimen. The specimen was loaded and clamped against the rotating cast iron disc. Before starting of the test, the initial weight and thickness of the sample were noted.
Green strength of the pad after preform process using three-point bend test. FAST machine (FAST: friction assessment and screening test).

Physical, chemical and mechanical properties of AJF brake pad.

Observations of fabricated brake pad
The density of the developed samples has values nearly closer to that of the reference value. The reference values were taken from a recognized Friction material Testing centre namely M/s. Fricmart (P) Ltd, Delhi. Hardness is slightly higher when compared with acrylic based and O.E.M's pad, but well with in the range. In the case of acetone extract, DB02 has a lesser value which shows that curing was good due to lesser value of uncured resins because of good compatibility of the AJ fiber with the resin. The compatibility of the AJ fiber with resin is once again confirmed with both the water and heat swell test results where the value is almost negligible or nil. Loss of ignition value increased because of the poor thermal resistance of both acrylic and AJ fibers. But the increase is not quite significant. Good Fibrization of AJ fiber can be attributed for the excellent shear strength, both in cold and hot conditions. The bonding is reconfirmed by the residue remaining on the backing plate after the cold shear test, which consists of adhesive, underlayer and friction material. From the Figures 13 and 14, it can be seen that the friction material is not totally detached from the backing plate. Adequate amount of residue was left in both the DB 01 & DB 02 which indicates the presence of good bonding strength in both pads.
(a) and (b) showing the thickness of residue left at the backplate of DB 01 indicating excellent bonding during cold shear strength. Adequate amount of residue left in DB 02. Wear rate result in the FAST test.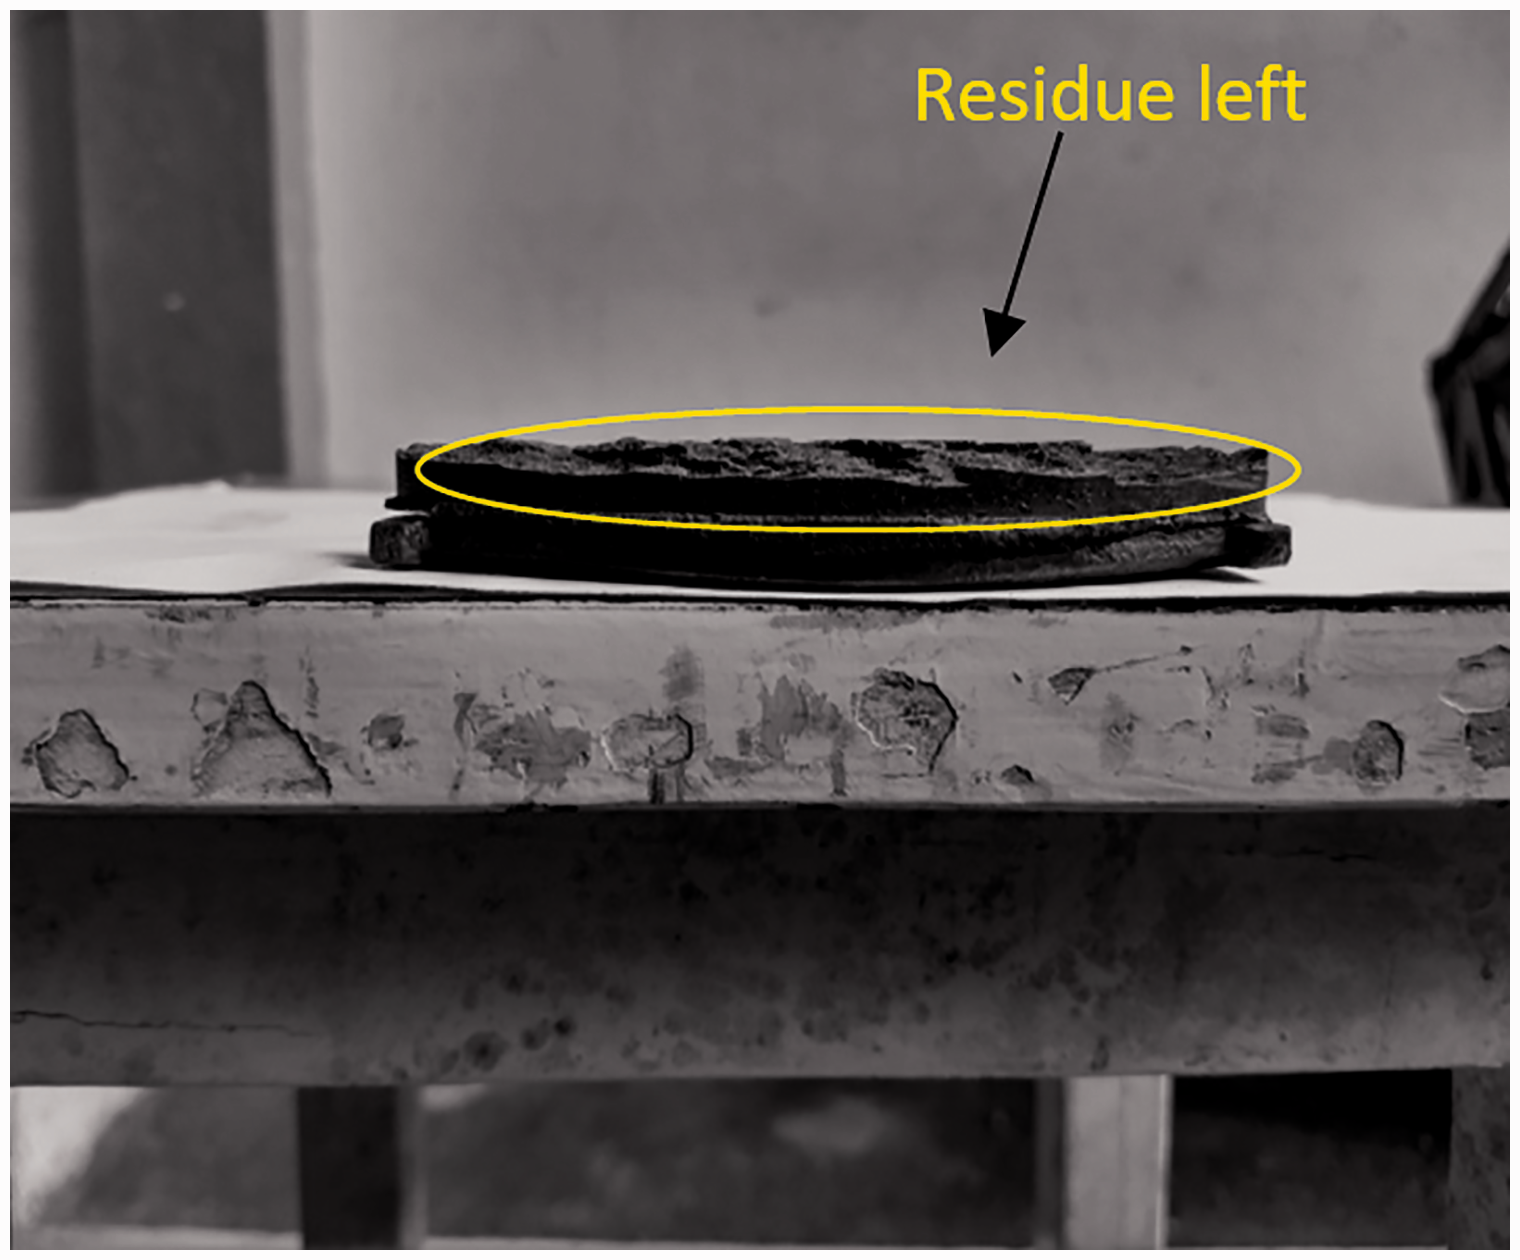


Preform green strength is required in order to ensure unchanging or constant quality control during manufacture. The strength should be sufficient enough to be handled manually by the workers from preform press to curing station. The word “green” represents uncured brake pad which easily gets broken or the compressed powder gets disintegrated while transporting. One successful O.E.M brake pad preform from the industry was also tested for comparison purpose. All the three preforms failed similarly by splitting down the length of the preform. Since the value of DB01 is very close to the DB02 and O.E.M brake pad, green strength of the preform is acceptable and also the handling was observed to be easy.
From the FAST test result show in Figure 15, it was observed that DB 01 has good wear resistance when compared with the DB 02.
The friction test was not performed in this investigation as the AJ fiber was considered as a substitute for Acrylic and hence the physical, chemical, and mechanical properties and wear properties (Test temperature range between 110℃ and 295℃) were compared. The essential physical, chemical, and mechanical properties of the developed composite based on AJF, the values shown are well within the ranges which are recognized as adequate for medium duty braking applications. Hence, AJF can be tried as a possible alternate for synthetic acrylic fibers.
Conclusions
This investigation was done with a priority to examine the chemical composition, the crystalline index, the thermal degradation behavior, and the functional properties of AJF to ascertain its application for the friction composite. The chemical composition test gave promising results in existence of cellulose in AJ fiber of upto 57.80% which was proven by the characterization tests of XRD and FTIR and the density of AJF was found as 1.4005 g/cc which was far lesser than acrylic fiber and hence was thought could be utilized in light weight applications. Even though acrylic fibers had good thermal resistance, i.e. upto 300℃, a thermal stability of upto 219℃ and the unique fibrilization property of AJF were sufficient to consider this fiber as an ingredient in processing aid to replace acrylic fibers, and some interesting observations were made from the use of this fiber in the manufacturing of brake pad which shows that the physical, chemical, and mechanical properties match those of the Acrylic-based brake pad and could be suitable for commercial applications. Since AJ fiber-based brake pad (DB01) provides green strength to preforms, they can be easily handled by workers, thereby ensuring consistency in quality control. The brake pad made with AJF had good filler retention capacity to maintain adequate dispersion and the wear resistance was found as 16% greater than the acrylic fiber-based brake pad as noticed from FAST results. Hence, to conclude, AJF can be tried as possible replacement of the commercial synthetic acrylic fibers for disc brake pad application.
Footnotes
Declaration of conflicting interests
The author(s) declared no potential conflicts of interest with respect to the research, authorship, and/or publication of this article.
Funding
The author(s) received no financial support for the research, authorship, and/or publication of this article.